| Param | Original file | Final file |
|---|---|---|
| Filename | modeM0/AS1T01_191T01_9000001536_10639cztM0_level2.evt | modeM0/AS1T01_191T01_9000001536_10639cztM0_level2_quad_clean.evt |
| Size (bytes) | 459,233,280 | 78,897,600 |
| Size | 438.0 MB | 75.2 MB |
| Events in quadrant A | 2,828,147 | 508,888 |
| Events in quadrant B | 3,717,475 | 507,910 |
| Events in quadrant C | 3,598,501 | 499,695 |
| Events in quadrant D | 3,376,603 | 473,713 |
| Mode SS | |||
|---|---|---|---|
| Quadrant | BADHDUFLAG | Total packets | Discarded packets |
| A | 0 | 118 | 0 |
| B | 0 | 118 | 0 |
| C | 0 | 118 | 0 |
| D | 0 | 118 | 0 |
| Mode M9 | |||
|---|---|---|---|
| Quadrant | BADHDUFLAG | Total packets | Discarded packets |
| A | 0 | 13 | 0 |
| B | 0 | 13 | 0 |
| C | 0 | 13 | 0 |
| D | 0 | 13 | 0 |
| Mode M0 | |||
|---|---|---|---|
| Quadrant | BADHDUFLAG | Total packets | Discarded packets |
| A | 0 | 12106 | 2 |
| B | 0 | 14694 | 1 |
| C | 0 | 14760 | 1 |
| D | 0 | 13759 | 1 |
| Quadrant | Total seconds | Saturated seconds | Saturation percentage |
|---|---|---|---|
| A | 5699 | 11 | 0.193016% |
| B | 5699 | 172 | 3.018073% |
| C | 5699 | 80 | 1.403755% |
| D | 5699 | 60 | 1.052816% |
Noise dominated data is calculated using 1-second bins in cleaned event files. If a bin has >2000 counts, and if more than 50% of those come from <1% of pixels, then it is considered to be noise-dominated and hence unusable.
| Quadrant | # 1 sec bins | Bins with >0 counts | Bins with >2000 counts | High rate bins dominated by noise | Noise dominated (total time) | Noise dominated (detector-on time) | Marked lightcurve |
|---|---|---|---|---|---|---|---|
| A | 7029 | 5700 | 0 | 0 | 0.00% | 0.00% | 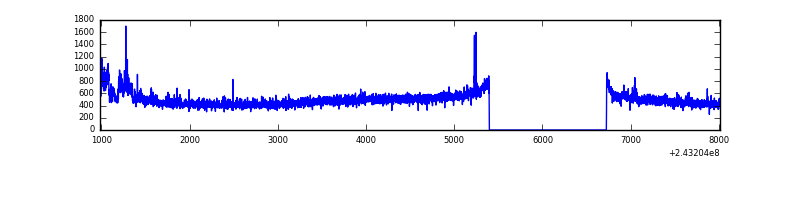 |
| B | 7029 | 5700 | 84 | 84 | 1.20% | 1.47% | 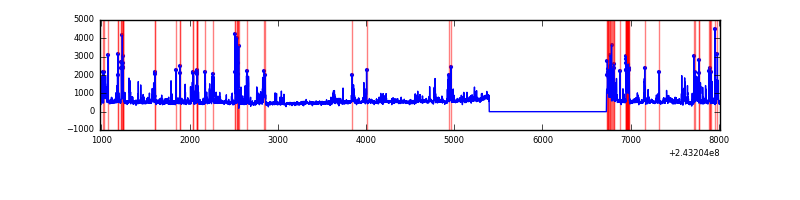 |
| C | 7029 | 5700 | 66 | 66 | 0.94% | 1.16% | 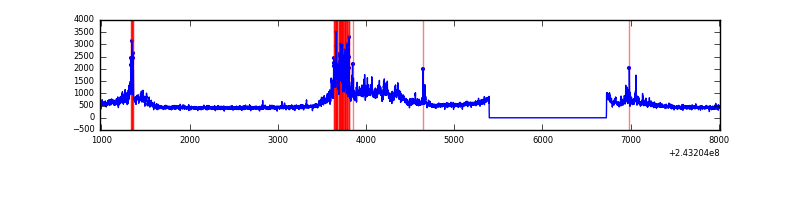 |
| D | 7029 | 5700 | 37 | 37 | 0.53% | 0.65% | 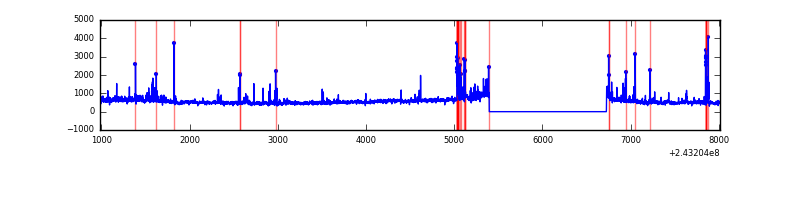 |
Top three noisy pixels from each quadrant. If the there are fewer than three noisy pixels in the level2.evt file, extra rows are filled as -1
| Pixel properties | Quadrant properties | ||||||
|---|---|---|---|---|---|---|---|
| Quadrant | DetID | PixID | Counts | Sigma | Mean | Median | Sigma |
| A | 13 | 251 | 81269 | 554.86 | 704 | 691 | 145.2 |
| A | 1 | 162 | 15110 | 99.29 | 704 | 691 | 145.2 |
| A | 15 | 174 | 7324 | 45.68 | 704 | 691 | 145.2 |
| B | 4 | 239 | 847248 | 6335.91 | 704 | 689 | 133.6 |
| B | 0 | 214 | 57710 | 426.76 | 704 | 689 | 133.6 |
| B | 0 | 219 | 50930 | 376.02 | 704 | 689 | 133.6 |
| C | 4 | 254 | 938822 | 5991.68 | 679 | 685 | 156.6 |
| C | 14 | 234 | 8135 | 47.58 | 679 | 685 | 156.6 |
| C | 13 | 61 | 5107 | 28.24 | 679 | 685 | 156.6 |
| D | 8 | 195 | 337755 | 2093.11 | 667 | 650 | 161.1 |
| D | 2 | 16 | 166336 | 1028.76 | 667 | 650 | 161.1 |
| D | 1 | 52 | 165431 | 1023.14 | 667 | 650 | 161.1 |
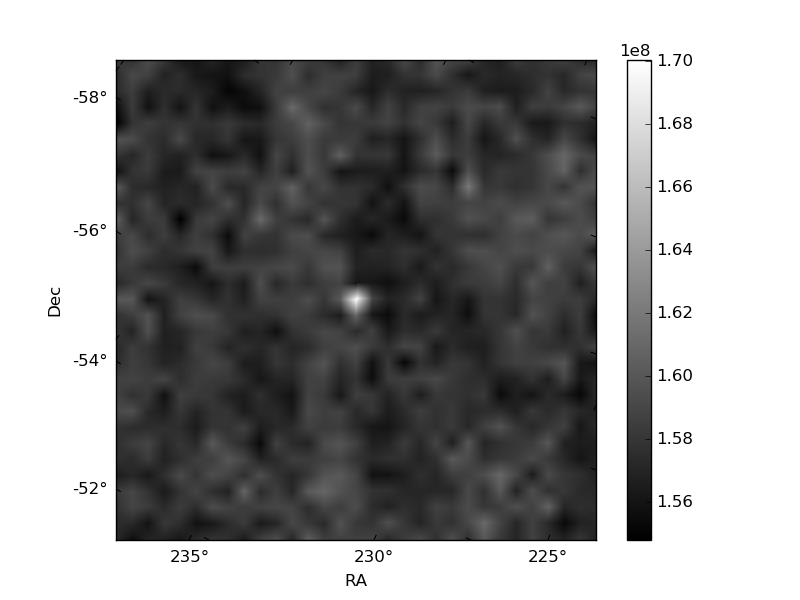
Histogram calculated using DETX and DETY for each event in the final _common_clean file
| Quadrant A | 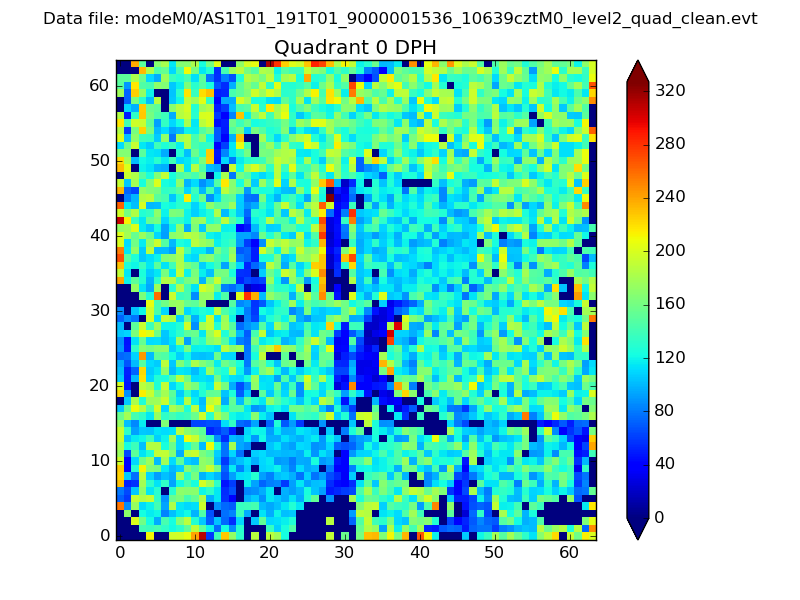 |
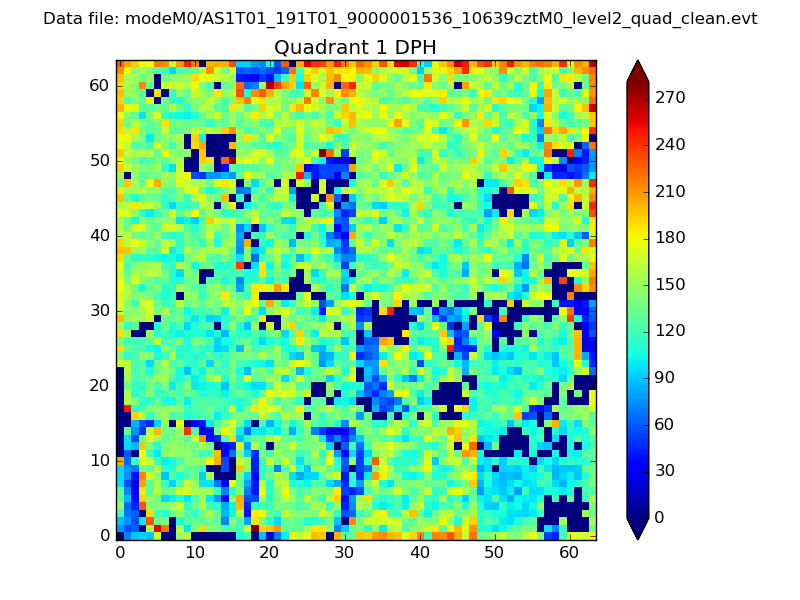 |
Quadrant B |
|---|---|---|---|
| Quadrant D | 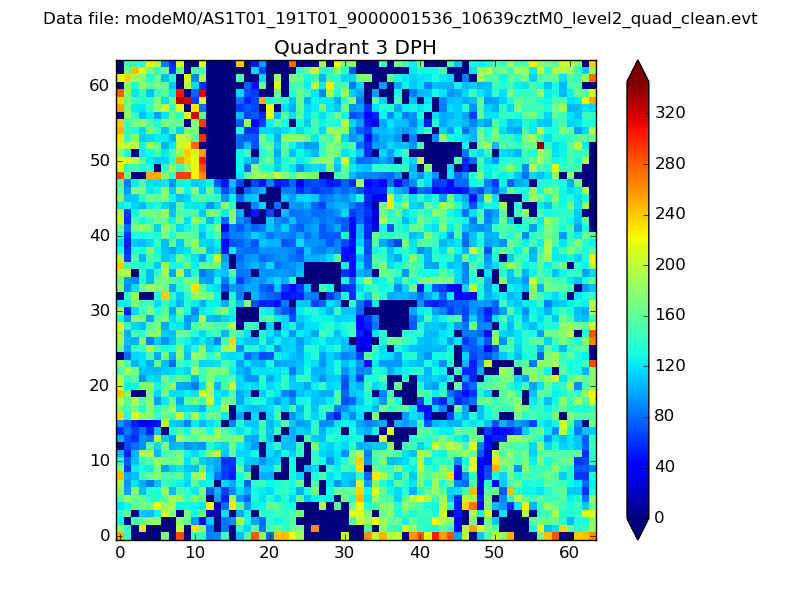 |
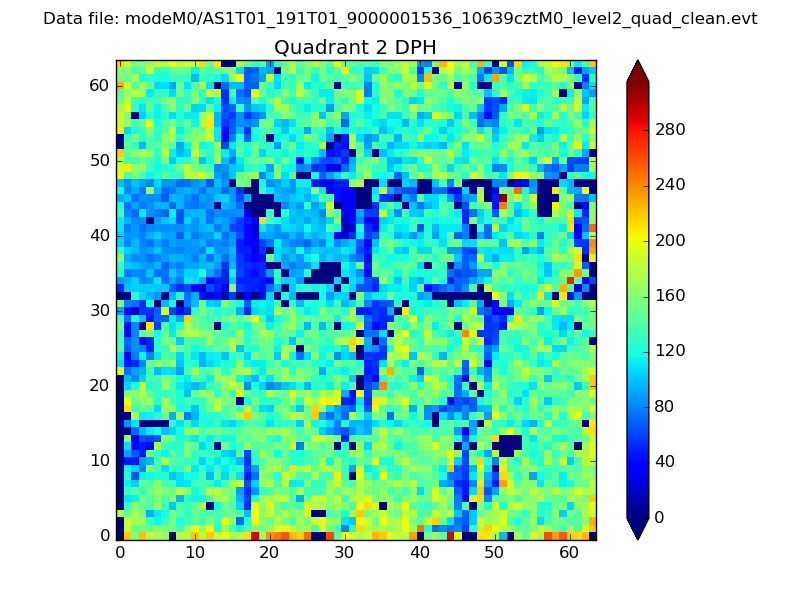 |
Quadrant C |
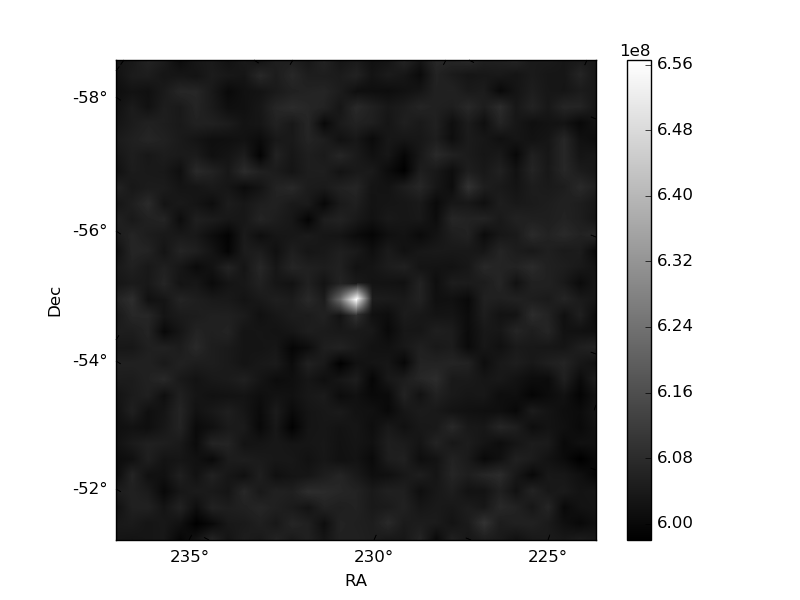
| Plot type | Count rate plots | Images |
|---|---|---|
| Comparison with Poisson distribution Blue bars denote a histogram of data divided into 1 sec bins. Red curve is a Poisson curve with rate = median count rate of data. |
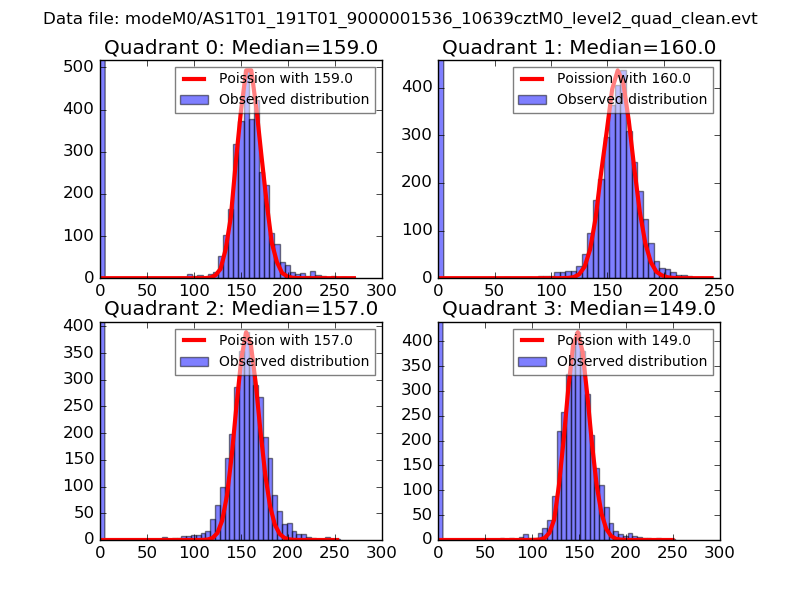 |
 |
| Quadrant-wise count rates Data is divided into 100 sec bins |
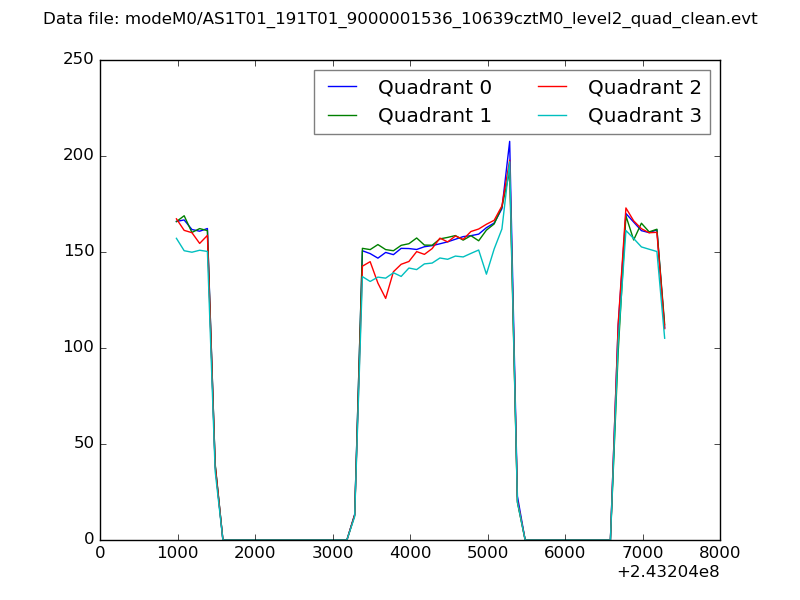 |
|
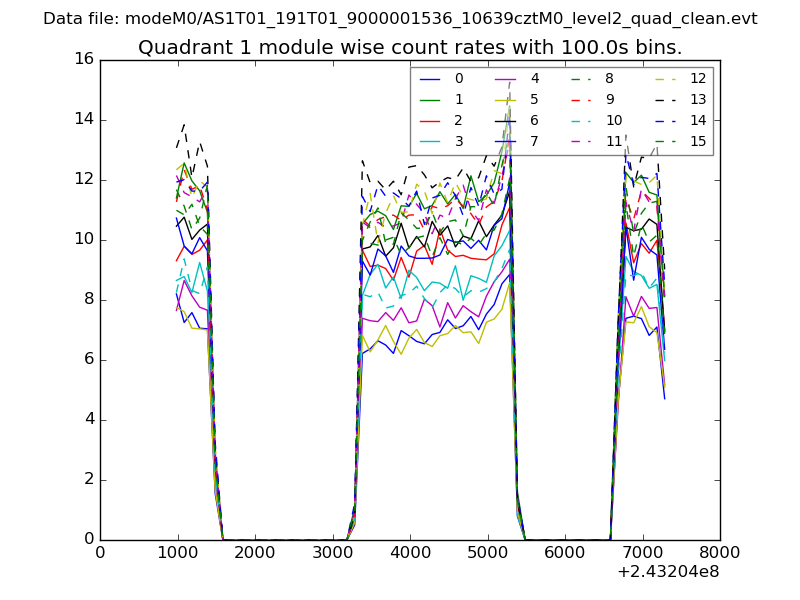
| Module-wise count rates for Quadrant A Data is divided into 100 sec bins |
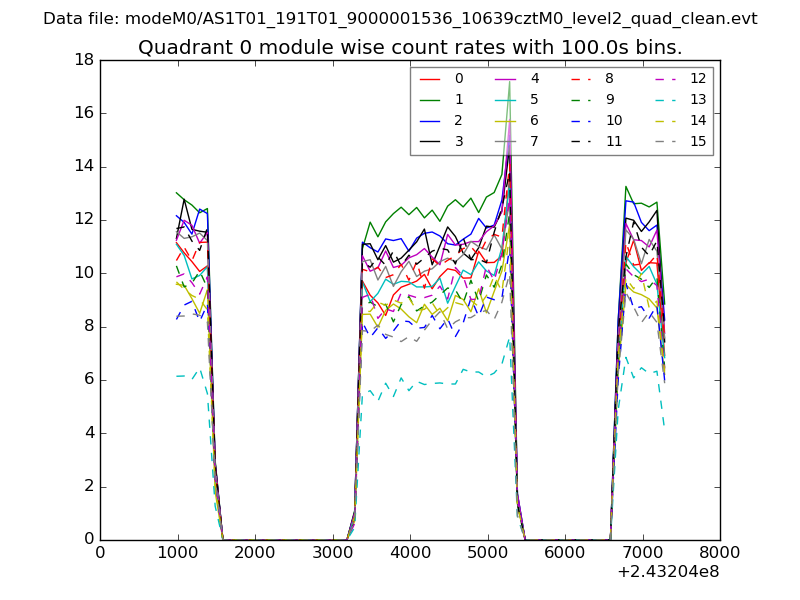 |
 |
| Module-wise count rates for Quadrant B Data is divided into 100 sec bins |
 |
 |
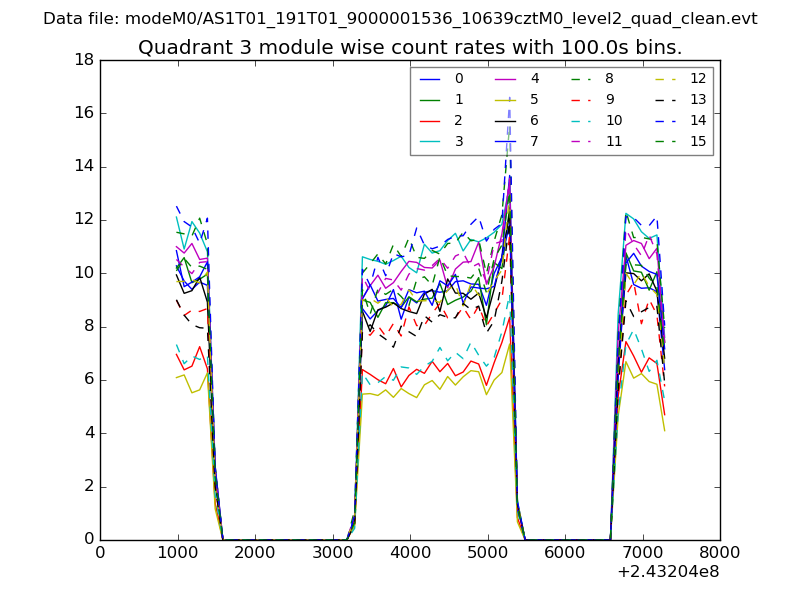
| Module-wise count rates for Quadrant C Data is divided into 100 sec bins |
 |
 |
| Module-wise count rates for Quadrant D Data is divided into 100 sec bins |
 |
 |
| Parameter | Plot |
|---|---|
| CZT HV Monitor | 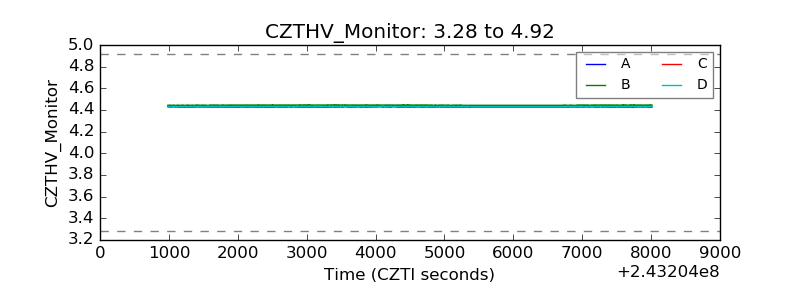 |
| D_VDD | 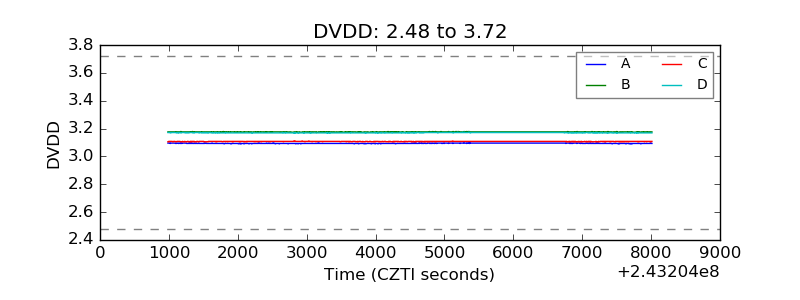 |
| Temperature 1 | 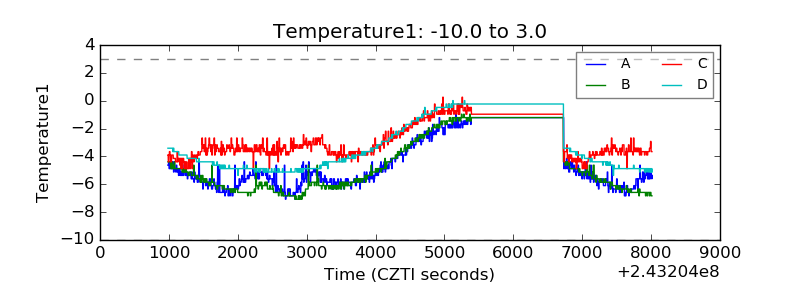 |
| Veto HV Monitor | 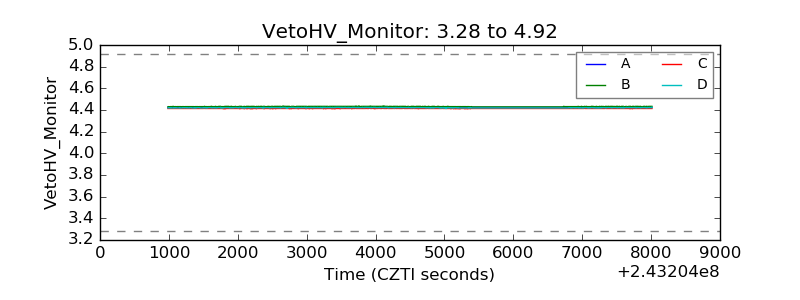 |
| Veto LLD | 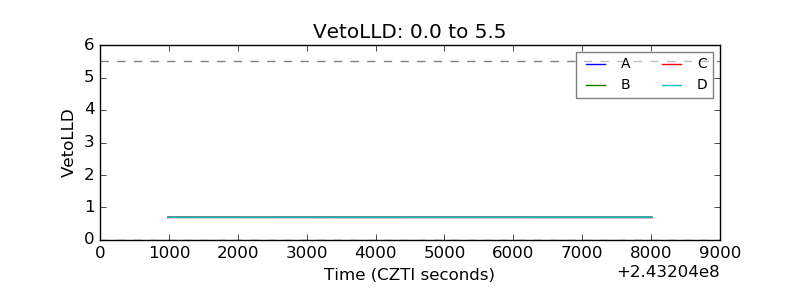 |
| Alpha Counter | 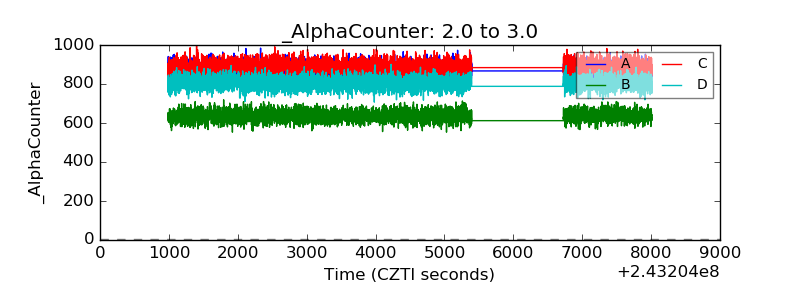 |
| _CPM_Rate | 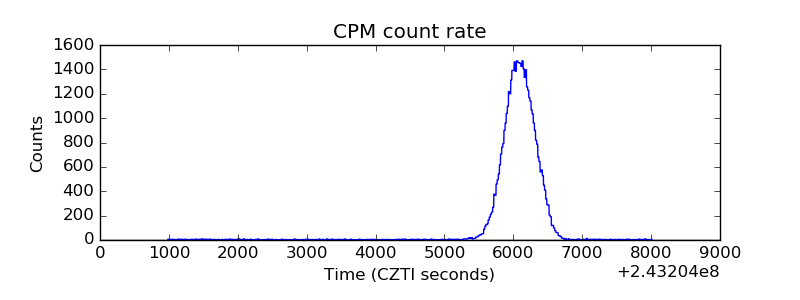 |
| CZT Counter | 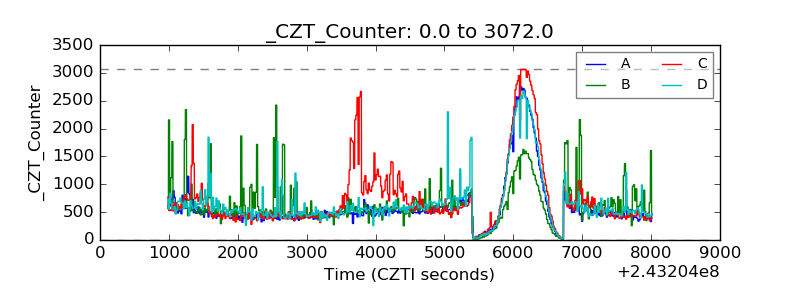 |
| +2.5 Volts monitor |  |
| +5 Volts monitor | 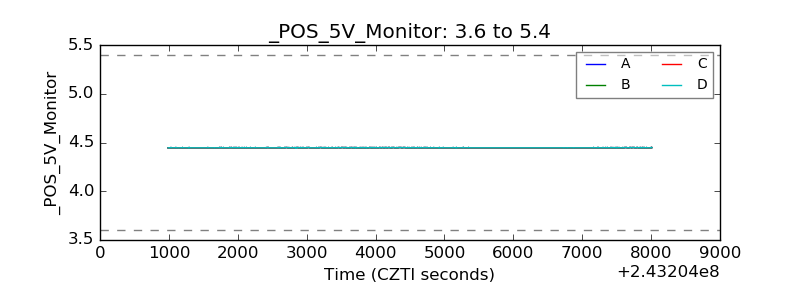 |
| _ROLL_ROT | 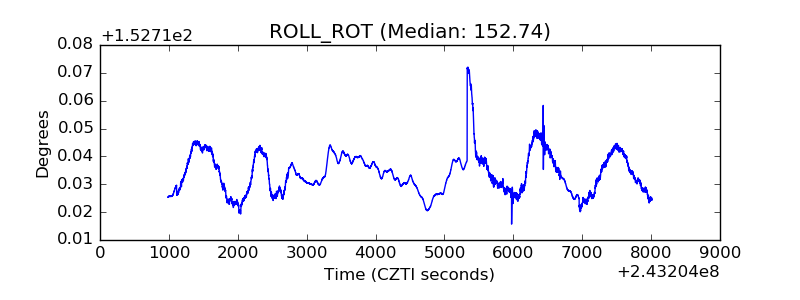 |
| _Roll_DEC | 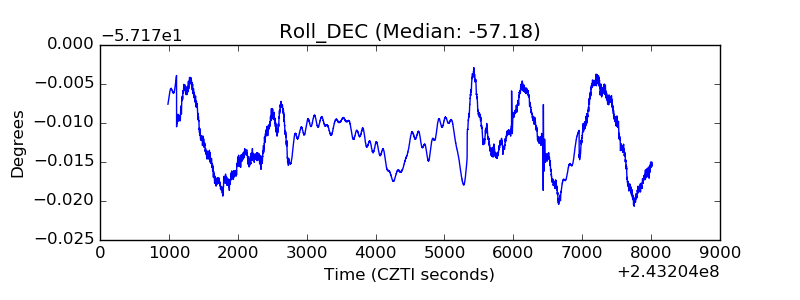 |
| _Roll_RA | 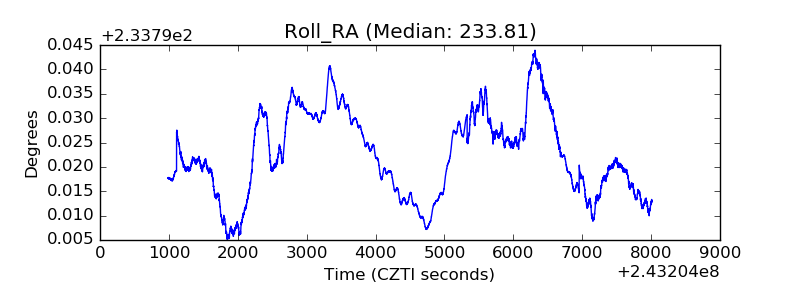 |
| Veto Counter | 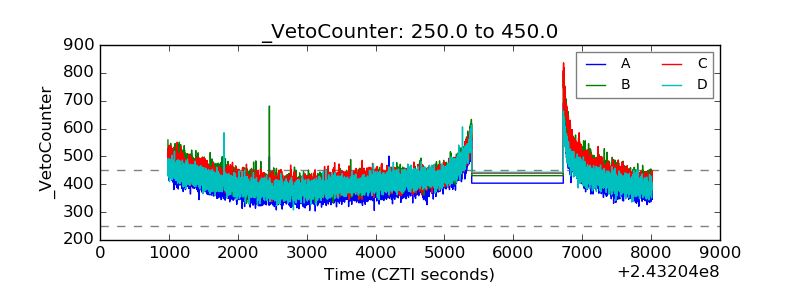 |