| Param | Original file | Final file |
|---|---|---|
| Filename | modeM0/AS1T01_191T01_9000001536_10641cztM0_level2.evt | modeM0/AS1T01_191T01_9000001536_10641cztM0_level2_quad_clean.evt |
| Size (bytes) | 534,836,160 | 87,007,680 |
| Size | 510.1 MB | 83.0 MB |
| Events in quadrant A | 3,802,633 | 547,083 |
| Events in quadrant B | 4,128,331 | 539,493 |
| Events in quadrant C | 4,019,980 | 546,673 |
| Events in quadrant D | 3,779,276 | 521,499 |
| Mode SS | |||
|---|---|---|---|
| Quadrant | BADHDUFLAG | Total packets | Discarded packets |
| A | 0 | 140 | 0 |
| B | 0 | 140 | 0 |
| C | 0 | 140 | 0 |
| D | 0 | 140 | 0 |
| Mode M9 | |||
|---|---|---|---|
| Quadrant | BADHDUFLAG | Total packets | Discarded packets |
| A | 0 | 14 | 0 |
| B | 0 | 14 | 0 |
| C | 0 | 14 | 0 |
| D | 0 | 15 | 0 |
| Mode M0 | |||
|---|---|---|---|
| Quadrant | BADHDUFLAG | Total packets | Discarded packets |
| A | 0 | 15856 | 3 |
| B | 0 | 16774 | 2 |
| C | 0 | 16734 | 2 |
| D | 0 | 15727 | 2 |
| Quadrant | Total seconds | Saturated seconds | Saturation percentage |
|---|---|---|---|
| A | 6889 | 205 | 2.975758% |
| B | 6889 | 283 | 4.107998% |
| C | 6889 | 250 | 3.628974% |
| D | 6889 | 103 | 1.495137% |
Noise dominated data is calculated using 1-second bins in cleaned event files. If a bin has >2000 counts, and if more than 50% of those come from <1% of pixels, then it is considered to be noise-dominated and hence unusable.
| Quadrant | # 1 sec bins | Bins with >0 counts | Bins with >2000 counts | High rate bins dominated by noise | Noise dominated (total time) | Noise dominated (detector-on time) | Marked lightcurve |
|---|---|---|---|---|---|---|---|
| A | 7584 | 6890 | 115 | 115 | 1.52% | 1.67% | 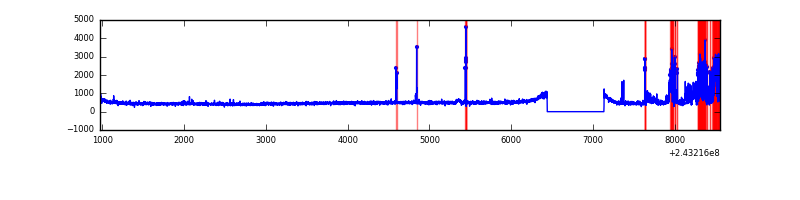 |
| B | 7584 | 6890 | 109 | 109 | 1.44% | 1.58% | 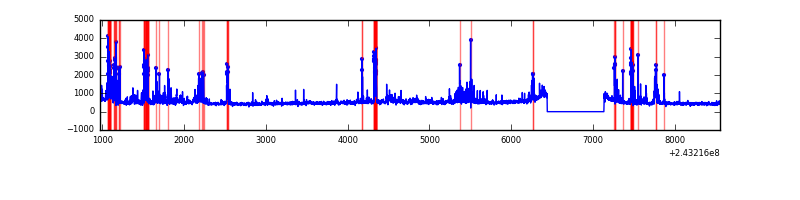 |
| C | 7584 | 6890 | 155 | 155 | 2.04% | 2.25% | 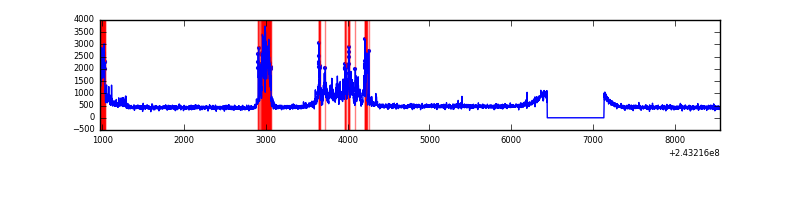 |
| D | 7584 | 6890 | 34 | 34 | 0.45% | 0.49% | 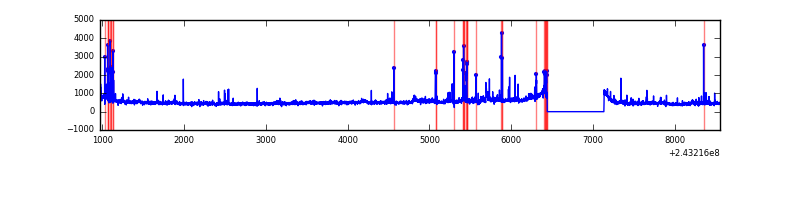 |
Top three noisy pixels from each quadrant. If the there are fewer than three noisy pixels in the level2.evt file, extra rows are filled as -1
| Pixel properties | Quadrant properties | ||||||
|---|---|---|---|---|---|---|---|
| Quadrant | DetID | PixID | Counts | Sigma | Mean | Median | Sigma |
| A | 15 | 239 | 530286 | 3086.85 | 828 | 811 | 171.5 |
| A | 15 | 174 | 40600 | 231.97 | 828 | 811 | 171.5 |
| A | 1 | 162 | 10370 | 55.73 | 828 | 811 | 171.5 |
| B | 4 | 239 | 731771 | 4607.29 | 829 | 810 | 158.7 |
| B | 0 | 214 | 75941 | 473.56 | 829 | 810 | 158.7 |
| B | 3 | 189 | 47947 | 297.11 | 829 | 810 | 158.7 |
| C | 4 | 254 | 839179 | 4471.75 | 808 | 814 | 187.5 |
| C | 14 | 234 | 22791 | 117.22 | 808 | 814 | 187.5 |
| C | 4 | 175 | 6028 | 27.81 | 808 | 814 | 187.5 |
| D | 8 | 195 | 277132 | 1426.88 | 801 | 780 | 193.7 |
| D | 1 | 20 | 141548 | 726.82 | 801 | 780 | 193.7 |
| D | 2 | 16 | 122479 | 628.36 | 801 | 780 | 193.7 |
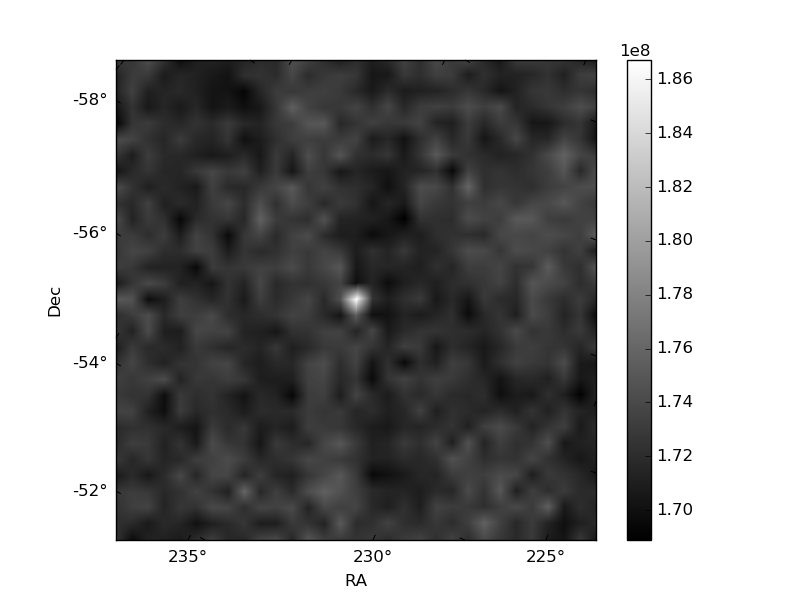
Histogram calculated using DETX and DETY for each event in the final _common_clean file
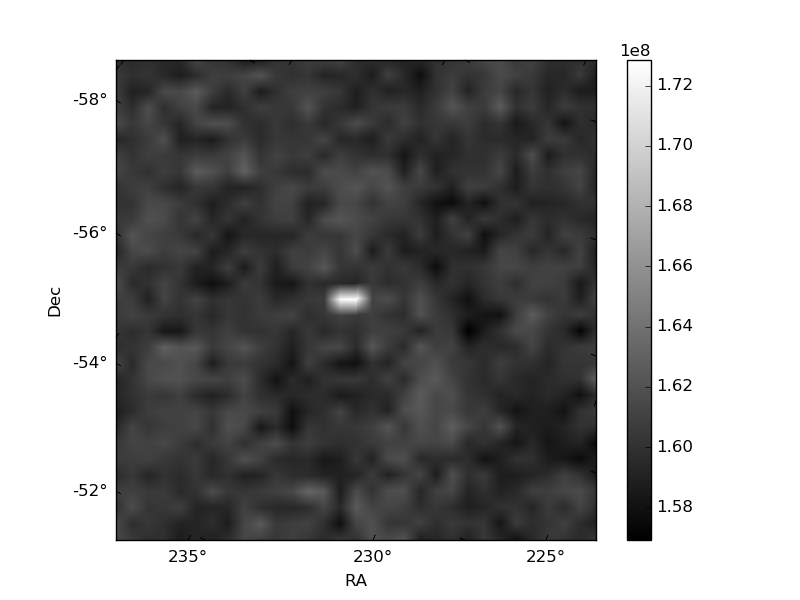
| Quadrant A | 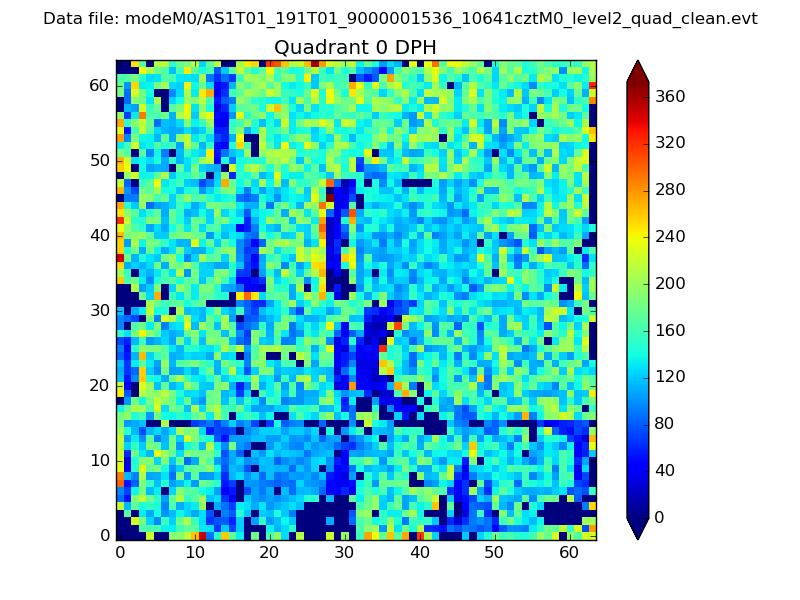 |
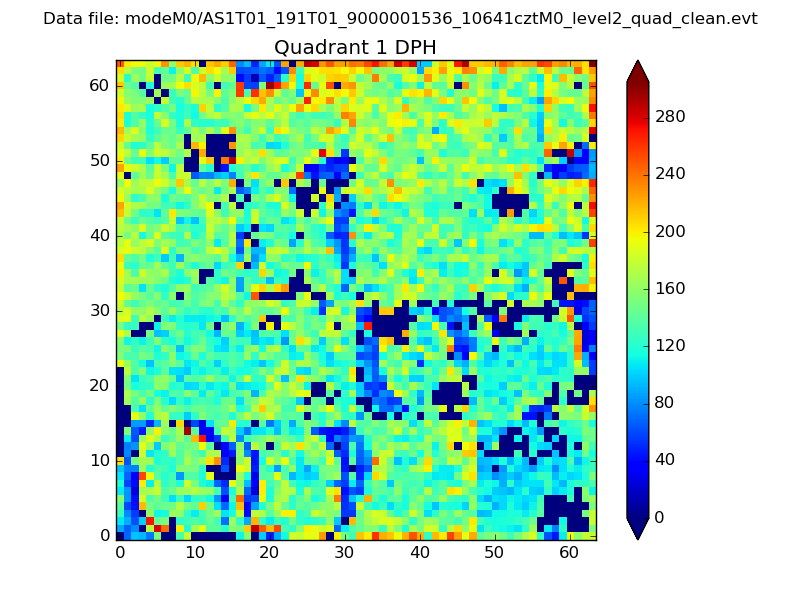 |
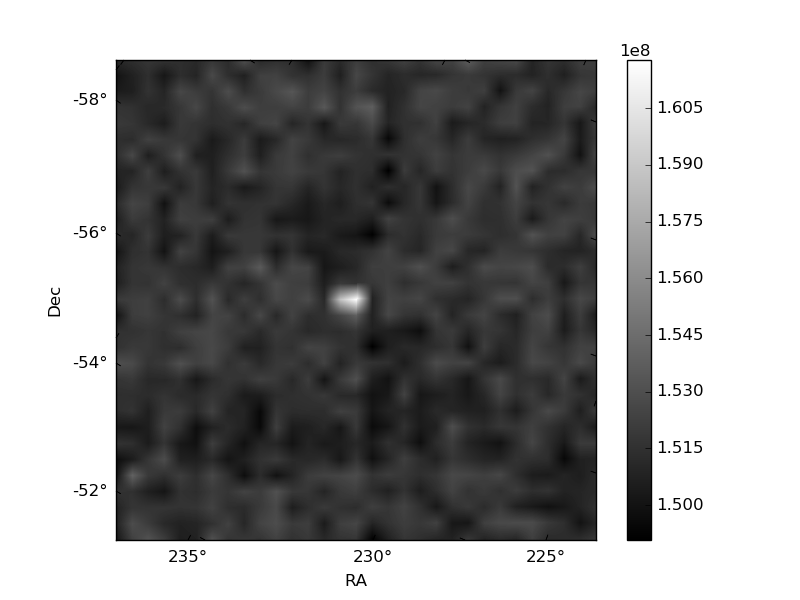
Quadrant B |
|---|---|---|---|
| Quadrant D | 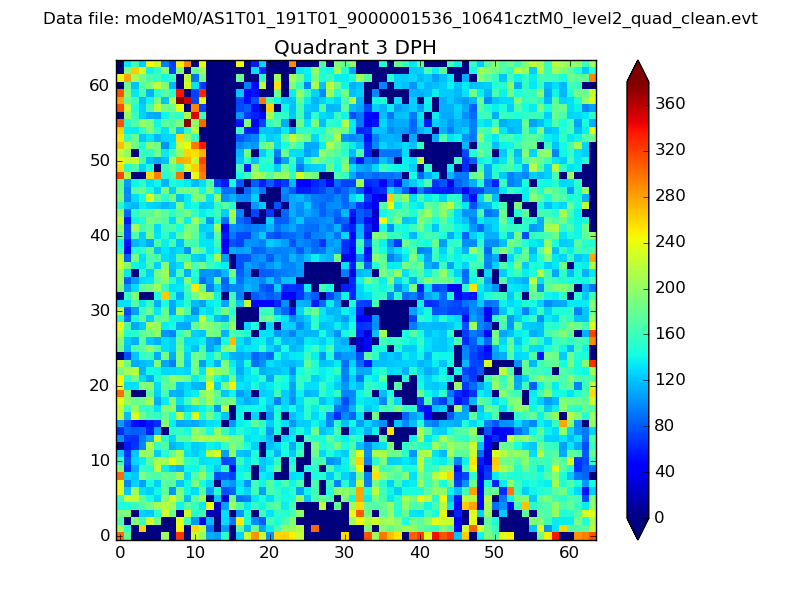 |
 |
Quadrant C |
| Plot type | Count rate plots | Images |
|---|---|---|
| Comparison with Poisson distribution Blue bars denote a histogram of data divided into 1 sec bins. Red curve is a Poisson curve with rate = median count rate of data. |
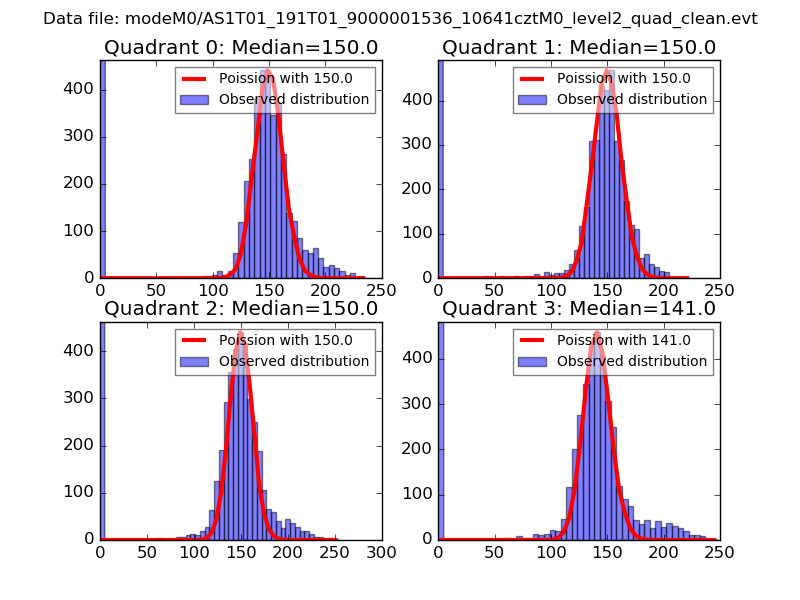 |
 |
| Quadrant-wise count rates Data is divided into 100 sec bins |
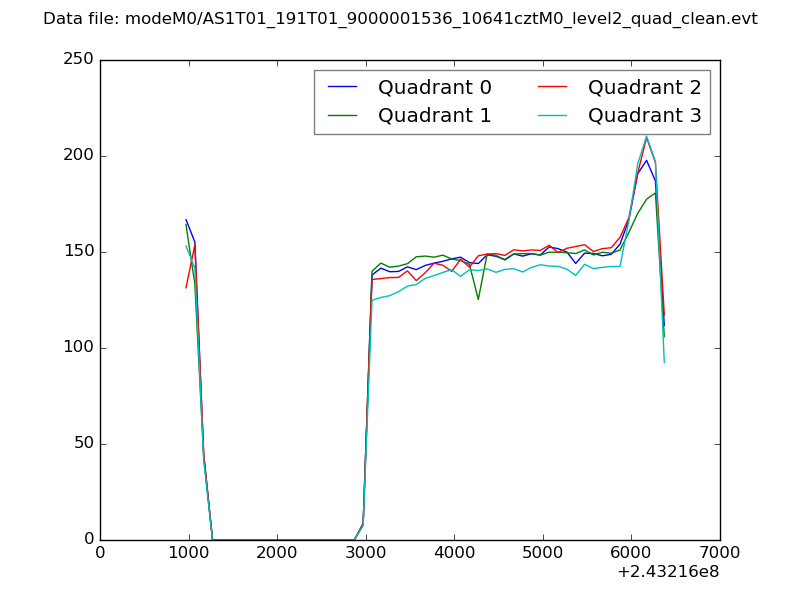 |
|
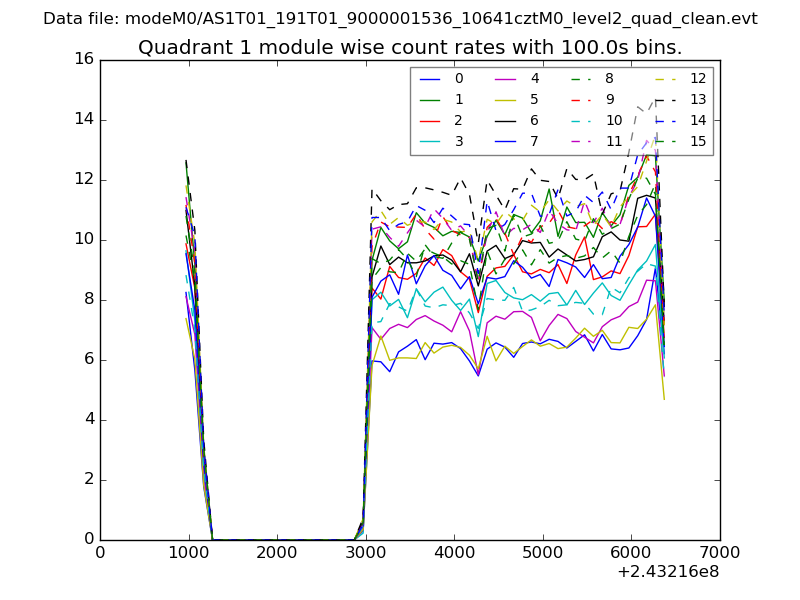
| Module-wise count rates for Quadrant A Data is divided into 100 sec bins |
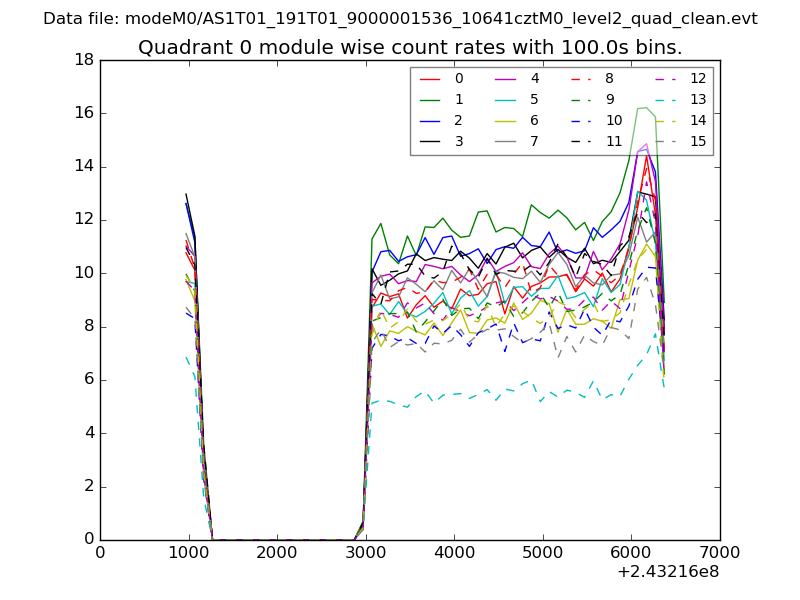 |
 |
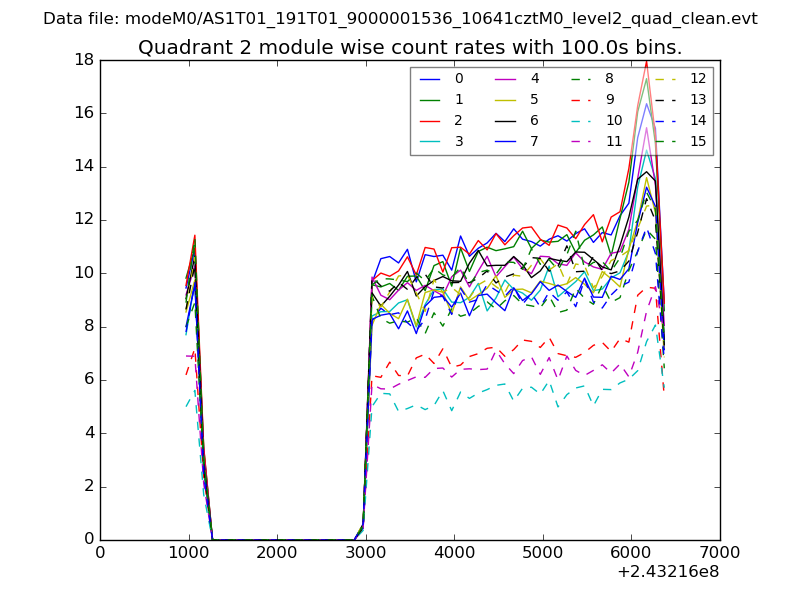
| Module-wise count rates for Quadrant B Data is divided into 100 sec bins |
 |
 |
| Module-wise count rates for Quadrant C Data is divided into 100 sec bins |
 |
 |
| Module-wise count rates for Quadrant D Data is divided into 100 sec bins |
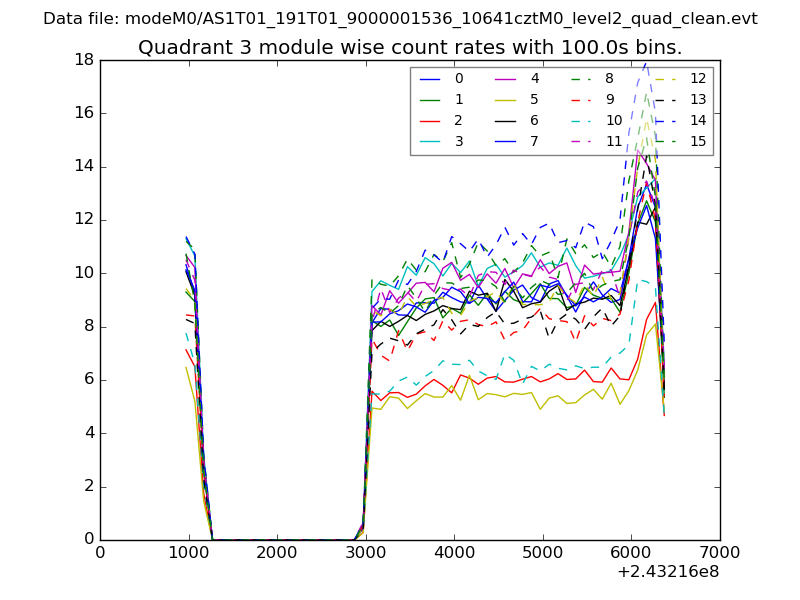 |
 |
| Parameter | Plot |
|---|---|
| CZT HV Monitor | 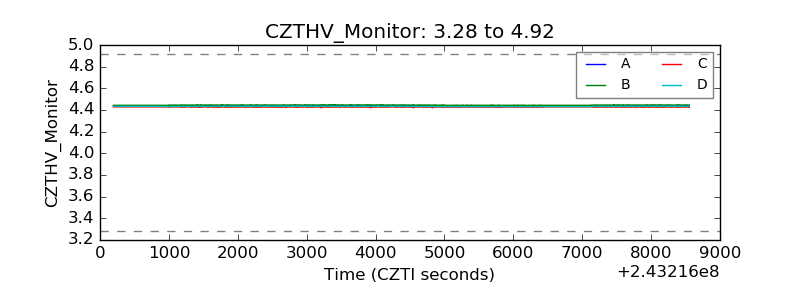 |
| D_VDD | 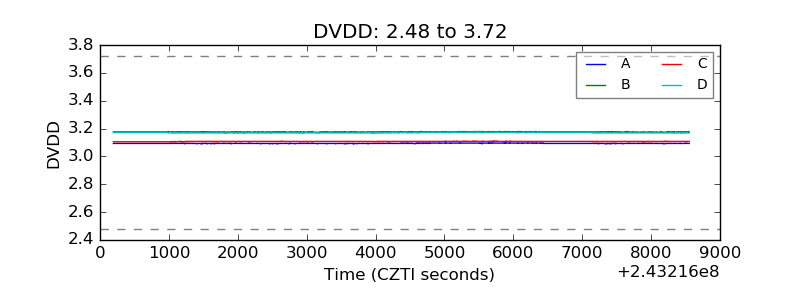 |
| Temperature 1 | 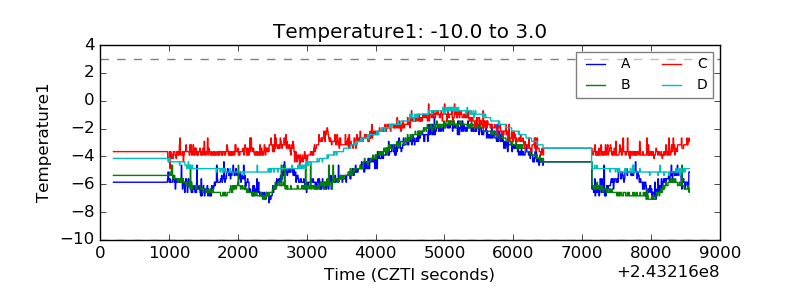 |
| Veto HV Monitor | 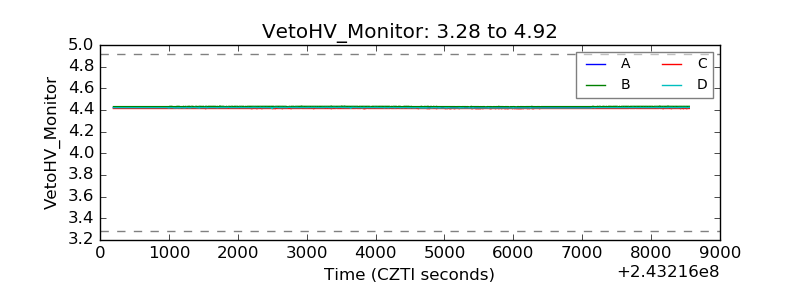 |
| Veto LLD | 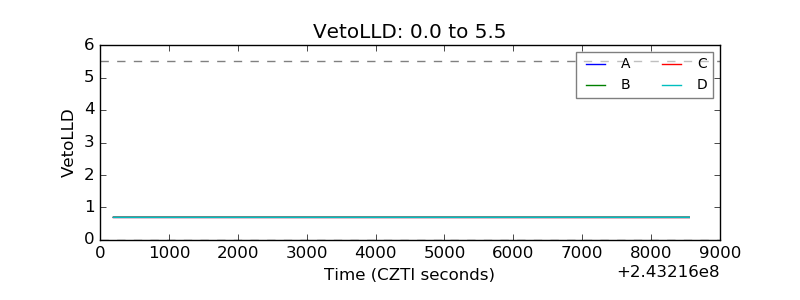 |
| Alpha Counter | 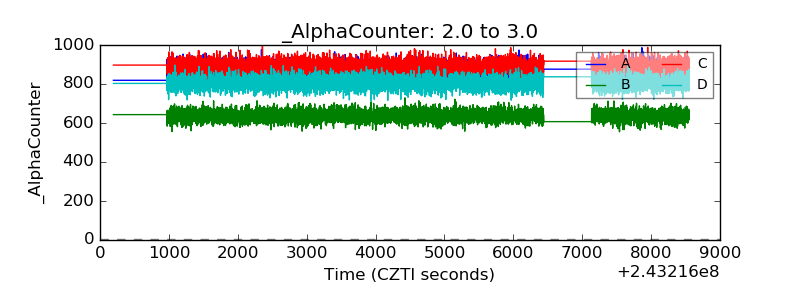 |
| _CPM_Rate | 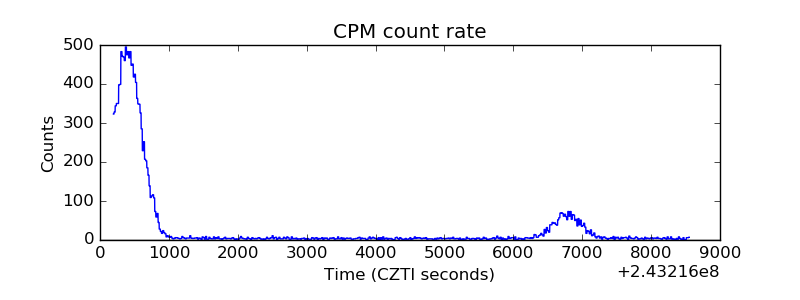 |
| CZT Counter | 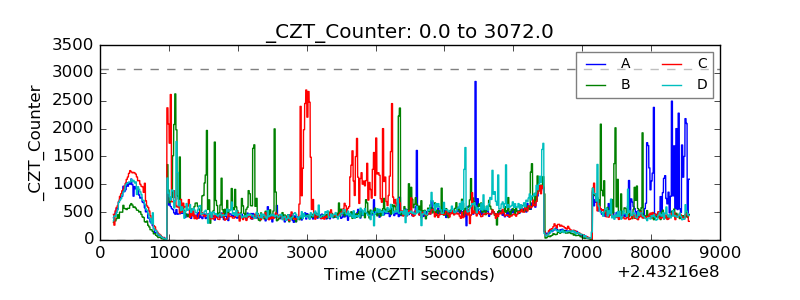 |
| +2.5 Volts monitor |  |
| +5 Volts monitor |  |
| _ROLL_ROT | 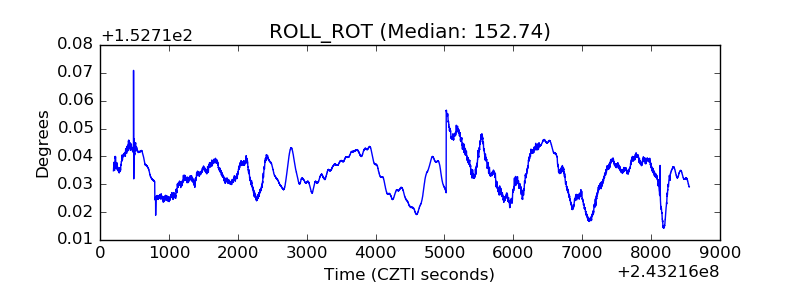 |
| _Roll_DEC |  |
| _Roll_RA | 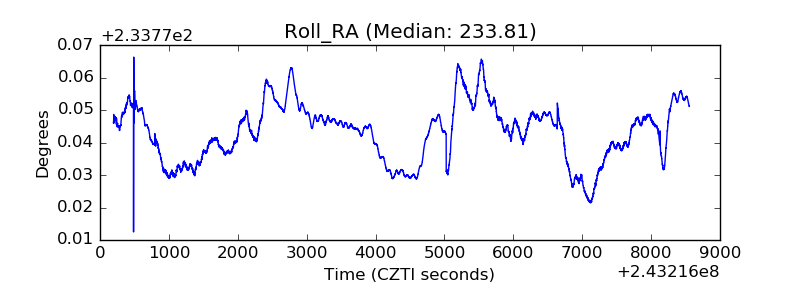 |
| Veto Counter | 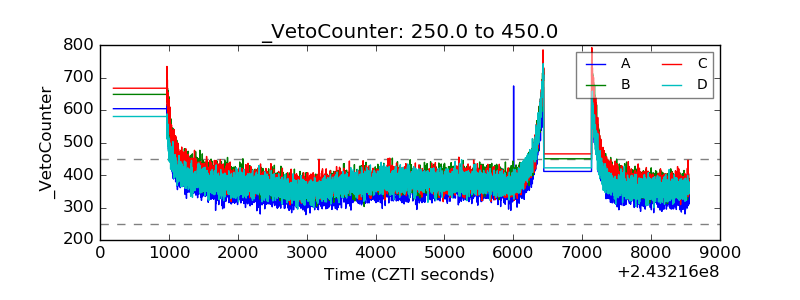 |