| Param | Original file | Final file |
|---|---|---|
| Filename | modeM0/AS1T01_191T01_9000001536_10642cztM0_level2.evt | modeM0/AS1T01_191T01_9000001536_10642cztM0_level2_quad_clean.evt |
| Size (bytes) | 651,418,560 | 96,793,920 |
| Size | 621.2 MB | 92.3 MB |
| Events in quadrant A | 4,511,342 | 611,227 |
| Events in quadrant B | 4,972,644 | 606,924 |
| Events in quadrant C | 4,732,363 | 601,292 |
| Events in quadrant D | 4,982,687 | 568,653 |
| Mode SS | |||
|---|---|---|---|
| Quadrant | BADHDUFLAG | Total packets | Discarded packets |
| A | 0 | 158 | 0 |
| B | 0 | 158 | 0 |
| C | 0 | 158 | 0 |
| D | 0 | 158 | 0 |
| Mode M9 | |||
|---|---|---|---|
| Quadrant | BADHDUFLAG | Total packets | Discarded packets |
| A | 0 | 5 | 0 |
| B | 0 | 5 | 0 |
| C | 0 | 5 | 0 |
| D | 0 | 6 | 0 |
| Mode M0 | |||
|---|---|---|---|
| Quadrant | BADHDUFLAG | Total packets | Discarded packets |
| A | 0 | 18467 | 3 |
| B | 0 | 19892 | 2 |
| C | 0 | 19406 | 2 |
| D | 0 | 19933 | 2 |
| Quadrant | Total seconds | Saturated seconds | Saturation percentage |
|---|---|---|---|
| A | 7809 | 365 | 4.674094% |
| B | 7809 | 601 | 7.696248% |
| C | 7809 | 536 | 6.863875% |
| D | 7809 | 354 | 4.533231% |
Noise dominated data is calculated using 1-second bins in cleaned event files. If a bin has >2000 counts, and if more than 50% of those come from <1% of pixels, then it is considered to be noise-dominated and hence unusable.
| Quadrant | # 1 sec bins | Bins with >0 counts | Bins with >2000 counts | High rate bins dominated by noise | Noise dominated (total time) | Noise dominated (detector-on time) | Marked lightcurve |
|---|---|---|---|---|---|---|---|
| A | 7954 | 7811 | 166 | 166 | 2.09% | 2.13% | 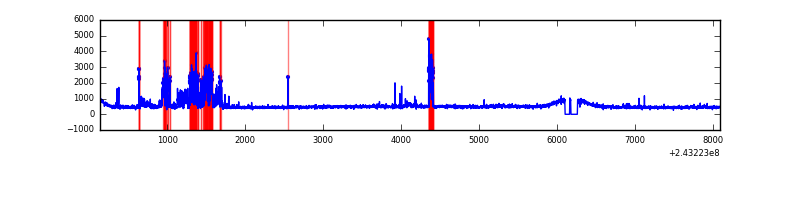 |
| B | 7954 | 7811 | 201 | 201 | 2.53% | 2.57% | 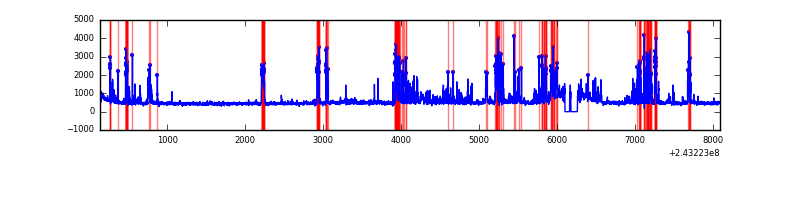 |
| C | 7954 | 7811 | 282 | 282 | 3.55% | 3.61% | 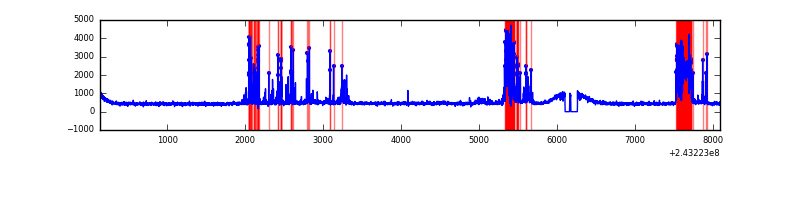 |
| D | 7954 | 7811 | 148 | 148 | 1.86% | 1.89% | 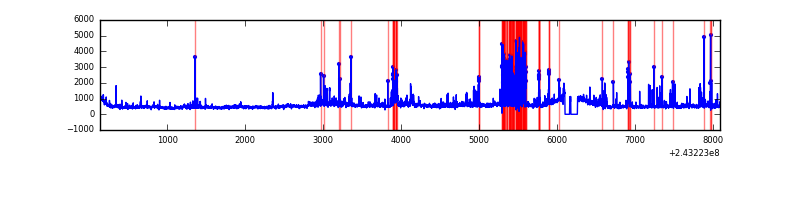 |
Top three noisy pixels from each quadrant. If the there are fewer than three noisy pixels in the level2.evt file, extra rows are filled as -1
| Pixel properties | Quadrant properties | ||||||
|---|---|---|---|---|---|---|---|
| Quadrant | DetID | PixID | Counts | Sigma | Mean | Median | Sigma |
| A | 15 | 239 | 798531 | 4129.68 | 940 | 922 | 193.1 |
| A | 13 | 251 | 28902 | 144.87 | 940 | 922 | 193.1 |
| A | 1 | 162 | 18565 | 91.35 | 940 | 922 | 193.1 |
| B | 4 | 239 | 1091246 | 6044.12 | 935 | 913 | 180.4 |
| B | 4 | 81 | 73860 | 404.37 | 935 | 913 | 180.4 |
| B | 0 | 214 | 49023 | 266.69 | 935 | 913 | 180.4 |
| C | 4 | 254 | 842915 | 4023.27 | 901 | 908 | 209.3 |
| C | 14 | 234 | 372826 | 1777.1 | 901 | 908 | 209.3 |
| C | 13 | 61 | 6704 | 27.69 | 901 | 908 | 209.3 |
| D | 12 | 221 | 402065 | 1807.81 | 905 | 880 | 221.9 |
| D | 12 | 233 | 329633 | 1481.42 | 905 | 880 | 221.9 |
| D | 8 | 195 | 306239 | 1376.0 | 905 | 880 | 221.9 |
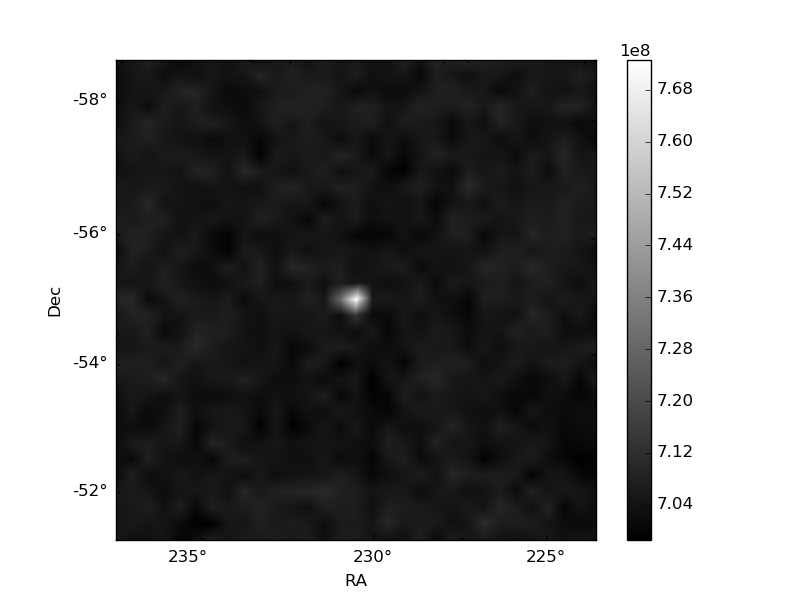
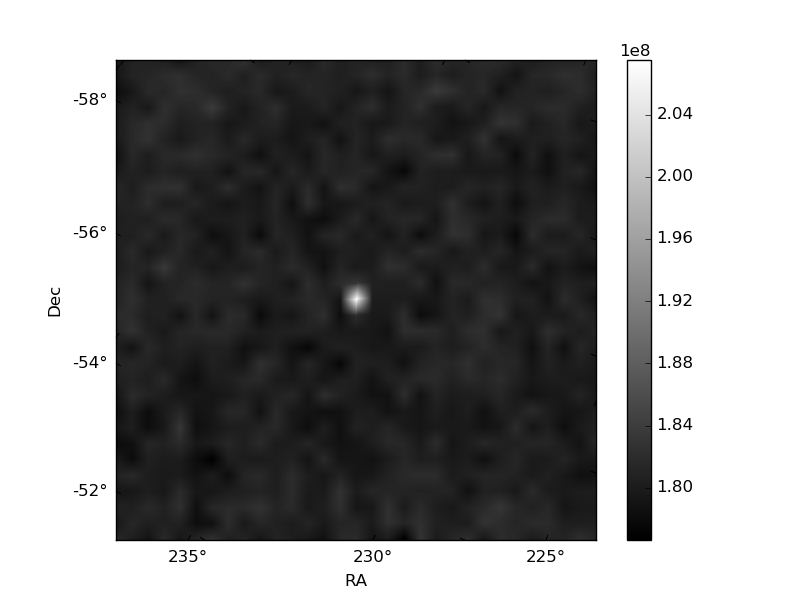
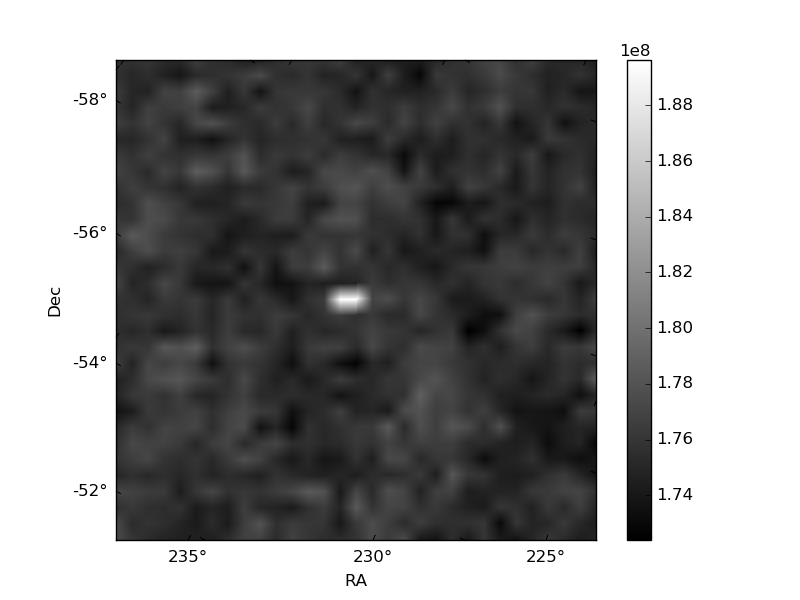
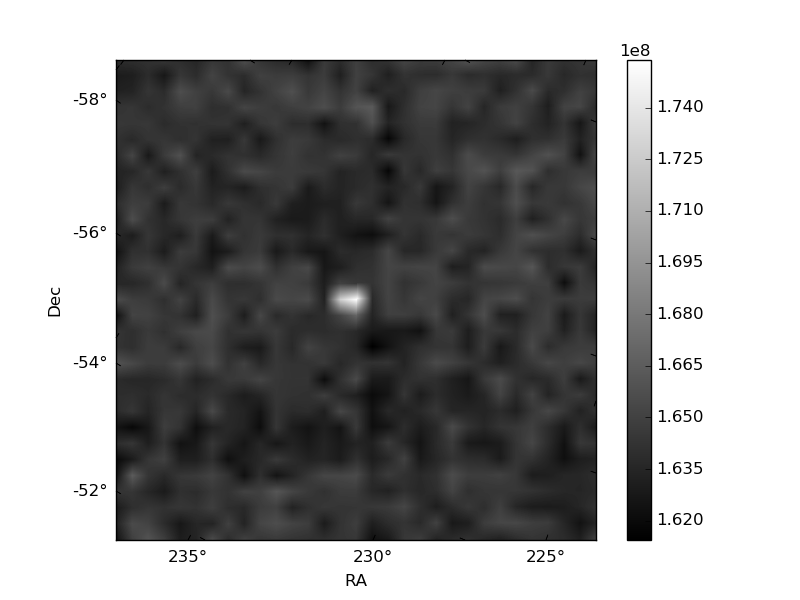
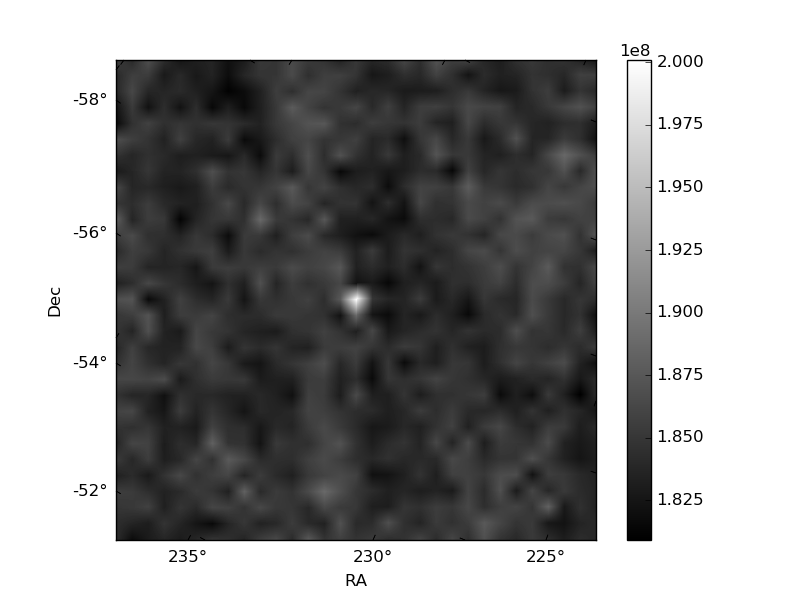
Histogram calculated using DETX and DETY for each event in the final _common_clean file
| Quadrant A | 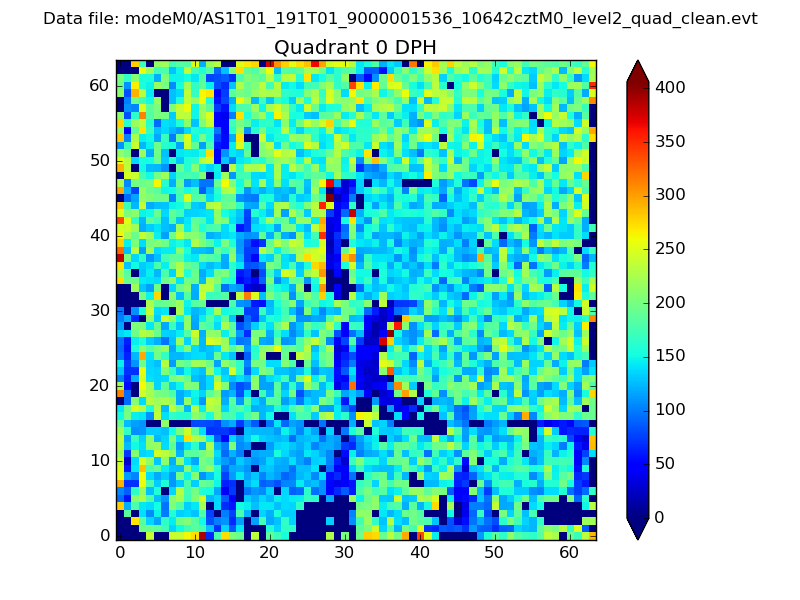 |
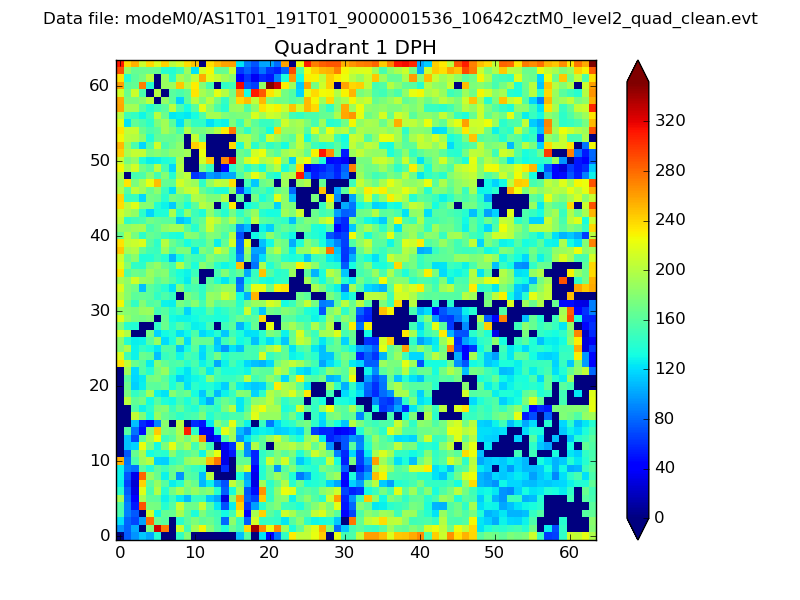 |
Quadrant B |
|---|---|---|---|
| Quadrant D | 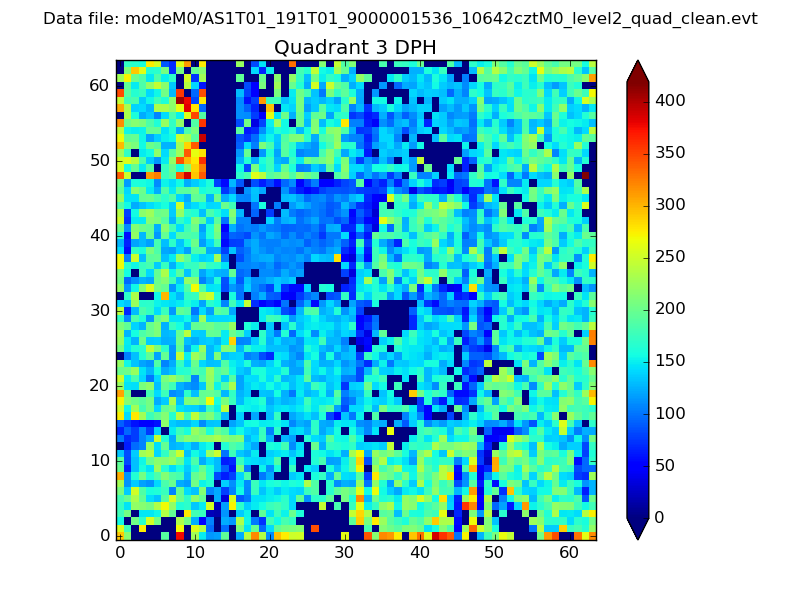 |
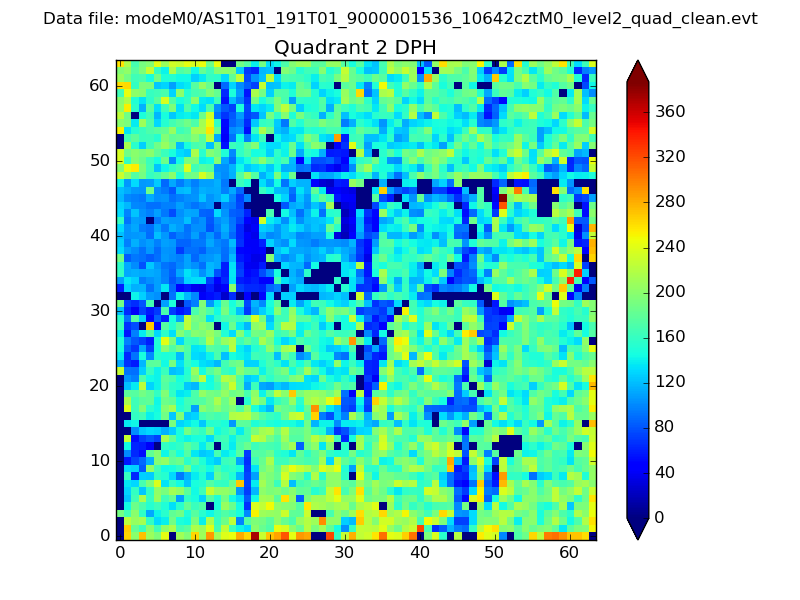 |
Quadrant C |
| Plot type | Count rate plots | Images |
|---|---|---|
| Comparison with Poisson distribution Blue bars denote a histogram of data divided into 1 sec bins. Red curve is a Poisson curve with rate = median count rate of data. |
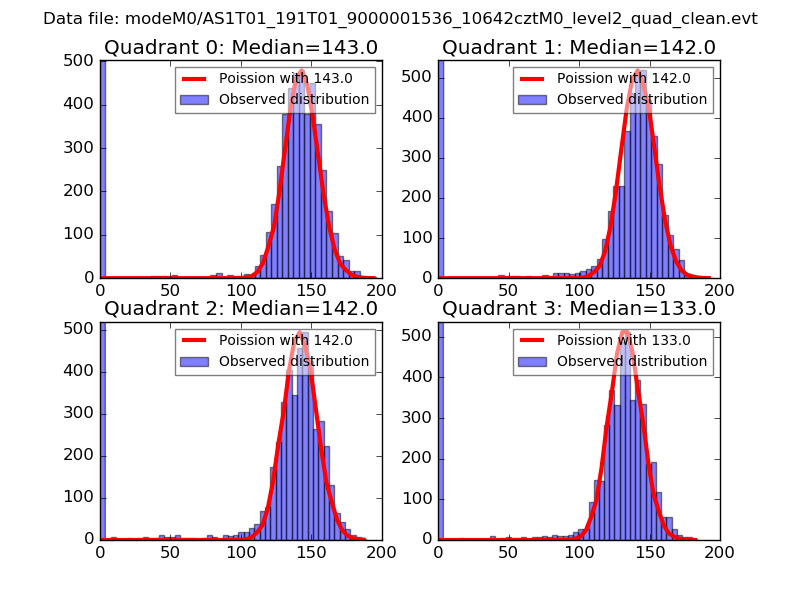 |
 |
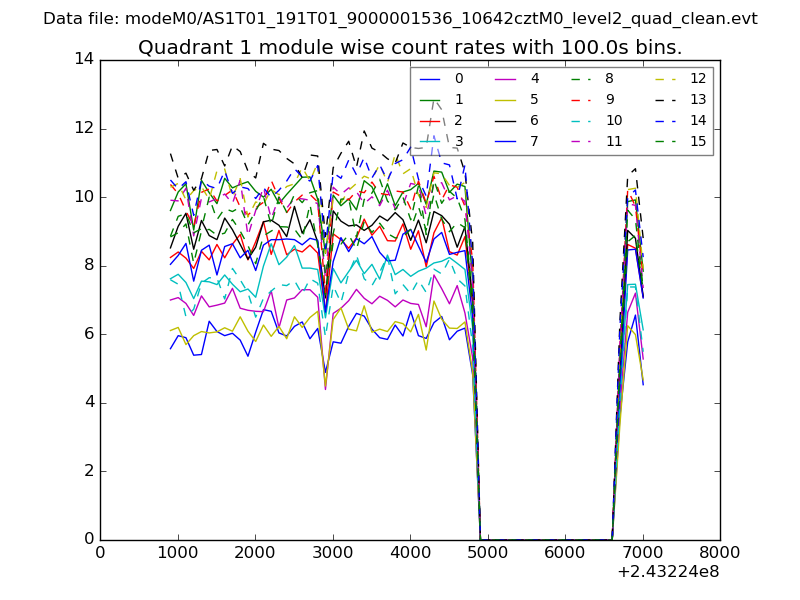
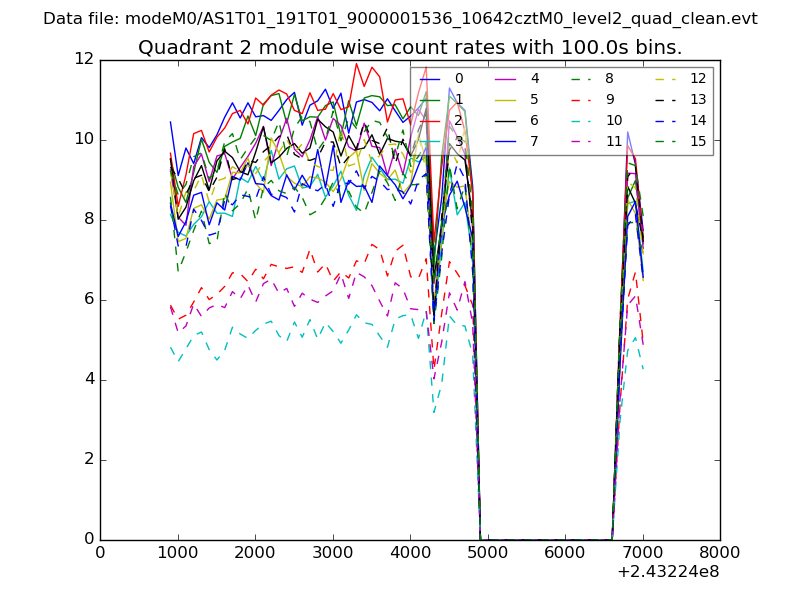
| Quadrant-wise count rates Data is divided into 100 sec bins |
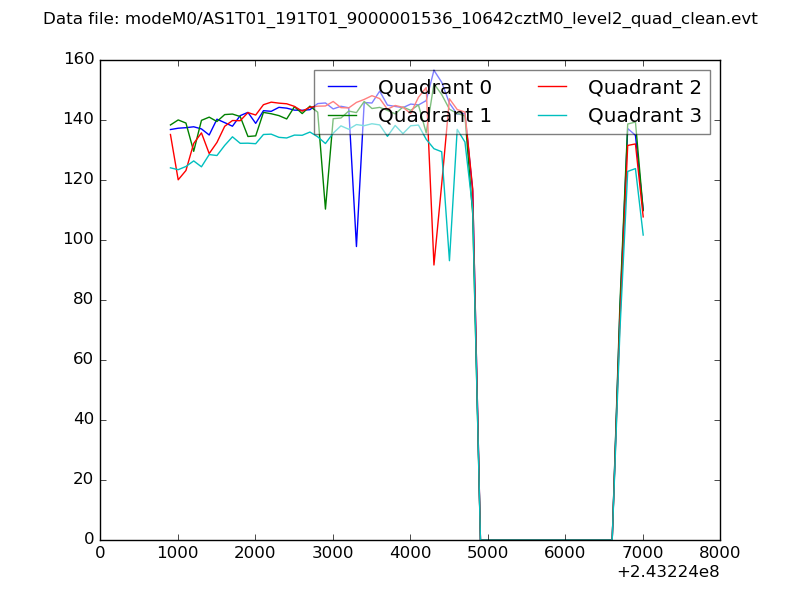 |
|
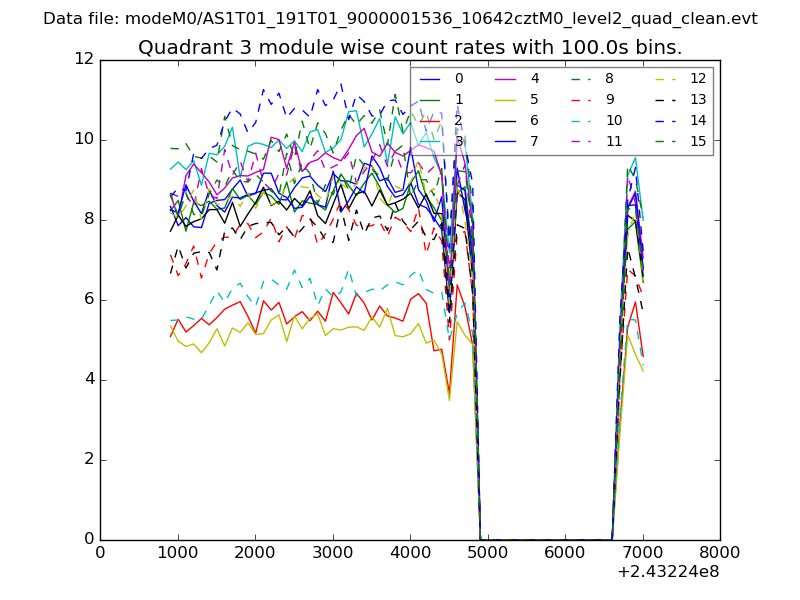
| Module-wise count rates for Quadrant A Data is divided into 100 sec bins |
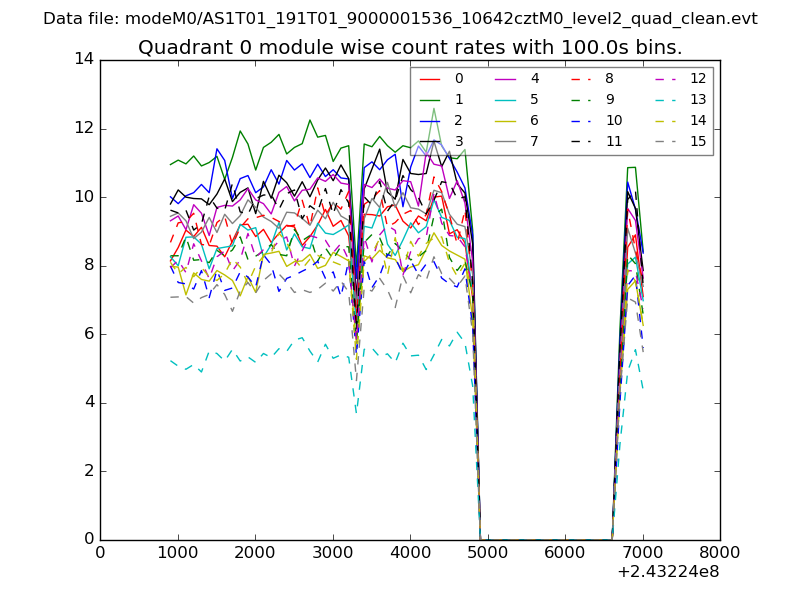 |
 |
| Module-wise count rates for Quadrant B Data is divided into 100 sec bins |
 |
 |
| Module-wise count rates for Quadrant C Data is divided into 100 sec bins |
 |
 |
| Module-wise count rates for Quadrant D Data is divided into 100 sec bins |
 |
 |
| Parameter | Plot |
|---|---|
| CZT HV Monitor | 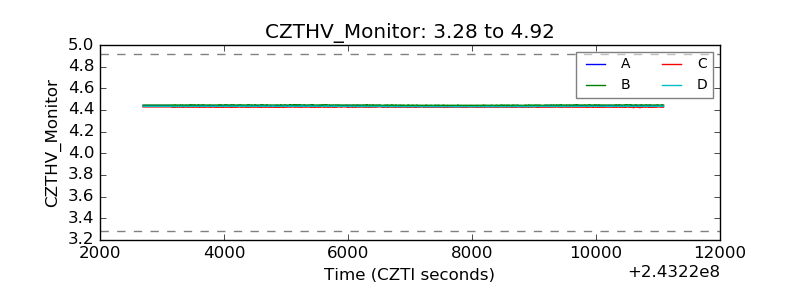 |
| D_VDD | 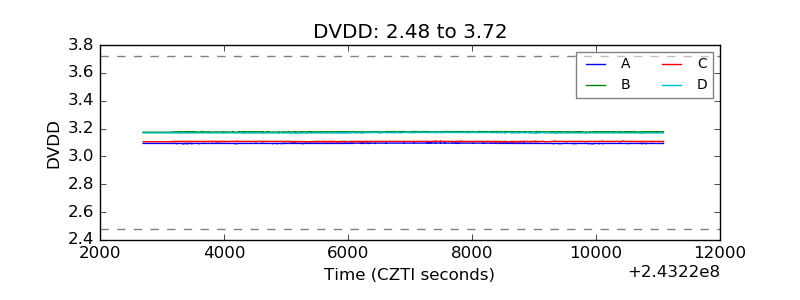 |
| Temperature 1 | 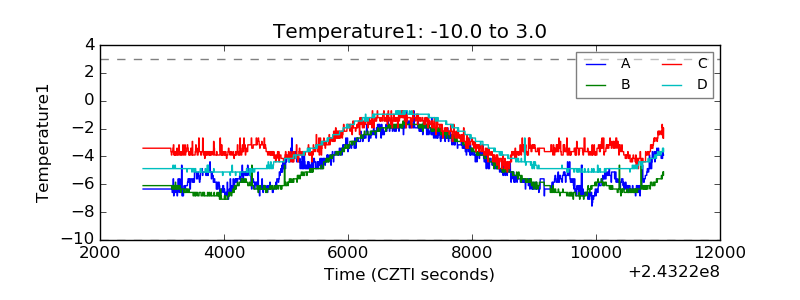 |
| Veto HV Monitor | 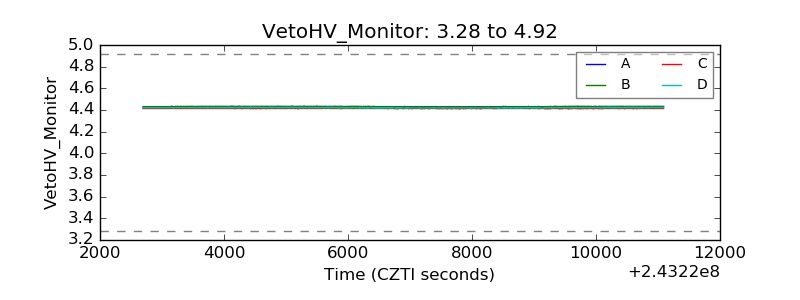 |
| Veto LLD | 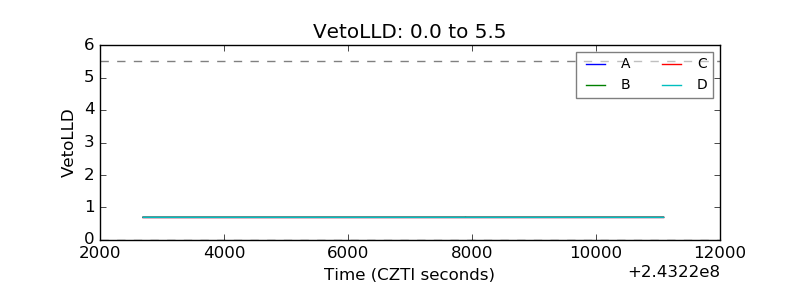 |
| Alpha Counter | 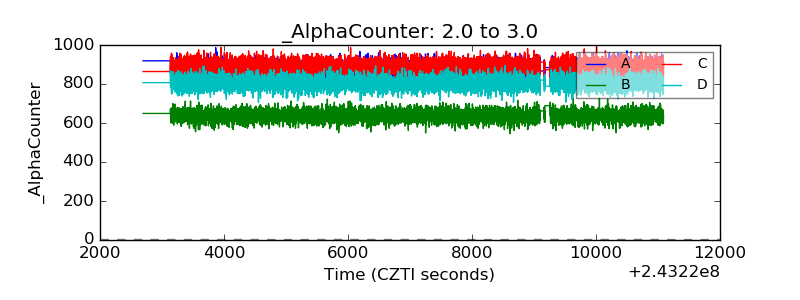 |
| _CPM_Rate | 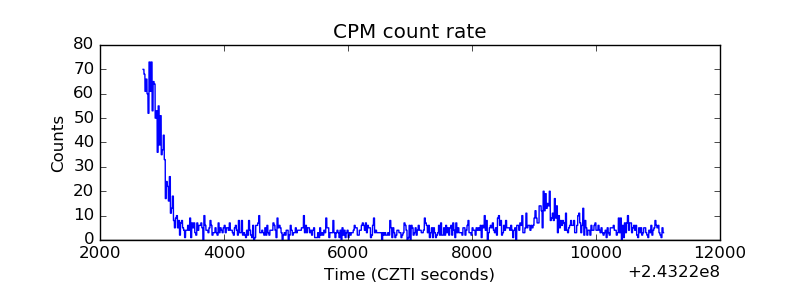 |
| CZT Counter | 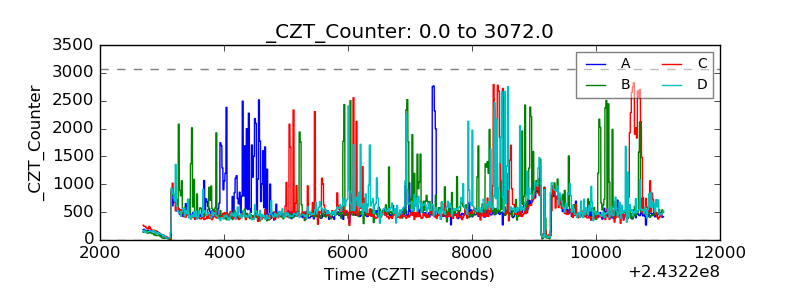 |
| +2.5 Volts monitor |  |
| +5 Volts monitor |  |
| _ROLL_ROT | 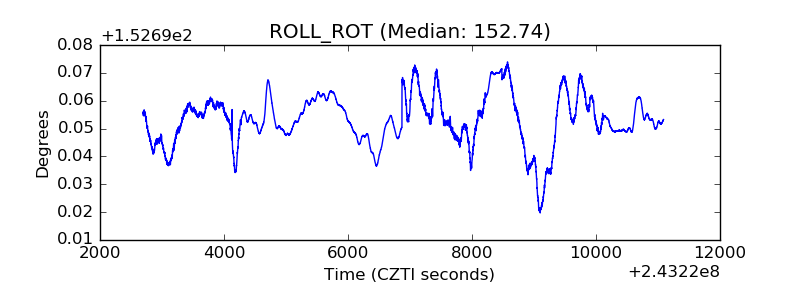 |
| _Roll_DEC | 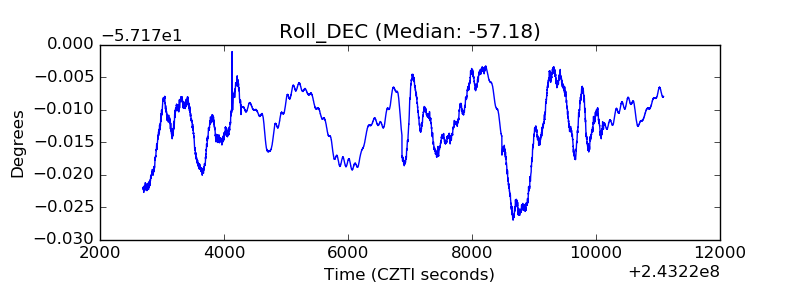 |
| _Roll_RA | 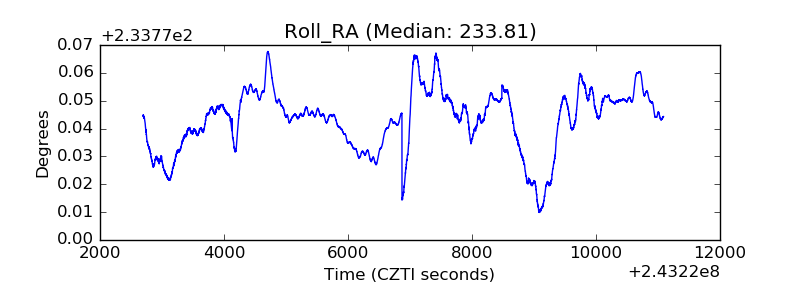 |
| Veto Counter | 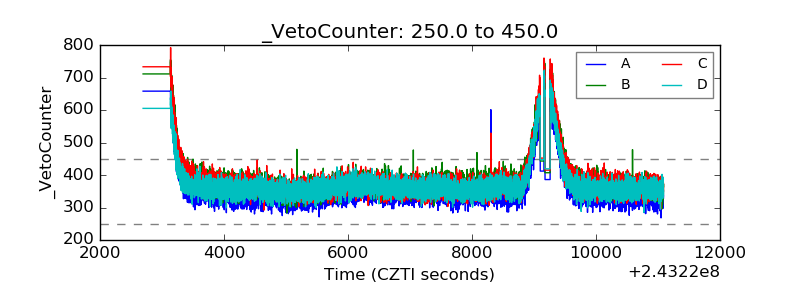 |