| Param | Original file | Final file |
|---|---|---|
| Filename | modeM0/AS1T01_191T01_9000001536_10643cztM0_level2.evt | modeM0/AS1T01_191T01_9000001536_10643cztM0_level2_quad_clean.evt |
| Size (bytes) | 599,270,400 | 99,521,280 |
| Size | 571.5 MB | 94.9 MB |
| Events in quadrant A | 3,530,477 | 646,675 |
| Events in quadrant B | 4,614,678 | 645,244 |
| Events in quadrant C | 5,217,034 | 616,234 |
| Events in quadrant D | 4,301,454 | 607,163 |
| Mode SS | |||
|---|---|---|---|
| Quadrant | BADHDUFLAG | Total packets | Discarded packets |
| A | 0 | 144 | 0 |
| B | 0 | 144 | 0 |
| C | 0 | 144 | 0 |
| D | 0 | 144 | 0 |
| Mode M0 | |||
|---|---|---|---|
| Quadrant | BADHDUFLAG | Total packets | Discarded packets |
| A | 0 | 15011 | 1 |
| B | 0 | 18277 | 0 |
| C | 0 | 20335 | 0 |
| D | 0 | 17344 | 0 |
| Quadrant | Total seconds | Saturated seconds | Saturation percentage |
|---|---|---|---|
| A | 7154 | 107 | 1.495667% |
| B | 7154 | 437 | 6.108471% |
| C | 7154 | 788 | 11.014817% |
| D | 7154 | 132 | 1.845122% |
Noise dominated data is calculated using 1-second bins in cleaned event files. If a bin has >2000 counts, and if more than 50% of those come from <1% of pixels, then it is considered to be noise-dominated and hence unusable.
| Quadrant | # 1 sec bins | Bins with >0 counts | Bins with >2000 counts | High rate bins dominated by noise | Noise dominated (total time) | Noise dominated (detector-on time) | Marked lightcurve |
|---|---|---|---|---|---|---|---|
| A | 7154 | 7154 | 3 | 3 | 0.04% | 0.04% | 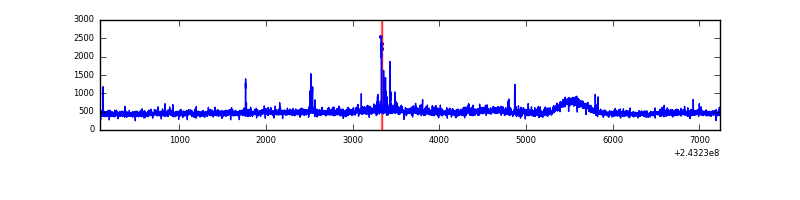 |
| B | 7154 | 7154 | 151 | 151 | 2.11% | 2.11% | 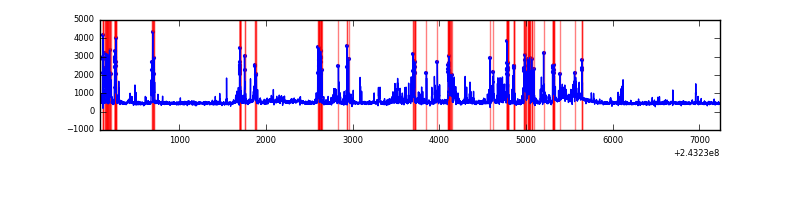 |
| C | 7154 | 7154 | 591 | 591 | 8.26% | 8.26% | 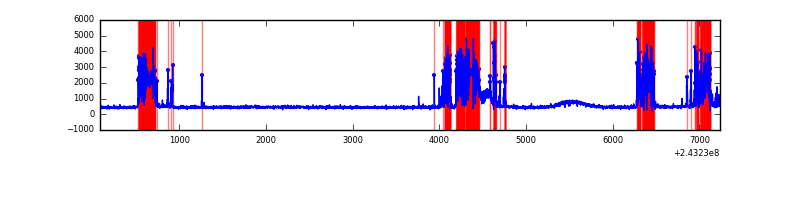 |
| D | 7154 | 7154 | 68 | 68 | 0.95% | 0.95% | 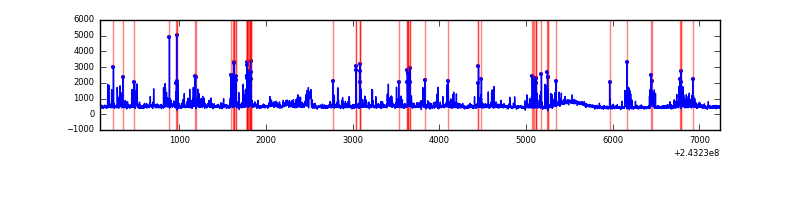 |
Top three noisy pixels from each quadrant. If the there are fewer than three noisy pixels in the level2.evt file, extra rows are filled as -1
| Pixel properties | Quadrant properties | ||||||
|---|---|---|---|---|---|---|---|
| Quadrant | DetID | PixID | Counts | Sigma | Mean | Median | Sigma |
| A | 13 | 251 | 93697 | 518.68 | 861 | 844 | 179.0 |
| A | 15 | 239 | 56369 | 310.16 | 861 | 844 | 179.0 |
| A | 1 | 162 | 24736 | 133.46 | 861 | 844 | 179.0 |
| B | 4 | 239 | 1064559 | 6473.41 | 852 | 833 | 164.3 |
| B | 0 | 168 | 76961 | 463.28 | 852 | 833 | 164.3 |
| B | 0 | 219 | 73545 | 442.5 | 852 | 833 | 164.3 |
| C | 4 | 254 | 2041479 | 11007.15 | 794 | 799 | 185.4 |
| C | 14 | 234 | 65901 | 351.15 | 794 | 799 | 185.4 |
| C | 4 | 175 | 10464 | 52.13 | 794 | 799 | 185.4 |
| D | 12 | 233 | 559787 | 2752.07 | 828 | 804 | 203.1 |
| D | 8 | 195 | 199390 | 977.71 | 828 | 804 | 203.1 |
| D | 5 | 222 | 134536 | 658.41 | 828 | 804 | 203.1 |
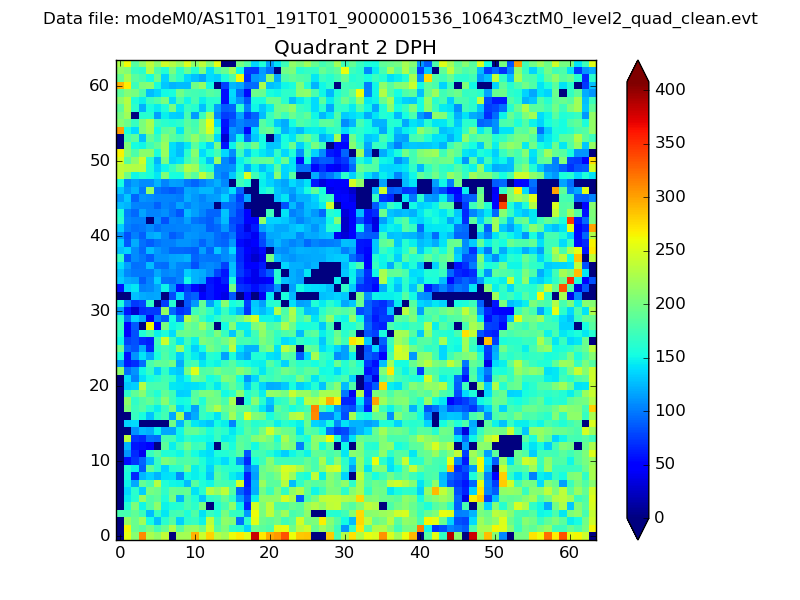
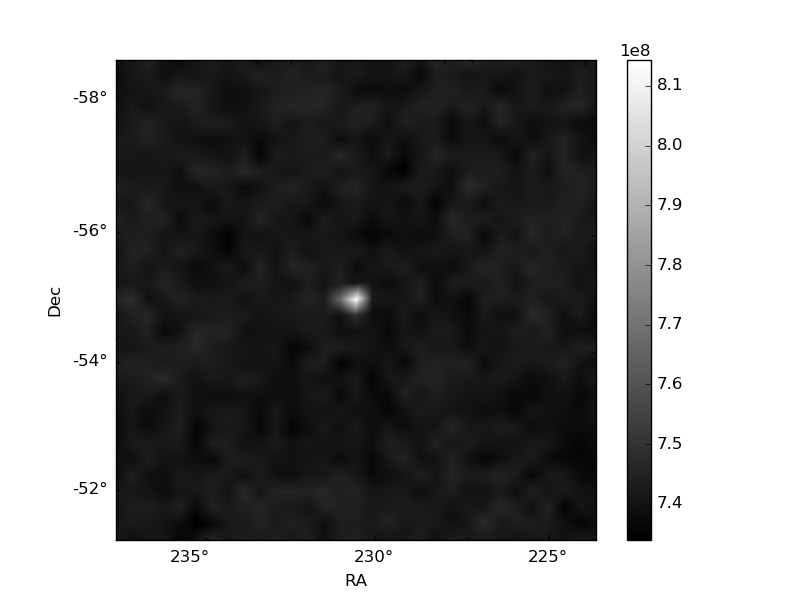
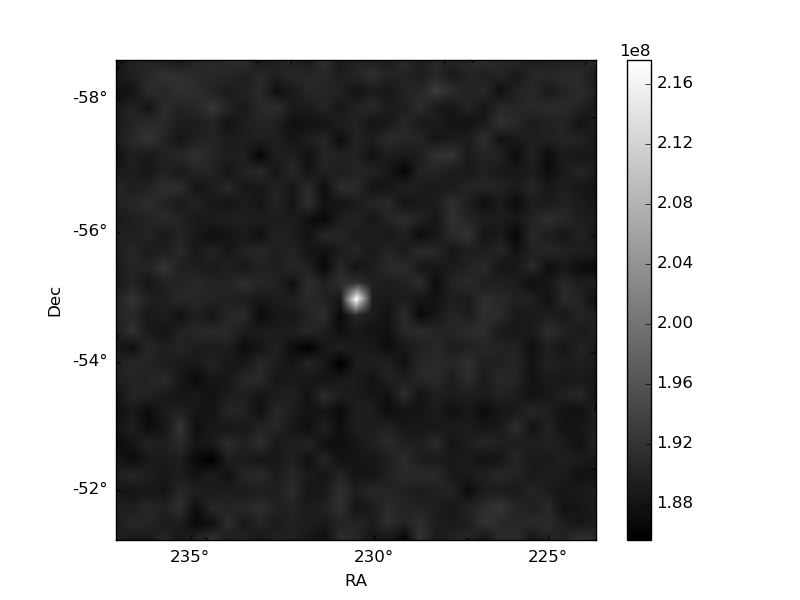
Histogram calculated using DETX and DETY for each event in the final _common_clean file
| Quadrant A | 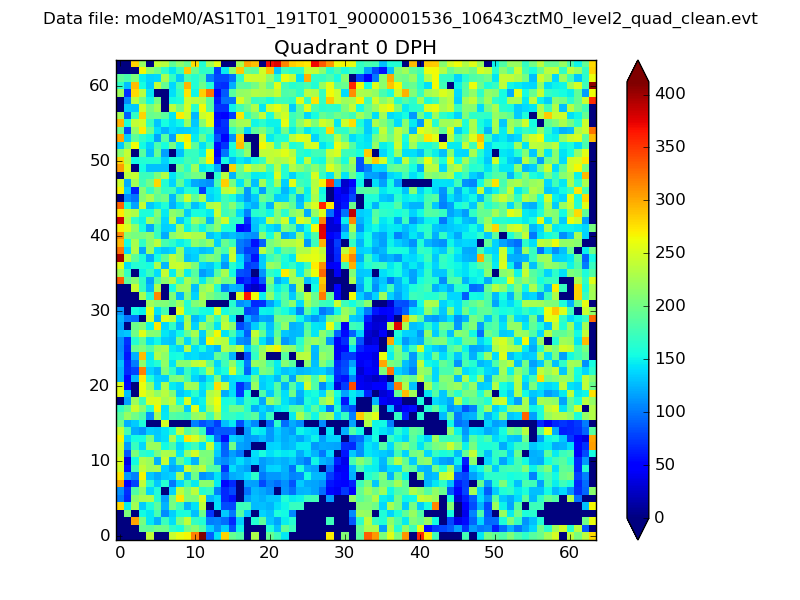 |
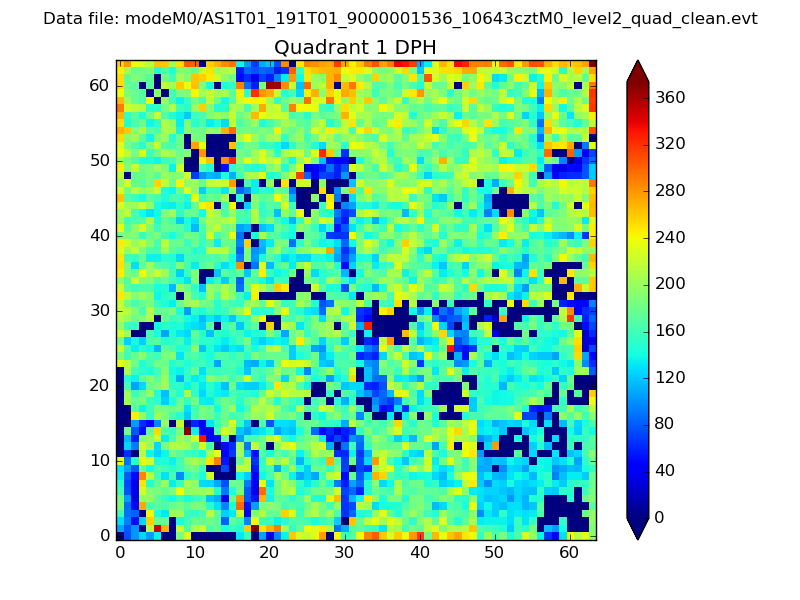 |
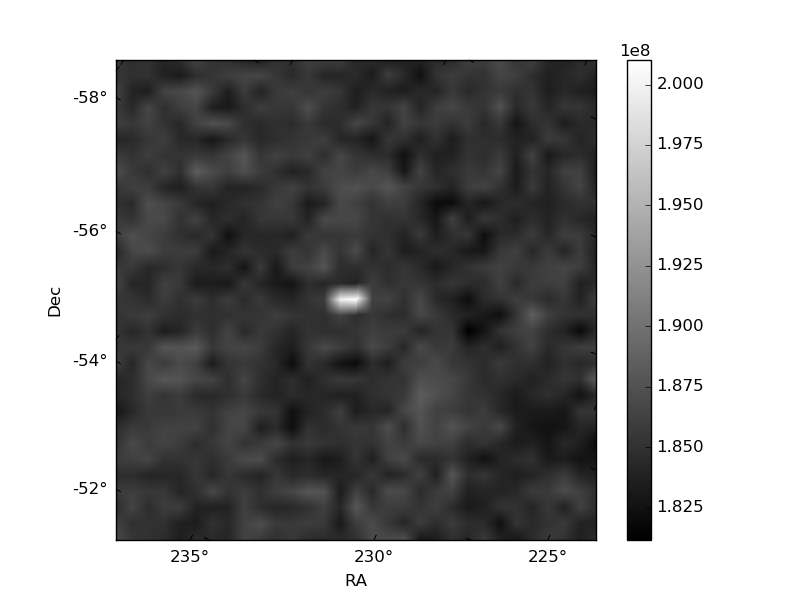
Quadrant B |
|---|---|---|---|
| Quadrant D | 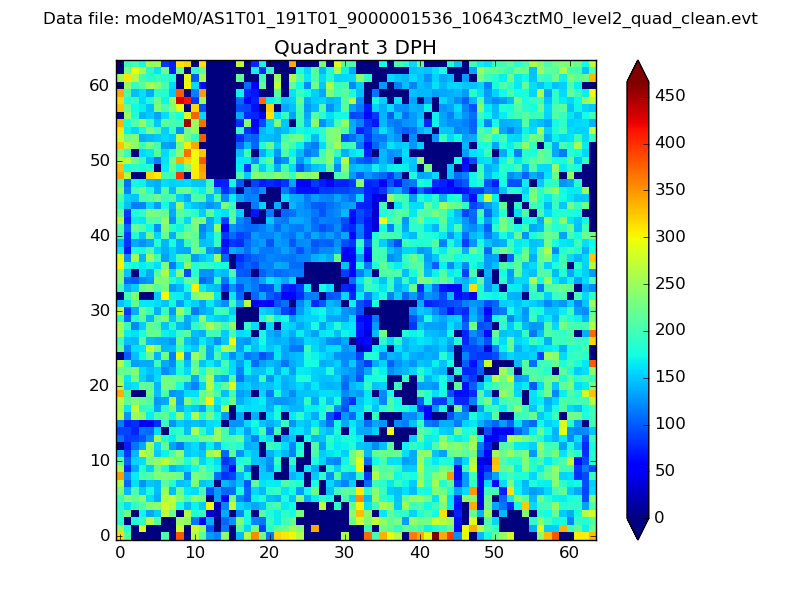 |
 |
Quadrant C |
| Plot type | Count rate plots | Images |
|---|---|---|
| Comparison with Poisson distribution Blue bars denote a histogram of data divided into 1 sec bins. Red curve is a Poisson curve with rate = median count rate of data. |
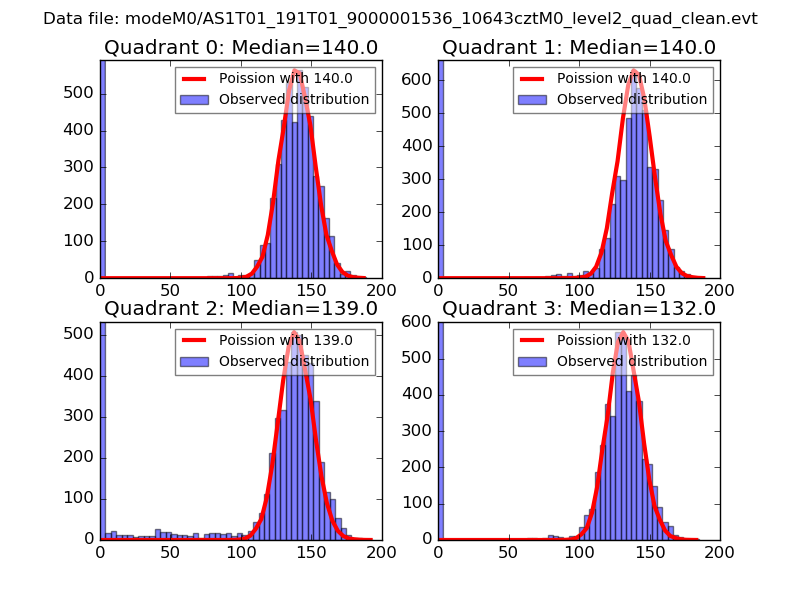 |
 |
| Quadrant-wise count rates Data is divided into 100 sec bins |
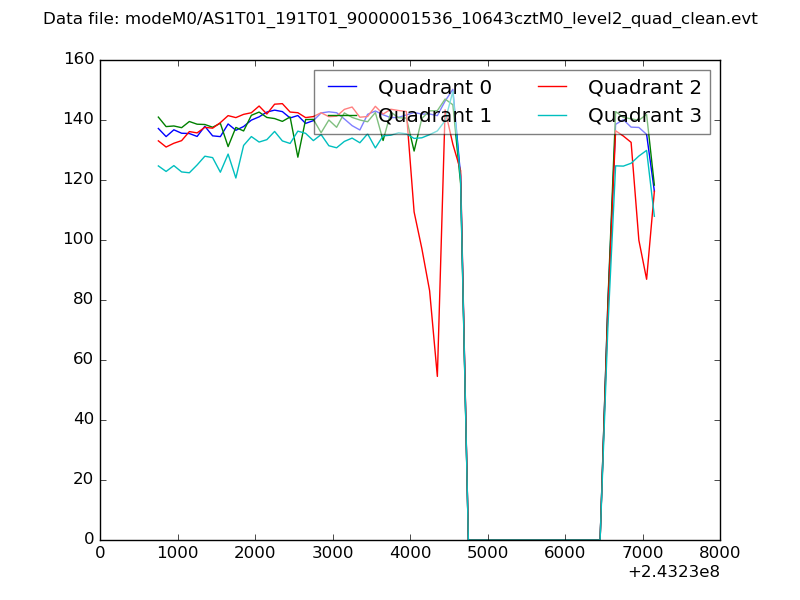 |
|
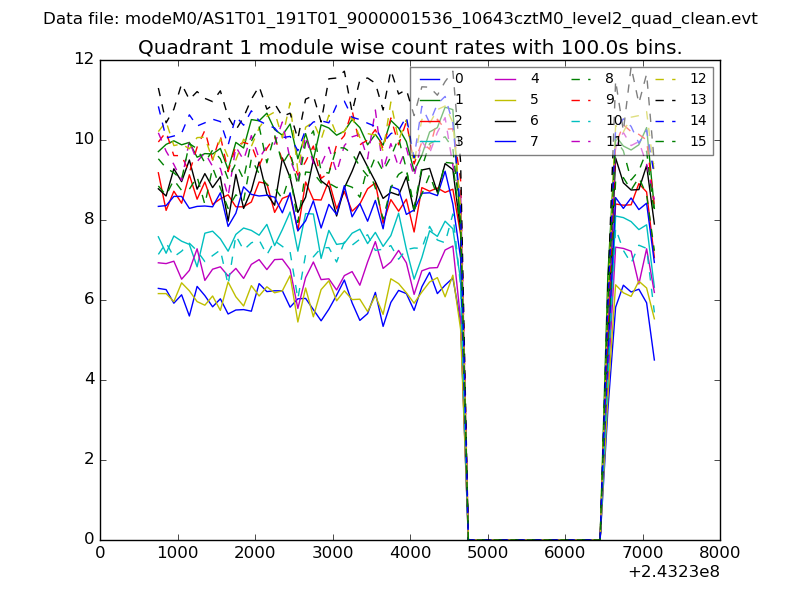
| Module-wise count rates for Quadrant A Data is divided into 100 sec bins |
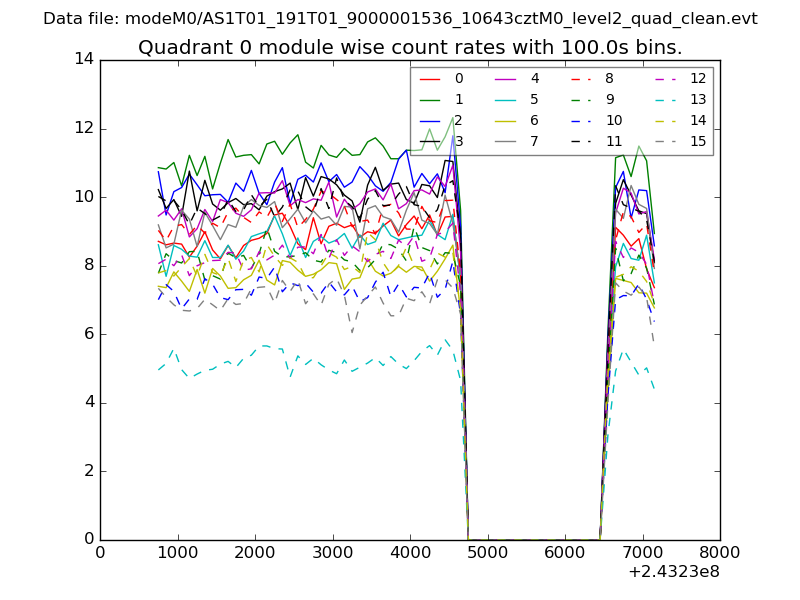 |
 |
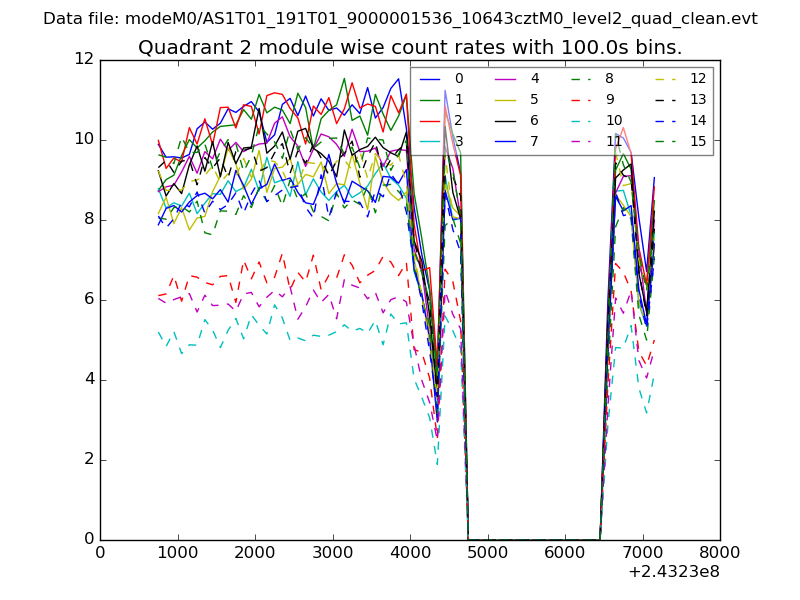
| Module-wise count rates for Quadrant B Data is divided into 100 sec bins |
 |
 |
| Module-wise count rates for Quadrant C Data is divided into 100 sec bins |
 |
 |
| Module-wise count rates for Quadrant D Data is divided into 100 sec bins |
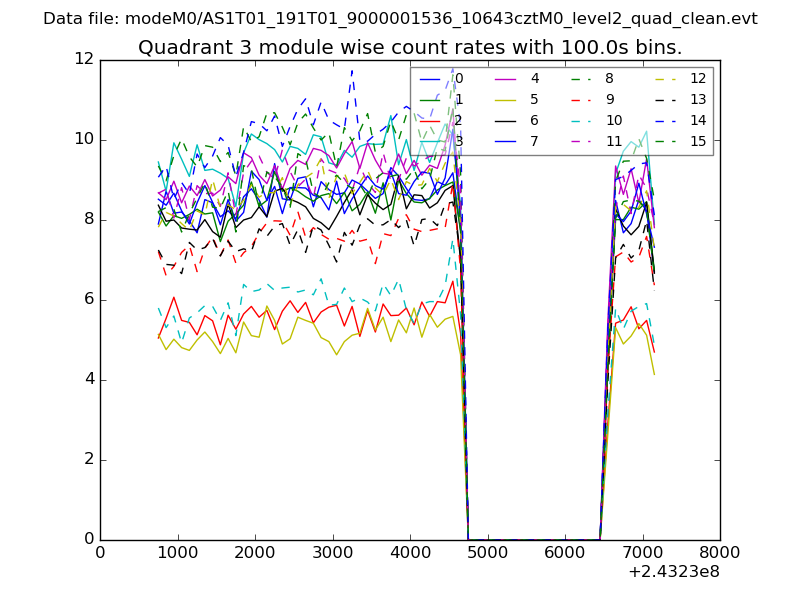 |
 |
| Parameter | Plot |
|---|---|
| CZT HV Monitor | 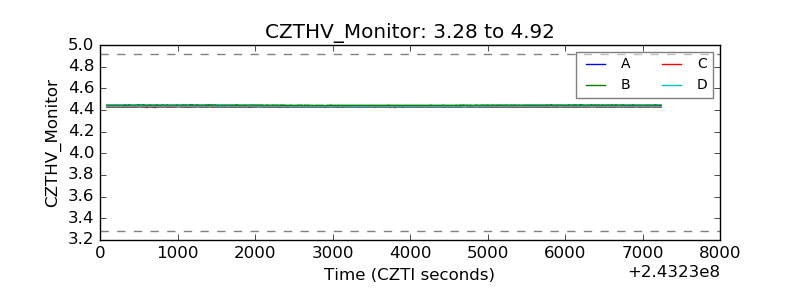 |
| D_VDD | 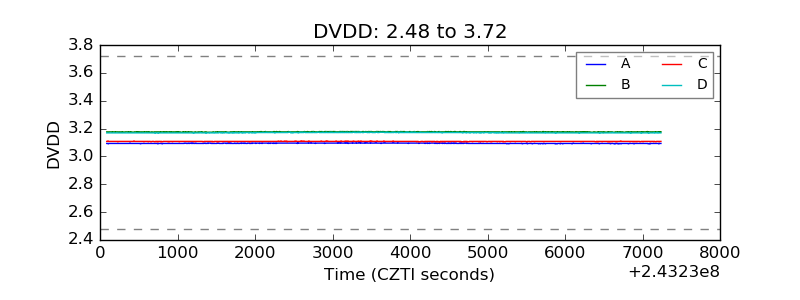 |
| Temperature 1 | 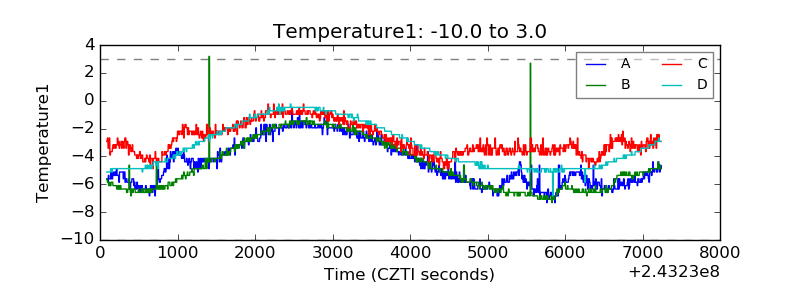 |
| Veto HV Monitor | 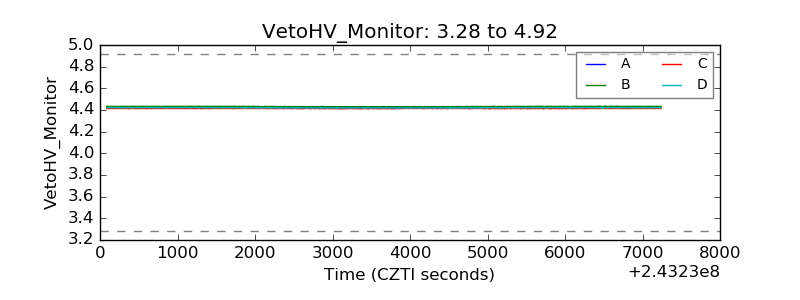 |
| Veto LLD | 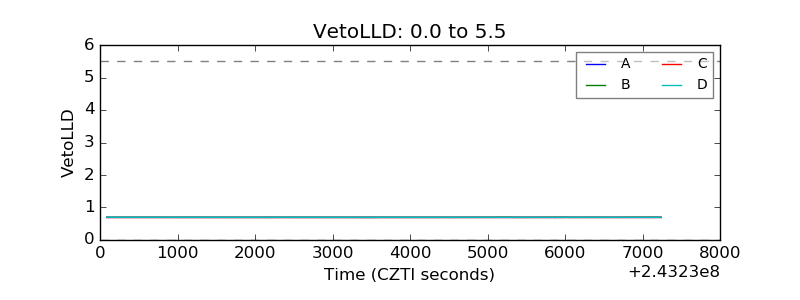 |
| Alpha Counter | 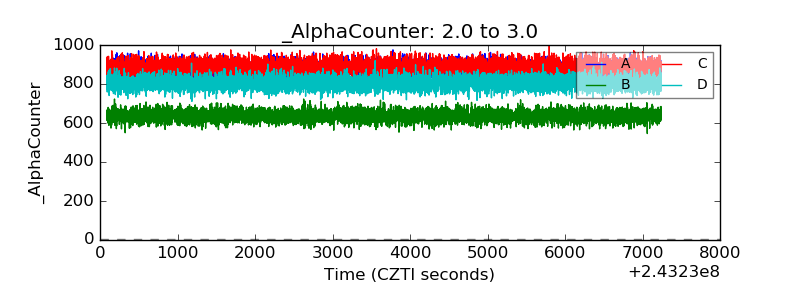 |
| _CPM_Rate | 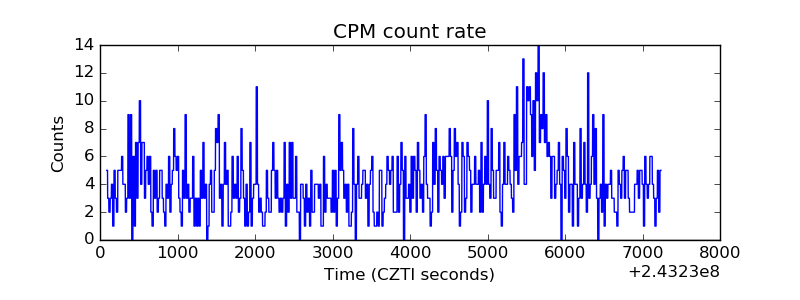 |
| CZT Counter | 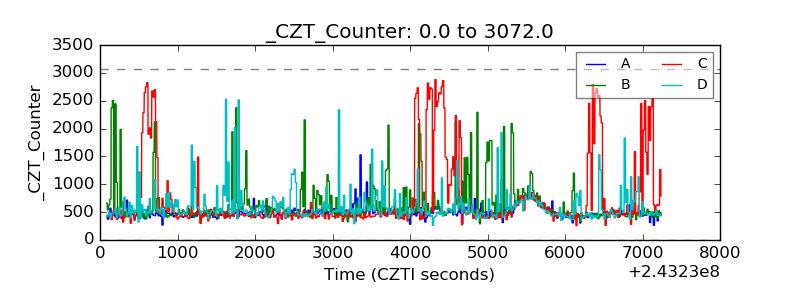 |
| +2.5 Volts monitor | 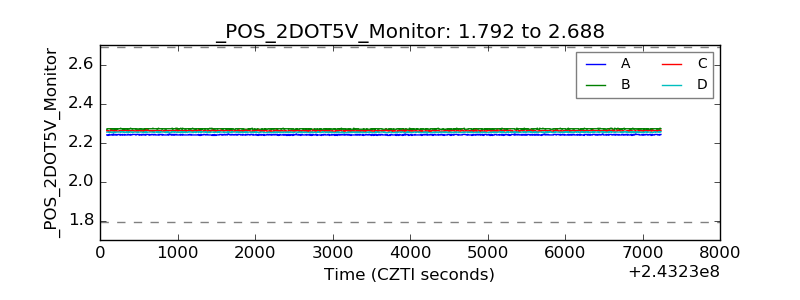 |
| +5 Volts monitor |  |
| _ROLL_ROT | 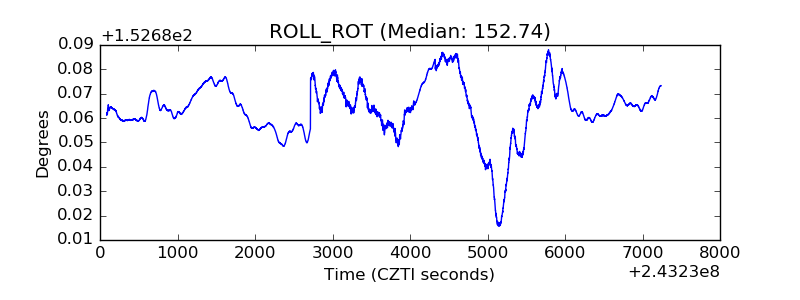 |
| _Roll_DEC |  |
| _Roll_RA | 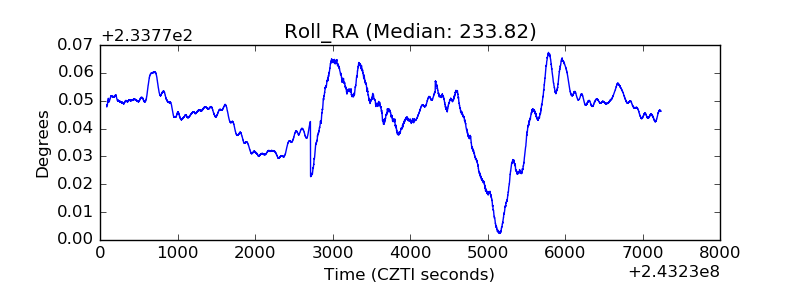 |
| Veto Counter | 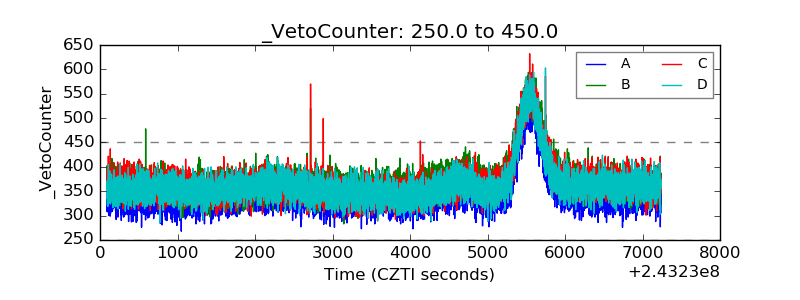 |