| Param | Original file | Final file |
|---|---|---|
| Filename | modeM0/AS1T01_191T01_9000001536_10644cztM0_level2.evt | modeM0/AS1T01_191T01_9000001536_10644cztM0_level2_quad_clean.evt |
| Size (bytes) | 491,935,680 | 104,014,080 |
| Size | 469.1 MB | 99.2 MB |
| Events in quadrant A | 3,220,399 | 685,268 |
| Events in quadrant B | 4,020,485 | 682,231 |
| Events in quadrant C | 3,717,344 | 674,530 |
| Events in quadrant D | 3,493,652 | 649,877 |
| Mode SS | |||
|---|---|---|---|
| Quadrant | BADHDUFLAG | Total packets | Discarded packets |
| A | 0 | 136 | 0 |
| B | 0 | 136 | 0 |
| C | 0 | 136 | 0 |
| D | 0 | 136 | 0 |
| Mode M9 | |||
|---|---|---|---|
| Quadrant | BADHDUFLAG | Total packets | Discarded packets |
| A | 0 | 3 | 0 |
| B | 0 | 3 | 0 |
| C | 0 | 3 | 0 |
| D | 0 | 3 | 0 |
| Mode M0 | |||
|---|---|---|---|
| Quadrant | BADHDUFLAG | Total packets | Discarded packets |
| A | 0 | 13667 | 2 |
| B | 0 | 16054 | 1 |
| C | 0 | 15288 | 1 |
| D | 0 | 14560 | 1 |
| Quadrant | Total seconds | Saturated seconds | Saturation percentage |
|---|---|---|---|
| A | 6566 | 138 | 2.101736% |
| B | 6566 | 320 | 4.873591% |
| C | 6566 | 308 | 4.690832% |
| D | 6566 | 130 | 1.979896% |
Noise dominated data is calculated using 1-second bins in cleaned event files. If a bin has >2000 counts, and if more than 50% of those come from <1% of pixels, then it is considered to be noise-dominated and hence unusable.
| Quadrant | # 1 sec bins | Bins with >0 counts | Bins with >2000 counts | High rate bins dominated by noise | Noise dominated (total time) | Noise dominated (detector-on time) | Marked lightcurve |
|---|---|---|---|---|---|---|---|
| A | 6826 | 6568 | 17 | 17 | 0.25% | 0.26% | 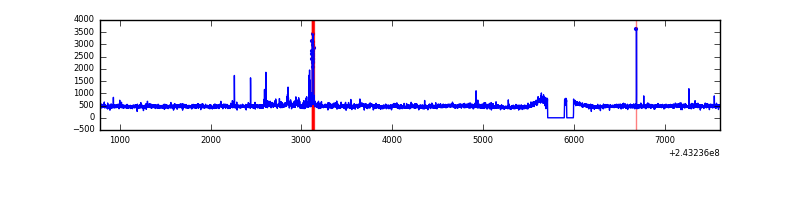 |
| B | 6826 | 6568 | 112 | 112 | 1.64% | 1.71% | 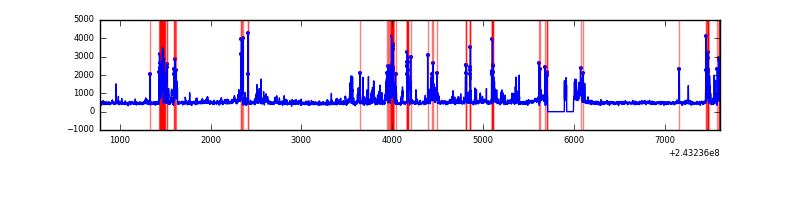 |
| C | 6826 | 6568 | 151 | 151 | 2.21% | 2.30% | 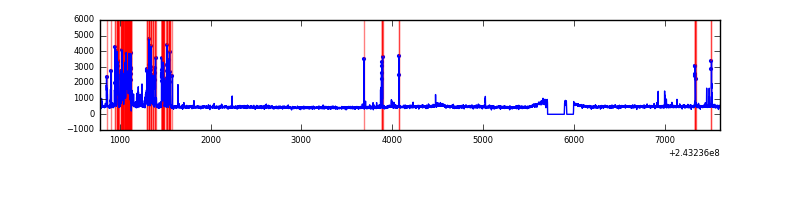 |
| D | 6826 | 6568 | 22 | 22 | 0.32% | 0.33% | 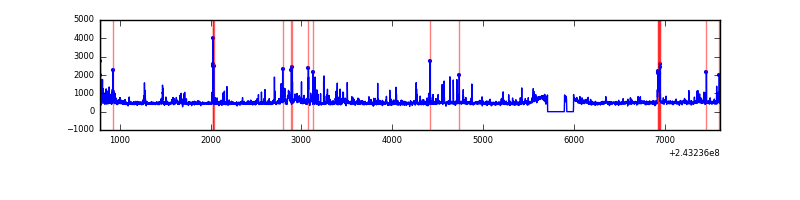 |
Top three noisy pixels from each quadrant. If the there are fewer than three noisy pixels in the level2.evt file, extra rows are filled as -1
| Pixel properties | Quadrant properties | ||||||
|---|---|---|---|---|---|---|---|
| Quadrant | DetID | PixID | Counts | Sigma | Mean | Median | Sigma |
| A | 13 | 251 | 82949 | 498.1 | 786 | 770 | 165.0 |
| A | 15 | 239 | 68482 | 410.41 | 786 | 770 | 165.0 |
| A | 1 | 162 | 12948 | 73.81 | 786 | 770 | 165.0 |
| B | 4 | 239 | 858603 | 5676.29 | 777 | 762 | 151.1 |
| B | 0 | 214 | 54088 | 352.86 | 777 | 762 | 151.1 |
| B | 0 | 219 | 33870 | 219.07 | 777 | 762 | 151.1 |
| C | 4 | 254 | 623839 | 3516.68 | 757 | 766 | 177.2 |
| C | 14 | 234 | 113764 | 637.77 | 757 | 766 | 177.2 |
| C | 4 | 175 | 21849 | 118.99 | 757 | 766 | 177.2 |
| D | 2 | 16 | 112999 | 601.26 | 762 | 742 | 186.7 |
| D | 12 | 233 | 107343 | 570.97 | 762 | 742 | 186.7 |
| D | 8 | 195 | 101766 | 541.1 | 762 | 742 | 186.7 |
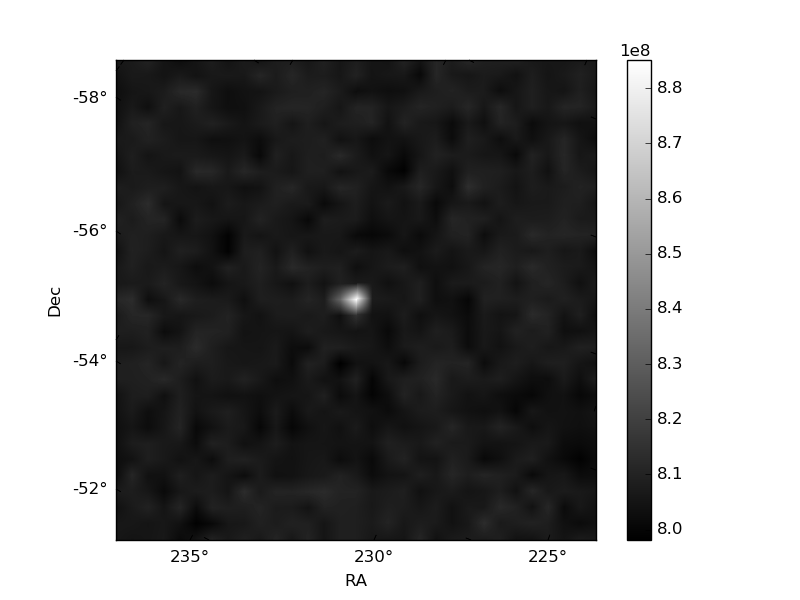
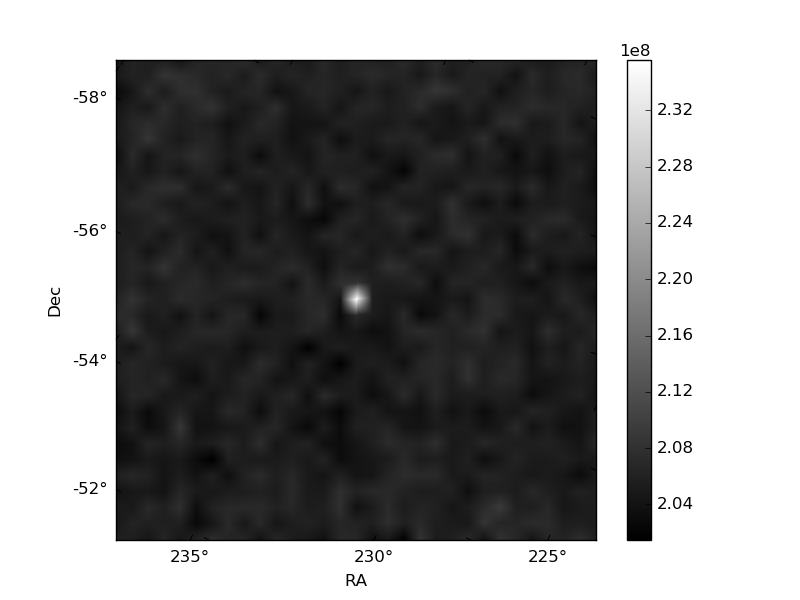
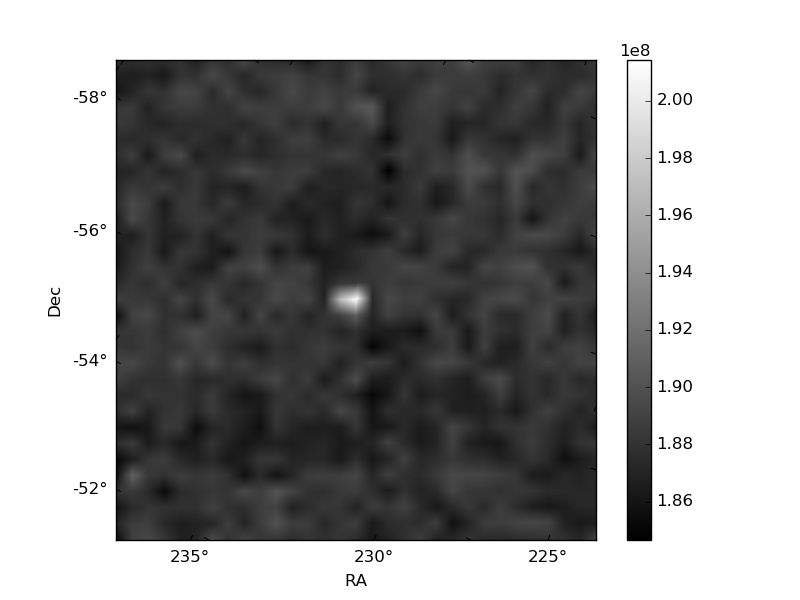
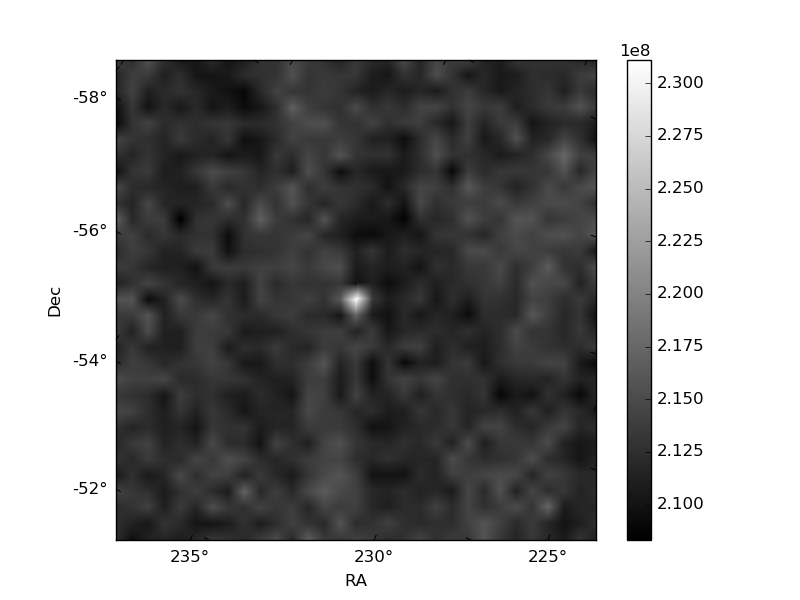
Histogram calculated using DETX and DETY for each event in the final _common_clean file
| Quadrant A | 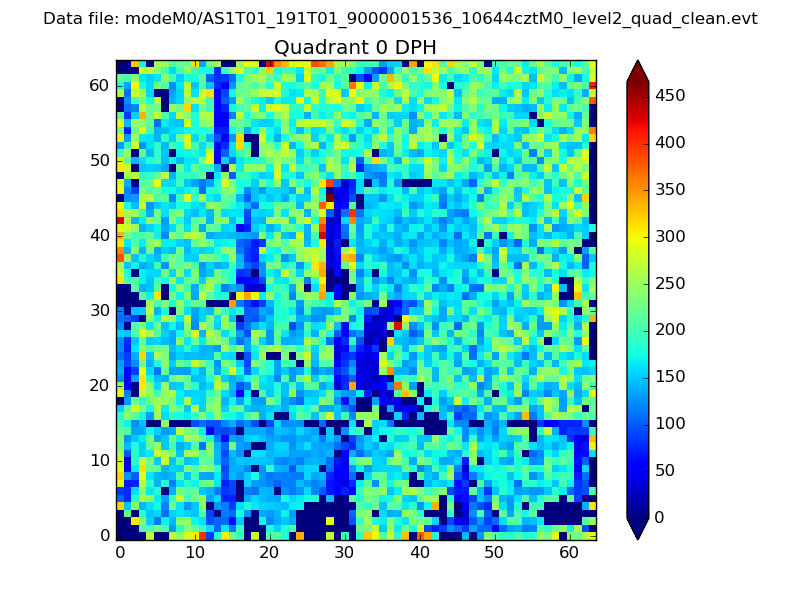 |
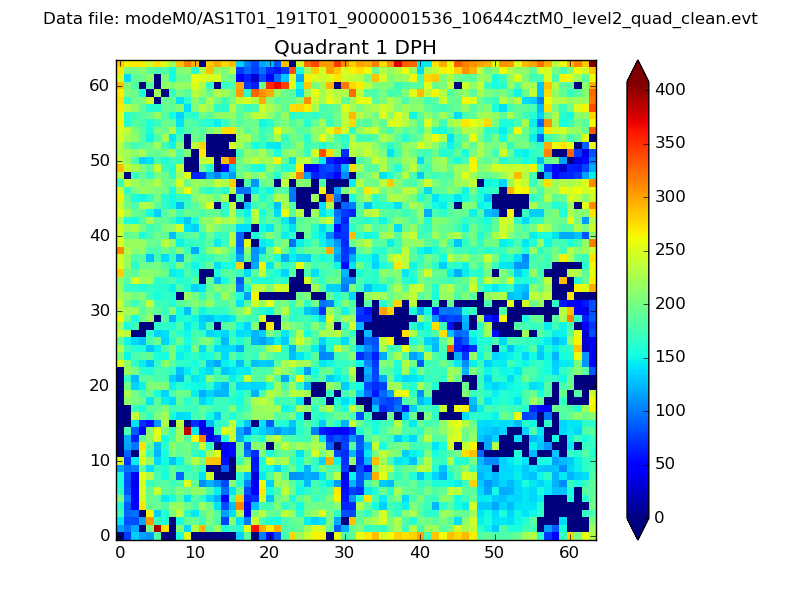 |
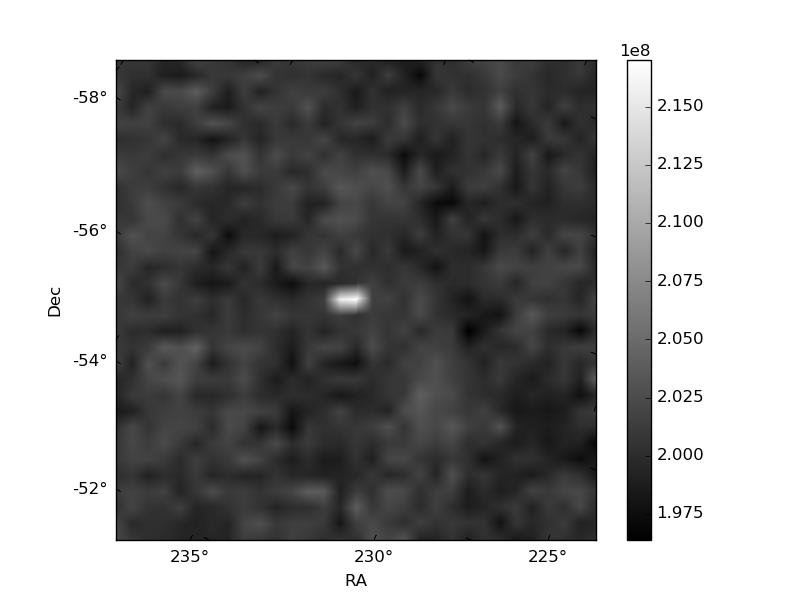
Quadrant B |
|---|---|---|---|
| Quadrant D | 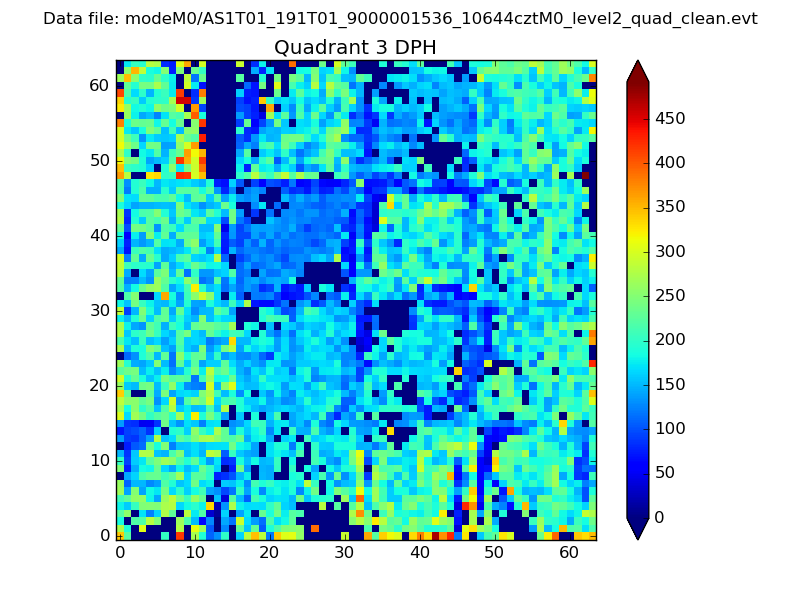 |
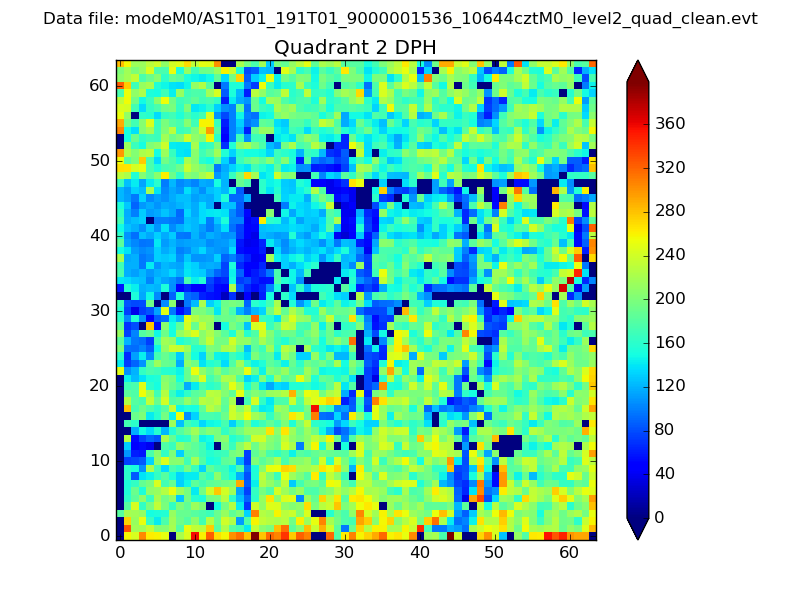 |
Quadrant C |
| Plot type | Count rate plots | Images |
|---|---|---|
| Comparison with Poisson distribution Blue bars denote a histogram of data divided into 1 sec bins. Red curve is a Poisson curve with rate = median count rate of data. |
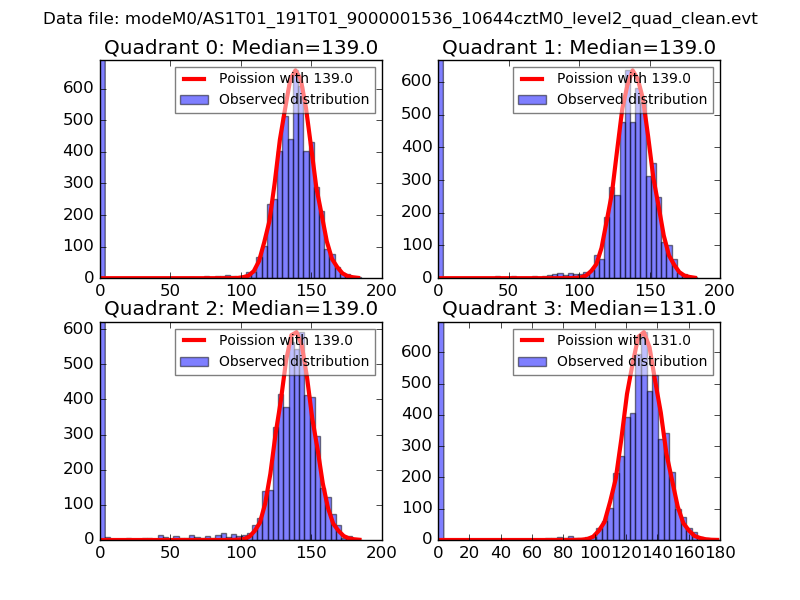 |
 |
| Quadrant-wise count rates Data is divided into 100 sec bins |
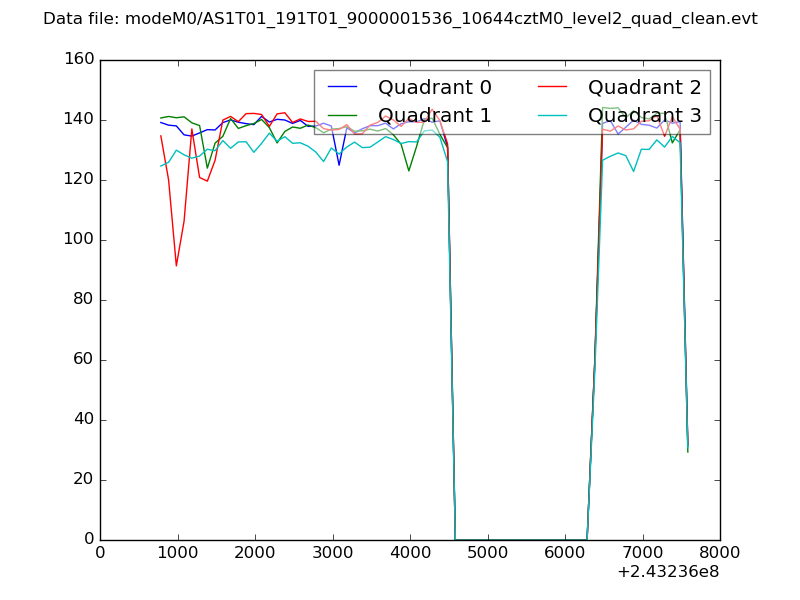 |
|
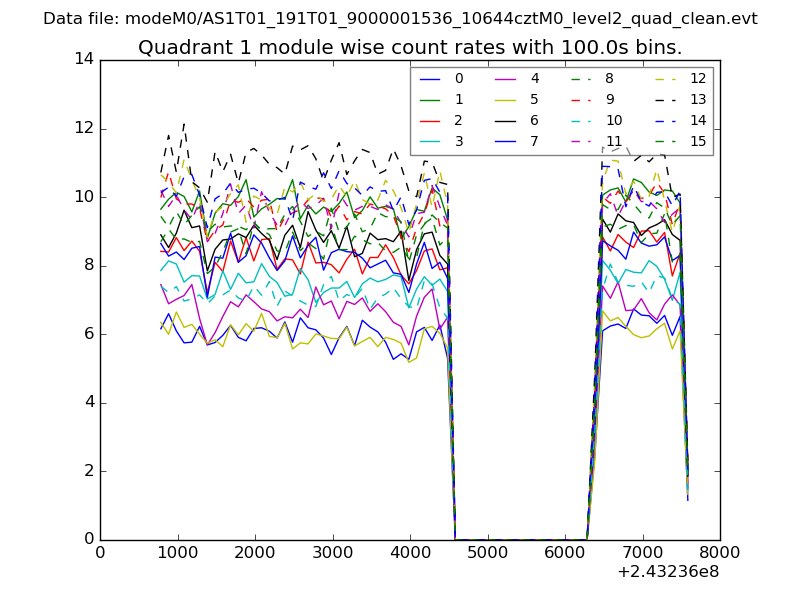
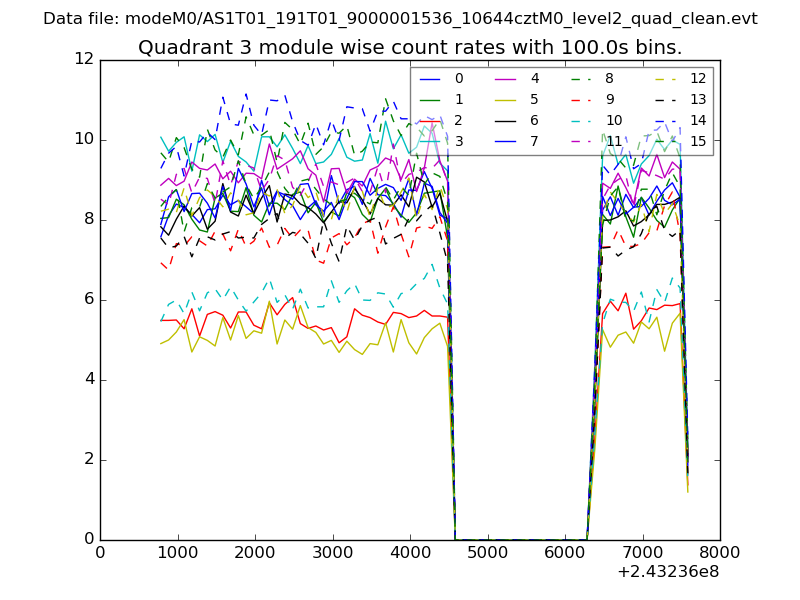
| Module-wise count rates for Quadrant A Data is divided into 100 sec bins |
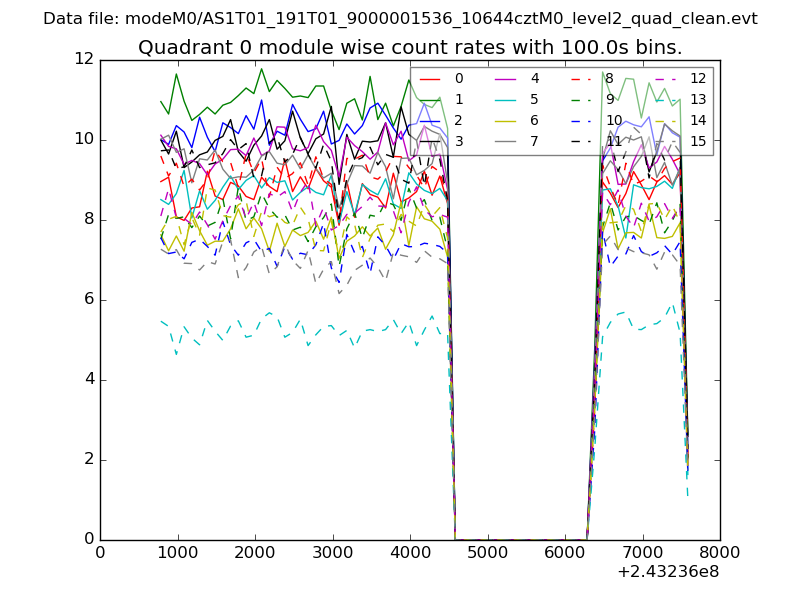 |
 |
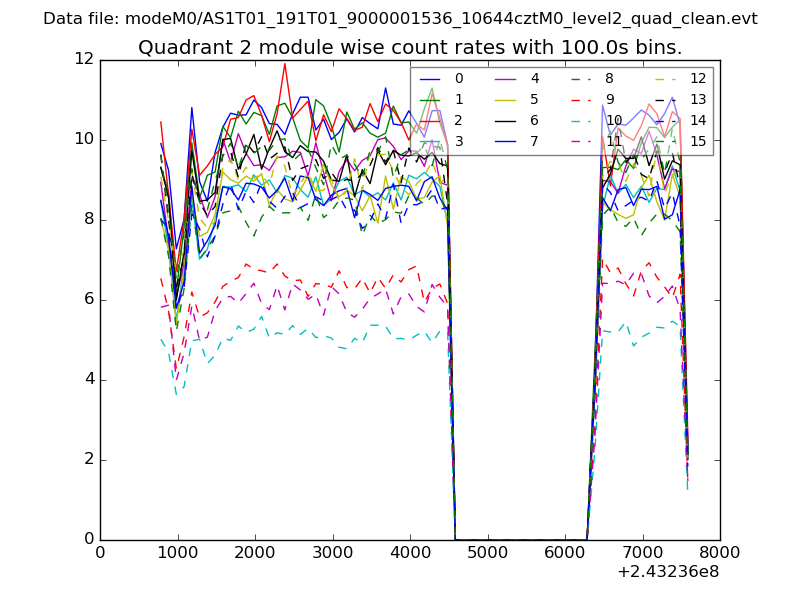
| Module-wise count rates for Quadrant B Data is divided into 100 sec bins |
 |
 |
| Module-wise count rates for Quadrant C Data is divided into 100 sec bins |
 |
 |
| Module-wise count rates for Quadrant D Data is divided into 100 sec bins |
 |
 |
| Parameter | Plot |
|---|---|
| CZT HV Monitor | 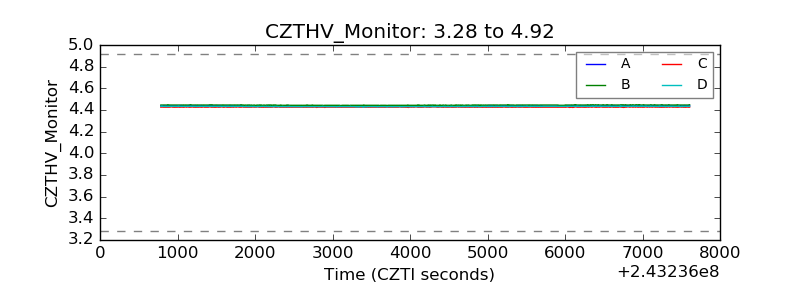 |
| D_VDD | 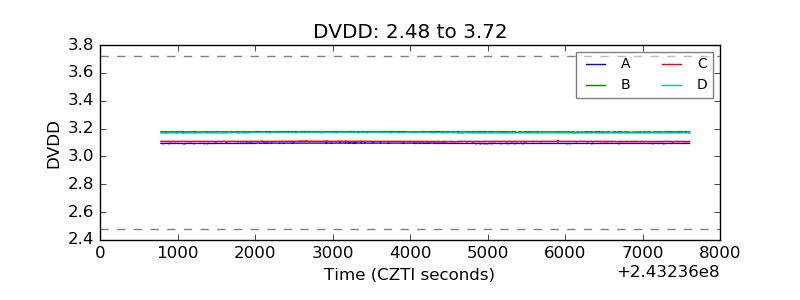 |
| Temperature 1 | 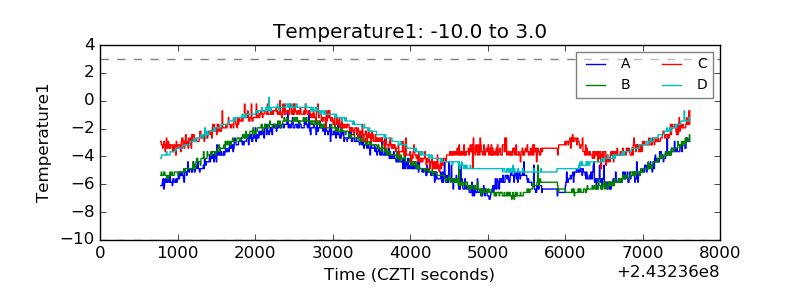 |
| Veto HV Monitor | 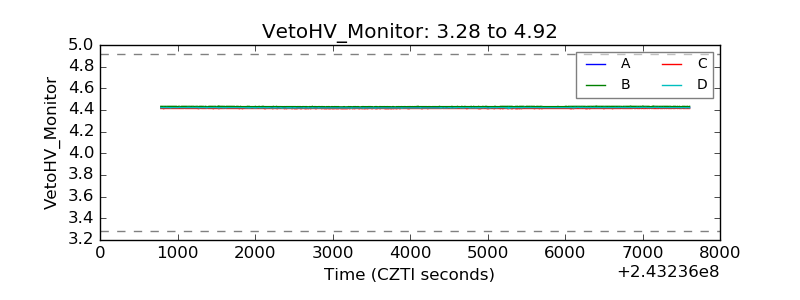 |
| Veto LLD | 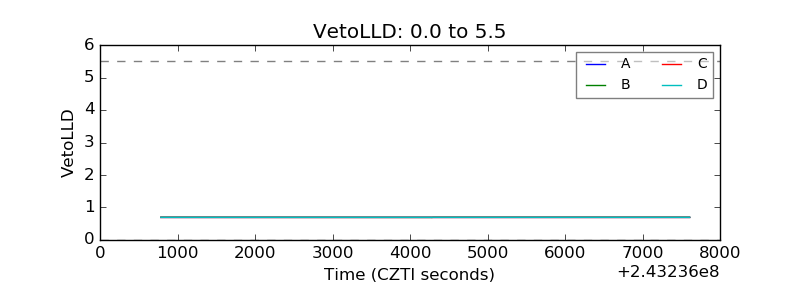 |
| Alpha Counter | 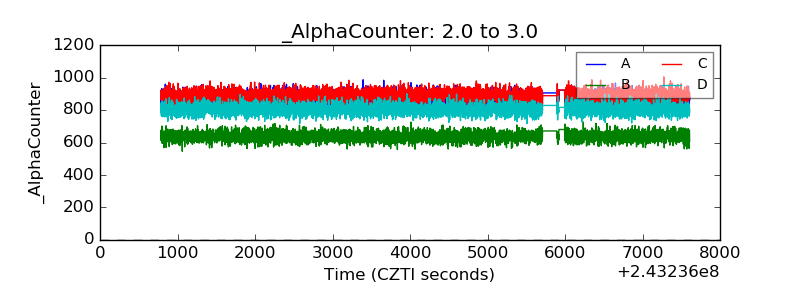 |
| _CPM_Rate | 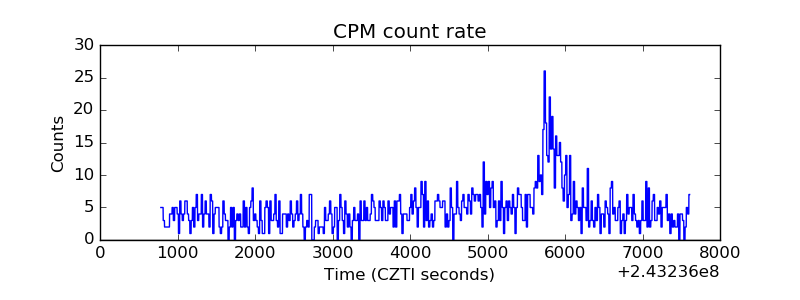 |
| CZT Counter | 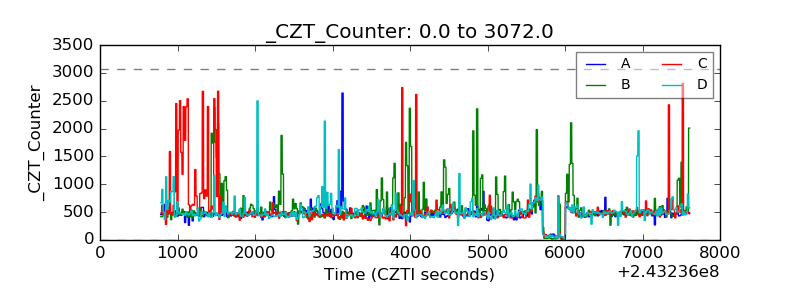 |
| +2.5 Volts monitor |  |
| +5 Volts monitor |  |
| _ROLL_ROT | 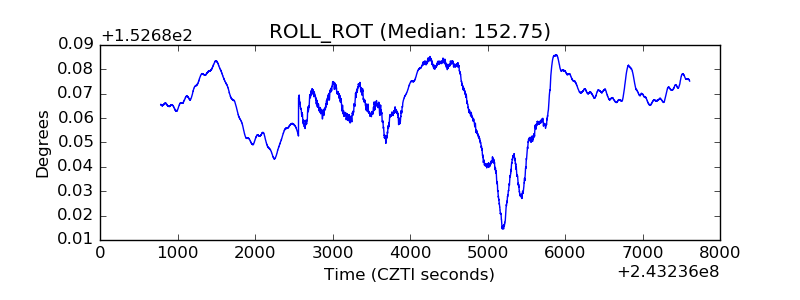 |
| _Roll_DEC | 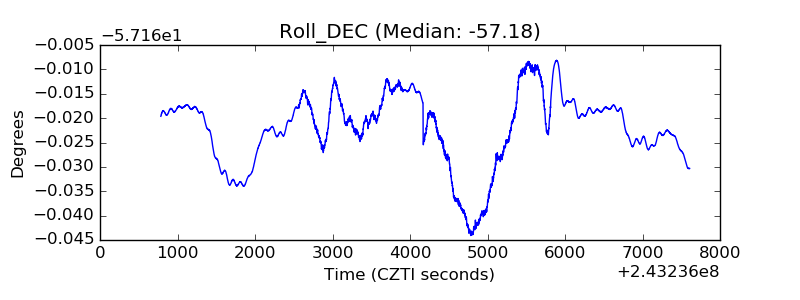 |
| _Roll_RA | 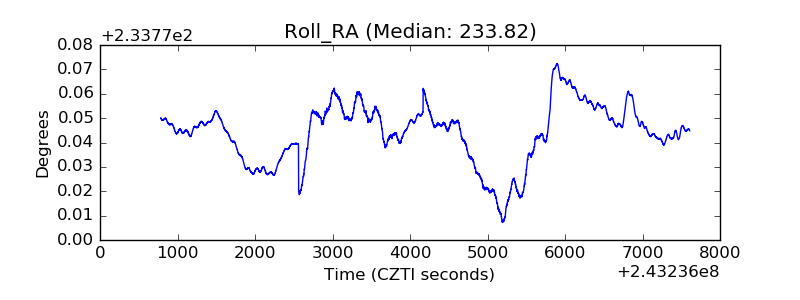 |
| Veto Counter | 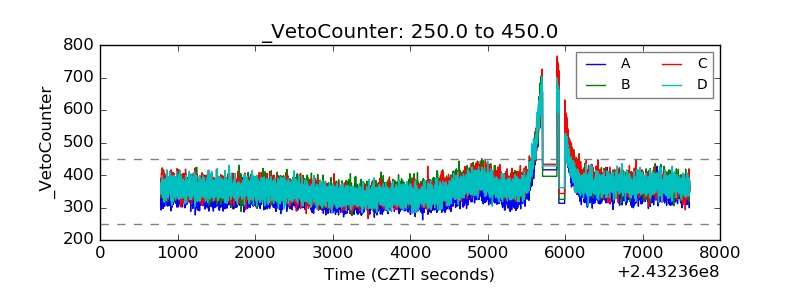 |