| Param | Original file | Final file |
|---|---|---|
| Filename | modeM0/AS1T01_191T01_9000001536_10646cztM0_level2.evt | modeM0/AS1T01_191T01_9000001536_10646cztM0_level2_quad_clean.evt |
| Size (bytes) | 894,458,880 | 184,253,760 |
| Size | 853.0 MB | 175.7 MB |
| Events in quadrant A | 5,870,008 | 1,209,410 |
| Events in quadrant B | 8,156,314 | 1,182,341 |
| Events in quadrant C | 5,584,183 | 1,221,187 |
| Events in quadrant D | 6,678,629 | 1,150,190 |
| Mode SS | |||
|---|---|---|---|
| Quadrant | BADHDUFLAG | Total packets | Discarded packets |
| A | 0 | 240 | 0 |
| B | 0 | 240 | 0 |
| C | 0 | 240 | 0 |
| D | 0 | 240 | 0 |
| Mode M9 | |||
|---|---|---|---|
| Quadrant | BADHDUFLAG | Total packets | Discarded packets |
| A | 0 | 12 | 0 |
| B | 0 | 12 | 0 |
| C | 0 | 12 | 0 |
| D | 0 | 12 | 0 |
| Mode M0 | |||
|---|---|---|---|
| Quadrant | BADHDUFLAG | Total packets | Discarded packets |
| A | 0 | 24955 | 3 |
| B | 0 | 31704 | 2 |
| C | 0 | 24409 | 2 |
| D | 0 | 27064 | 2 |
| Quadrant | Total seconds | Saturated seconds | Saturation percentage |
|---|---|---|---|
| A | 11823 | 131 | 1.108010% |
| B | 11823 | 754 | 6.377400% |
| C | 11823 | 112 | 0.947306% |
| D | 11823 | 165 | 1.395585% |
Noise dominated data is calculated using 1-second bins in cleaned event files. If a bin has >2000 counts, and if more than 50% of those come from <1% of pixels, then it is considered to be noise-dominated and hence unusable.
| Quadrant | # 1 sec bins | Bins with >0 counts | Bins with >2000 counts | High rate bins dominated by noise | Noise dominated (total time) | Noise dominated (detector-on time) | Marked lightcurve |
|---|---|---|---|---|---|---|---|
| A | 12993 | 11825 | 0 | 0 | 0.00% | 0.00% | 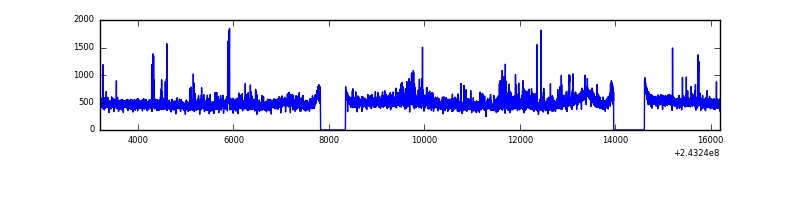 |
| B | 12993 | 11825 | 417 | 417 | 3.21% | 3.53% | 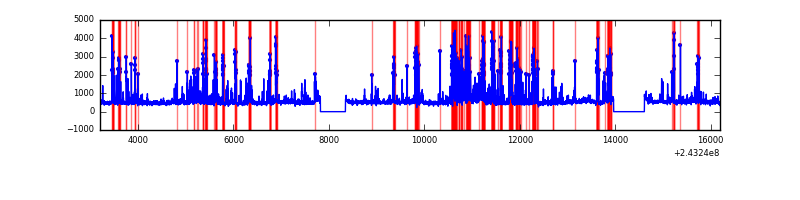 |
| C | 12993 | 11825 | 17 | 17 | 0.13% | 0.14% | 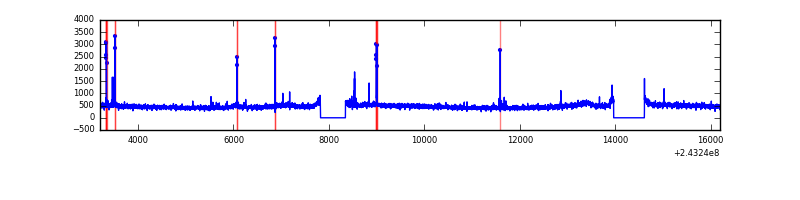 |
| D | 12993 | 11825 | 65 | 65 | 0.50% | 0.55% | 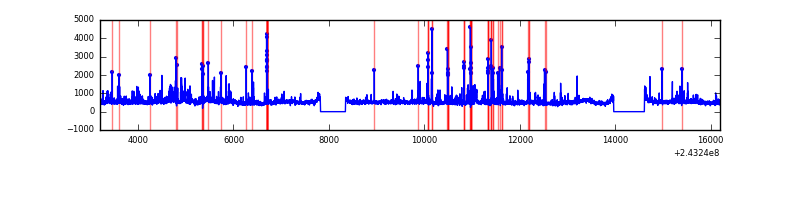 |
Top three noisy pixels from each quadrant. If the there are fewer than three noisy pixels in the level2.evt file, extra rows are filled as -1
| Pixel properties | Quadrant properties | ||||||
|---|---|---|---|---|---|---|---|
| Quadrant | DetID | PixID | Counts | Sigma | Mean | Median | Sigma |
| A | 1 | 162 | 103482 | 343.46 | 1432 | 1405 | 297.2 |
| A | 15 | 174 | 79873 | 264.02 | 1432 | 1405 | 297.2 |
| A | 1 | 178 | 41725 | 135.66 | 1432 | 1405 | 297.2 |
| B | 4 | 239 | 2314657 | 8635.66 | 1395 | 1365 | 267.9 |
| B | 0 | 168 | 164253 | 608.07 | 1395 | 1365 | 267.9 |
| B | 0 | 214 | 74491 | 272.98 | 1395 | 1365 | 267.9 |
| C | 4 | 254 | 101347 | 308.34 | 1384 | 1400 | 324.1 |
| C | 14 | 234 | 86685 | 263.11 | 1384 | 1400 | 324.1 |
| C | 13 | 61 | 10190 | 27.12 | 1384 | 1400 | 324.1 |
| D | 8 | 195 | 435169 | 1279.03 | 1384 | 1351 | 339.2 |
| D | 7 | 71 | 170917 | 499.93 | 1384 | 1351 | 339.2 |
| D | 2 | 16 | 165448 | 483.81 | 1384 | 1351 | 339.2 |
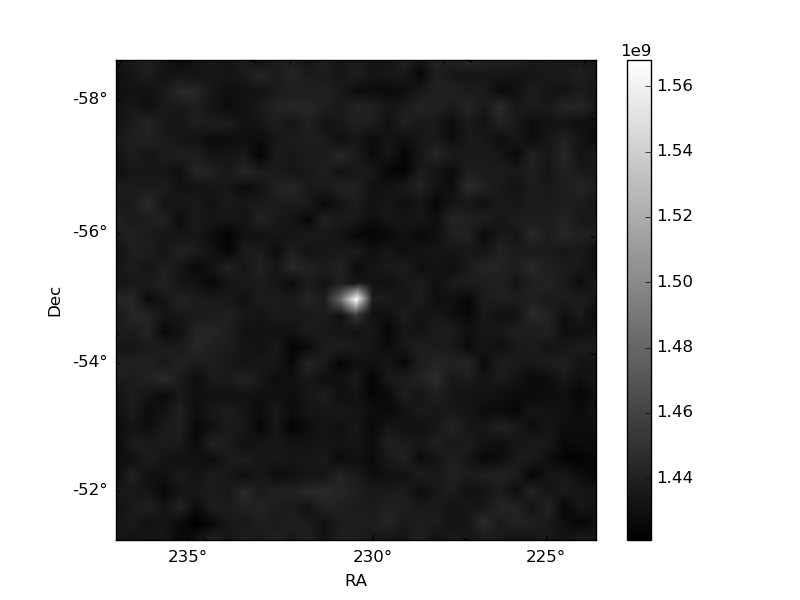
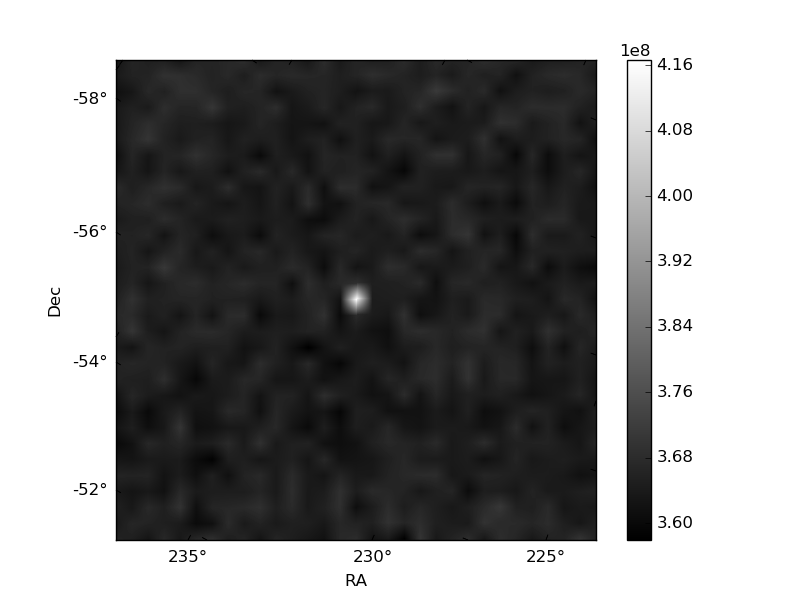
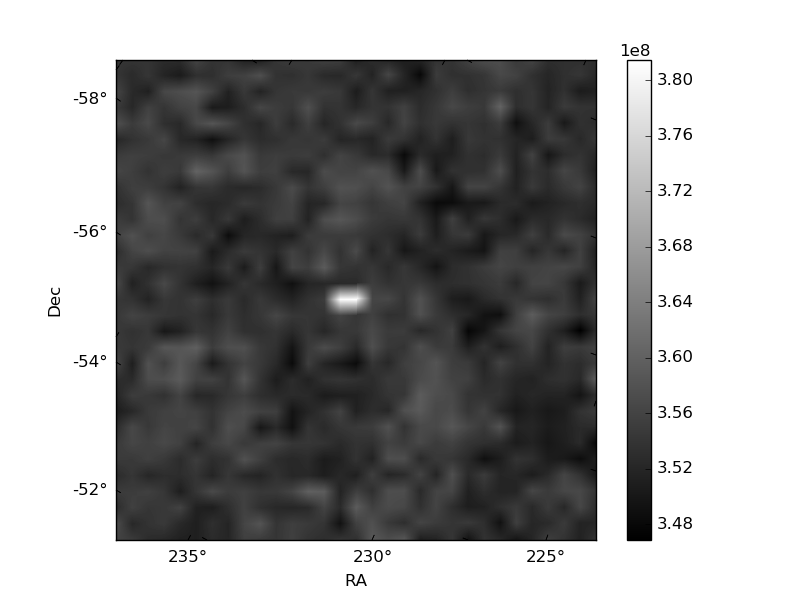
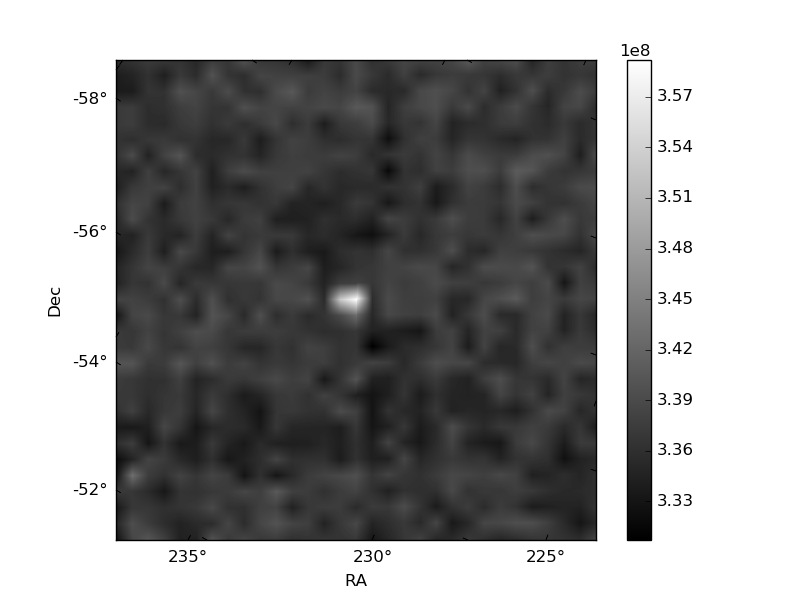
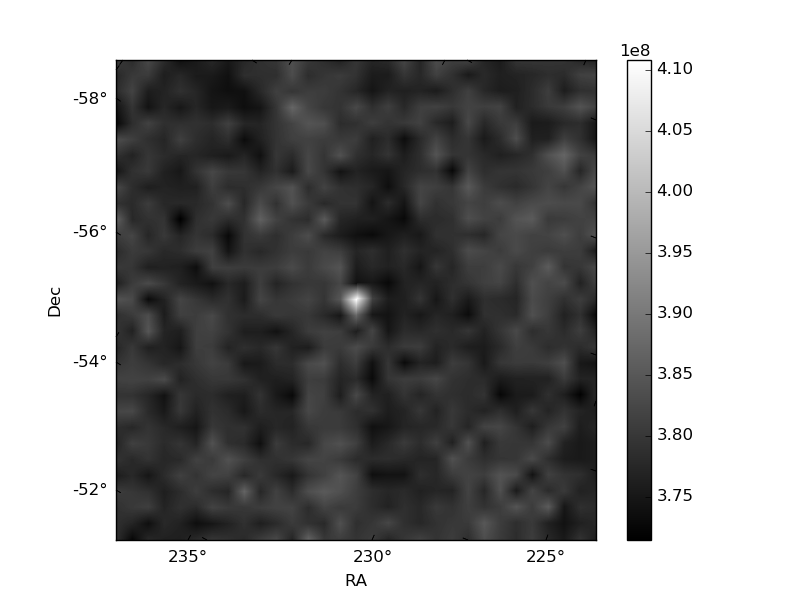
Histogram calculated using DETX and DETY for each event in the final _common_clean file
| Quadrant A | 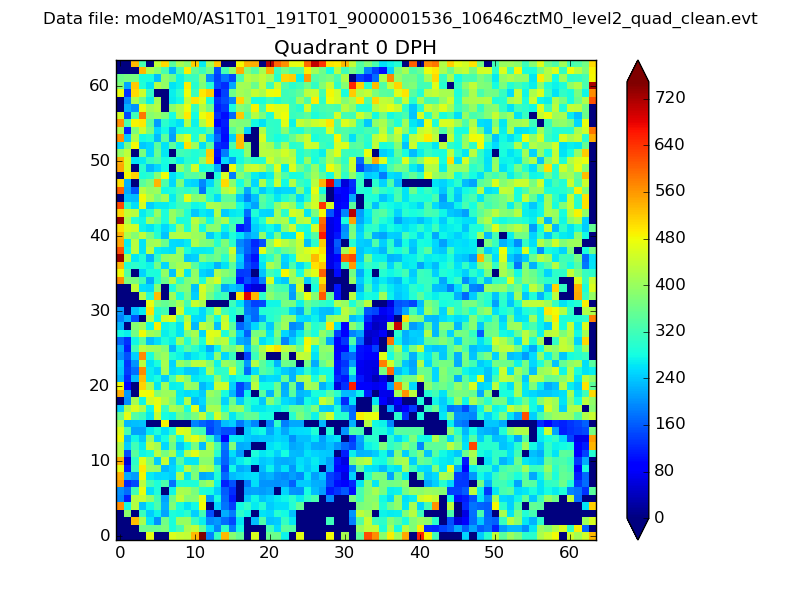 |
 |
Quadrant B |
|---|---|---|---|
| Quadrant D | 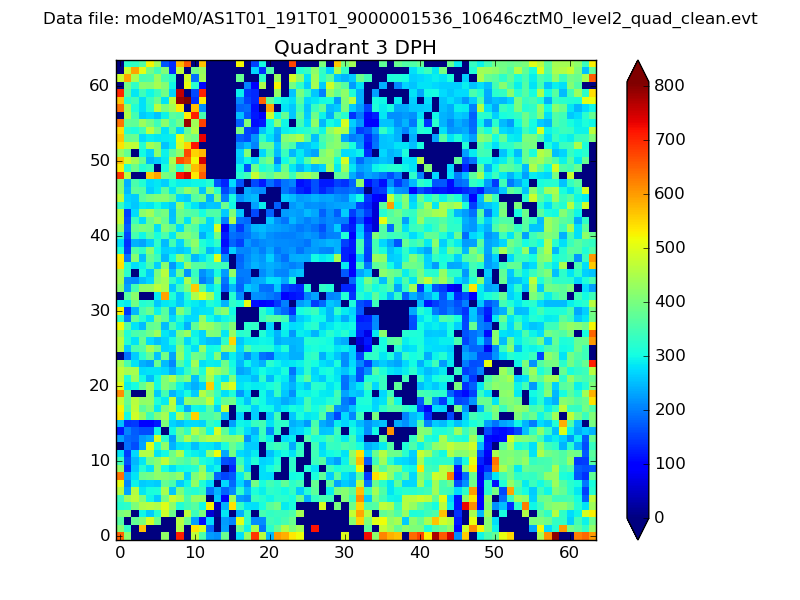 |
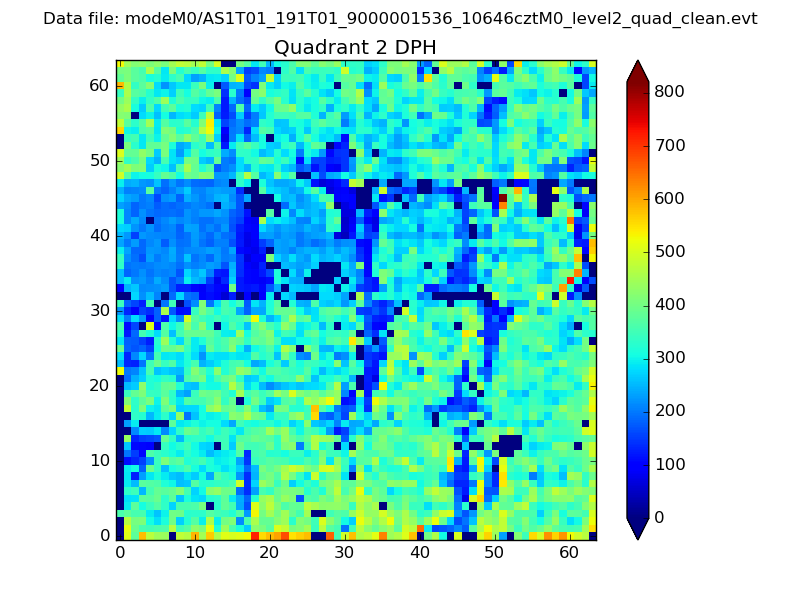 |
Quadrant C |
| Plot type | Count rate plots | Images |
|---|---|---|
| Comparison with Poisson distribution Blue bars denote a histogram of data divided into 1 sec bins. Red curve is a Poisson curve with rate = median count rate of data. |
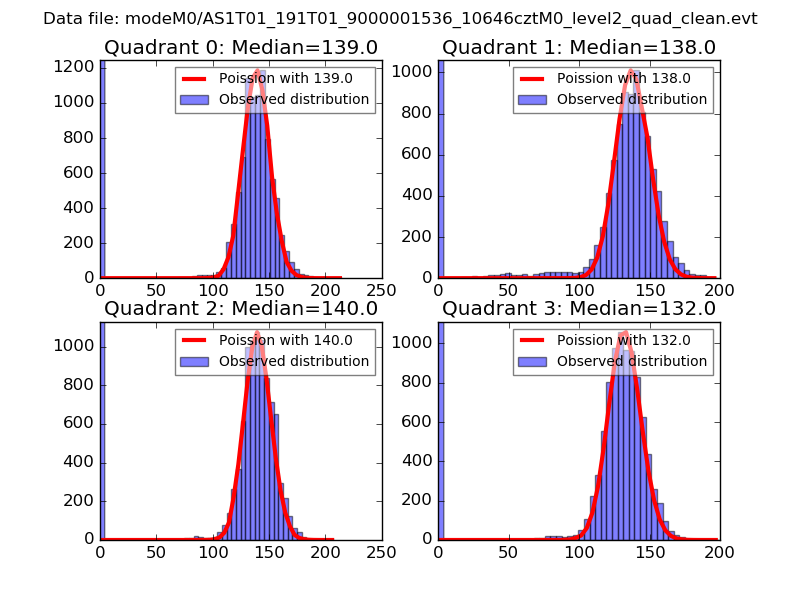 |
 |
| Quadrant-wise count rates Data is divided into 100 sec bins |
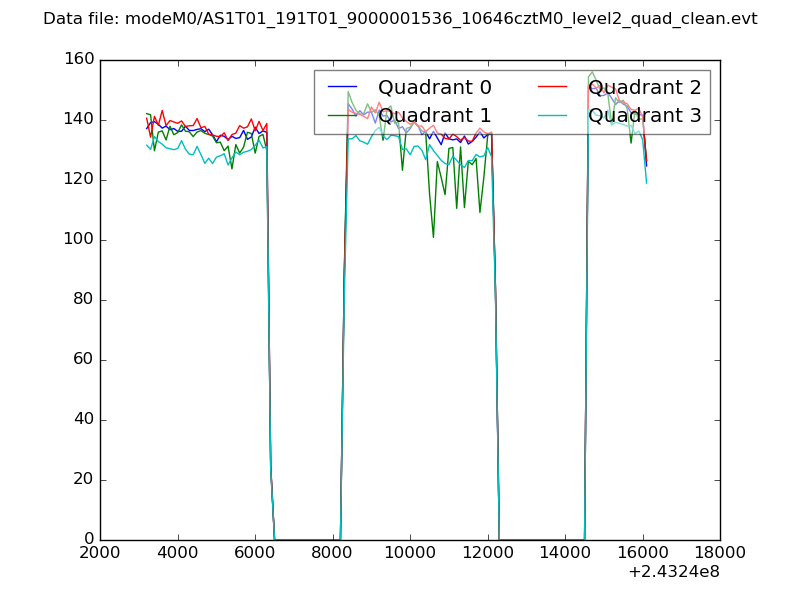 |
|
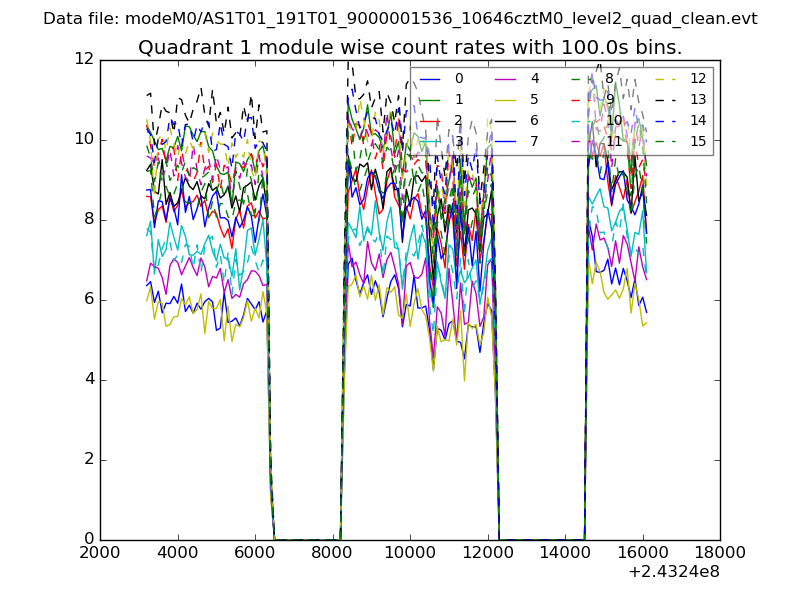
| Module-wise count rates for Quadrant A Data is divided into 100 sec bins |
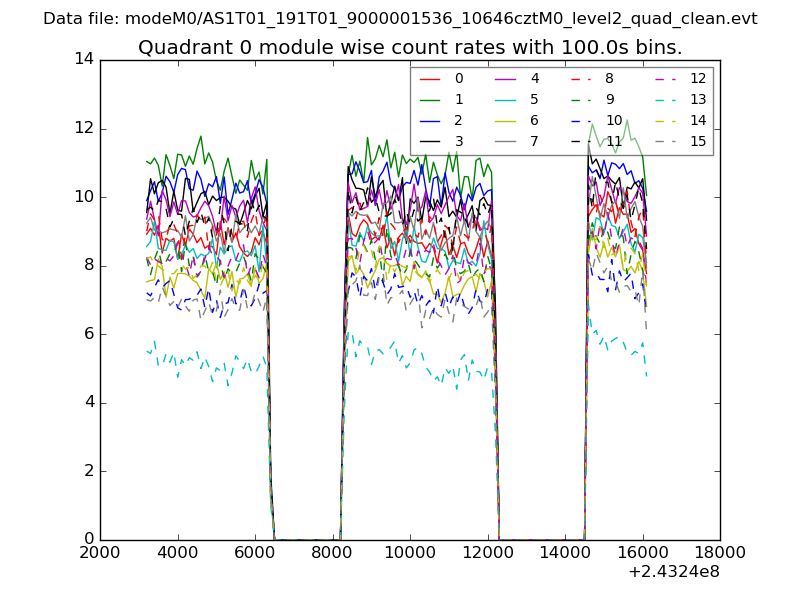 |
 |
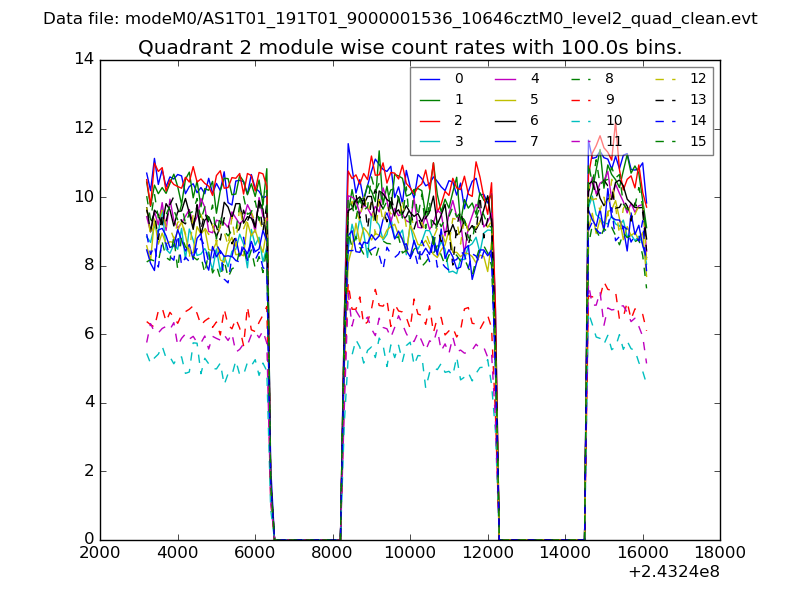
| Module-wise count rates for Quadrant B Data is divided into 100 sec bins |
 |
 |
| Module-wise count rates for Quadrant C Data is divided into 100 sec bins |
 |
 |
| Module-wise count rates for Quadrant D Data is divided into 100 sec bins |
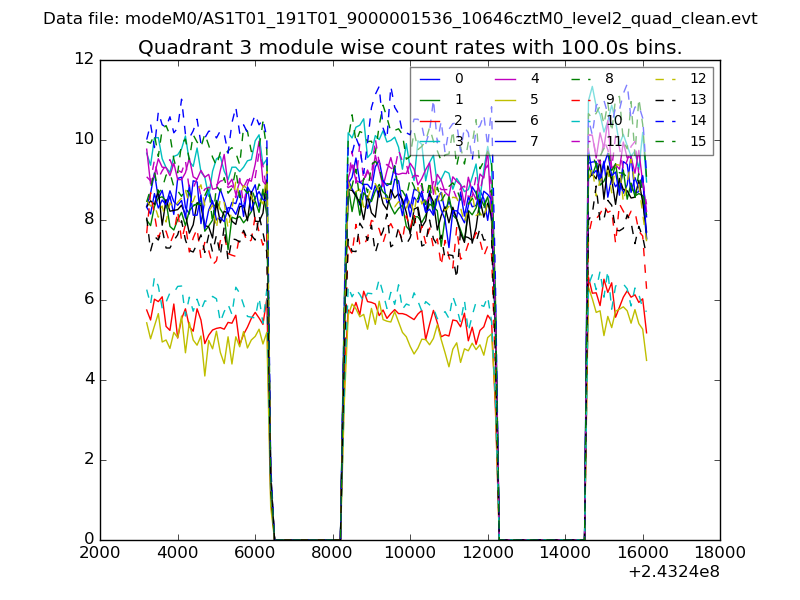 |
 |
| Parameter | Plot |
|---|---|
| CZT HV Monitor | 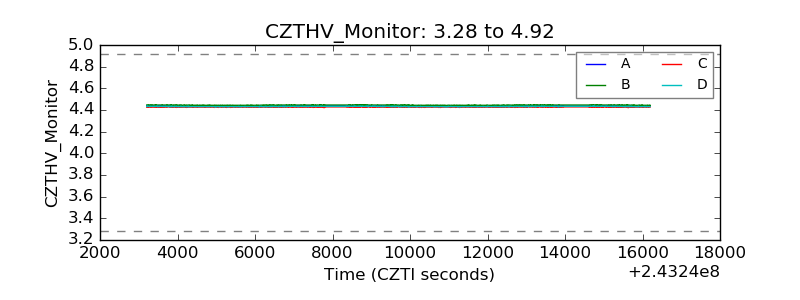 |
| D_VDD | 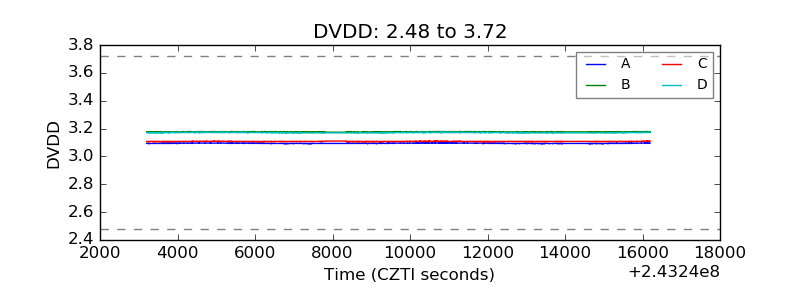 |
| Temperature 1 |  |
| Veto HV Monitor | 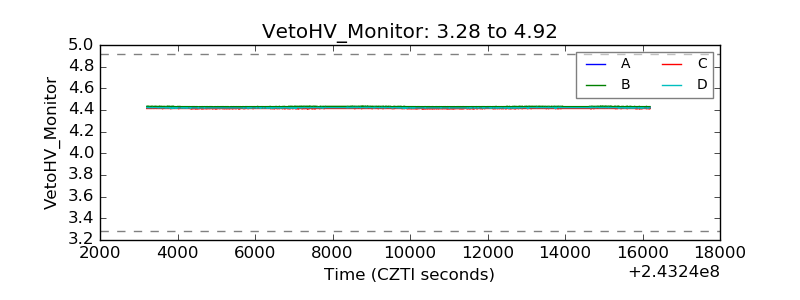 |
| Veto LLD | 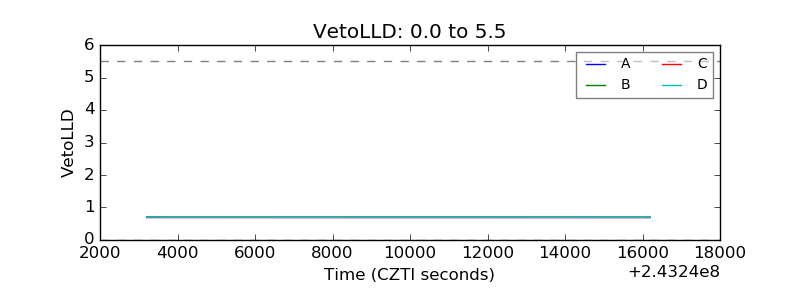 |
| Alpha Counter | 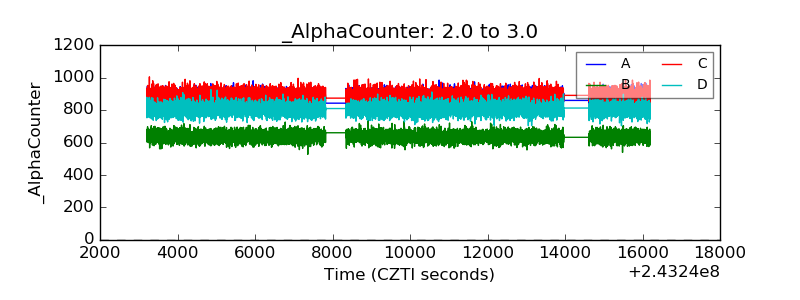 |
| _CPM_Rate | 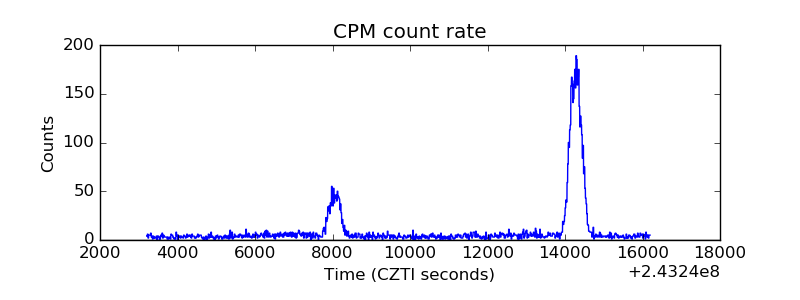 |
| CZT Counter | 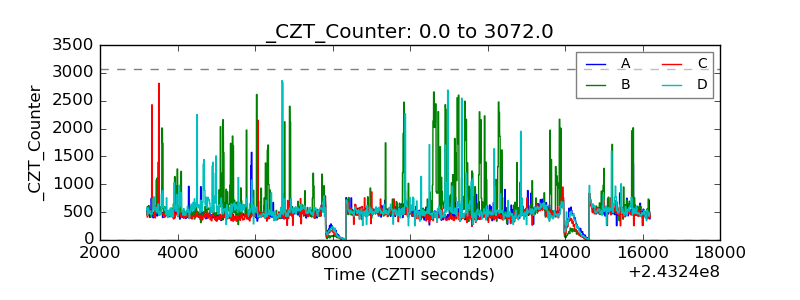 |
| +2.5 Volts monitor |  |
| +5 Volts monitor |  |
| _ROLL_ROT | 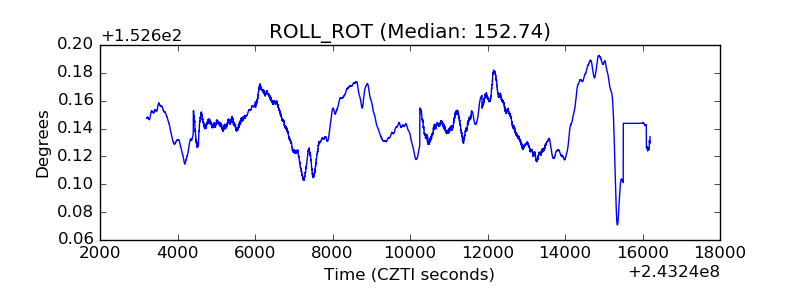 |
| _Roll_DEC | 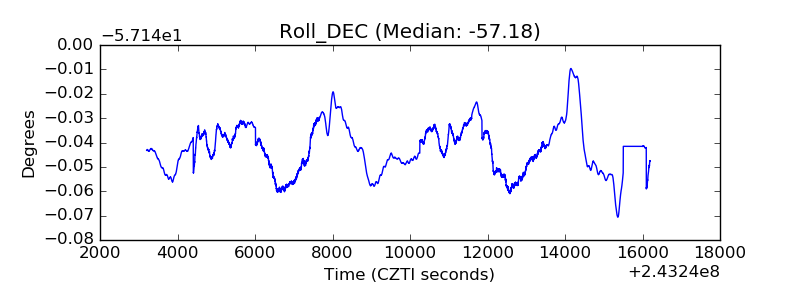 |
| _Roll_RA | 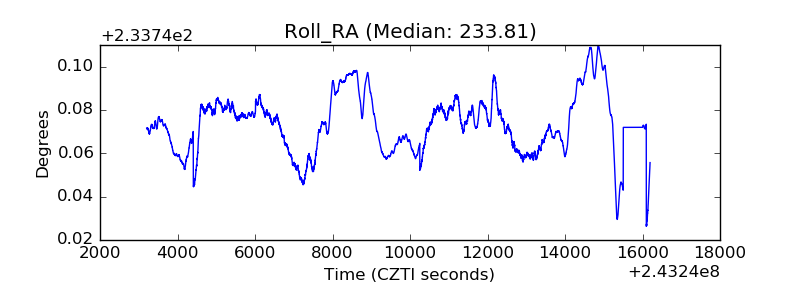 |
| Veto Counter |  |