| Param | Original file | Final file |
|---|---|---|
| Filename | modeM0/AS1T01_191T01_9000001536_10647cztM0_level2.evt | modeM0/AS1T01_191T01_9000001536_10647cztM0_level2_quad_clean.evt |
| Size (bytes) | 479,485,440 | 86,132,160 |
| Size | 457.3 MB | 82.1 MB |
| Events in quadrant A | 2,800,463 | 567,102 |
| Events in quadrant B | 4,390,364 | 544,268 |
| Events in quadrant C | 3,537,144 | 559,682 |
| Events in quadrant D | 3,398,648 | 530,856 |
| Mode SS | |||
|---|---|---|---|
| Quadrant | BADHDUFLAG | Total packets | Discarded packets |
| A | 0 | 118 | 0 |
| B | 0 | 118 | 0 |
| C | 0 | 118 | 0 |
| D | 0 | 118 | 0 |
| Mode M9 | |||
|---|---|---|---|
| Quadrant | BADHDUFLAG | Total packets | Discarded packets |
| A | 0 | 9 | 0 |
| B | 0 | 9 | 0 |
| C | 0 | 9 | 0 |
| D | 0 | 9 | 0 |
| Mode M0 | |||
|---|---|---|---|
| Quadrant | BADHDUFLAG | Total packets | Discarded packets |
| A | 0 | 12125 | 2 |
| B | 0 | 16812 | 1 |
| C | 0 | 14421 | 1 |
| D | 0 | 13772 | 1 |
| Quadrant | Total seconds | Saturated seconds | Saturation percentage |
|---|---|---|---|
| A | 5813 | 45 | 0.774127% |
| B | 5813 | 495 | 8.515397% |
| C | 5813 | 260 | 4.472734% |
| D | 5813 | 146 | 2.511612% |
Noise dominated data is calculated using 1-second bins in cleaned event files. If a bin has >2000 counts, and if more than 50% of those come from <1% of pixels, then it is considered to be noise-dominated and hence unusable.
| Quadrant | # 1 sec bins | Bins with >0 counts | Bins with >2000 counts | High rate bins dominated by noise | Noise dominated (total time) | Noise dominated (detector-on time) | Marked lightcurve |
|---|---|---|---|---|---|---|---|
| A | 6673 | 5814 | 4 | 4 | 0.06% | 0.07% | 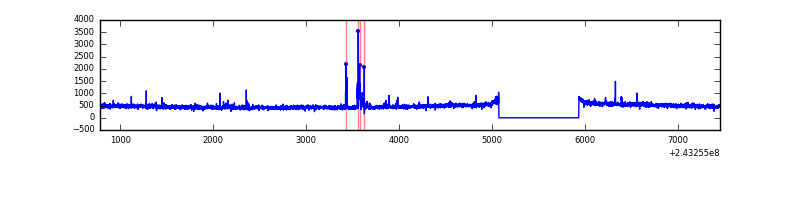 |
| B | 6673 | 5814 | 275 | 275 | 4.12% | 4.73% |  |
| C | 6673 | 5813 | 203 | 203 | 3.04% | 3.49% | 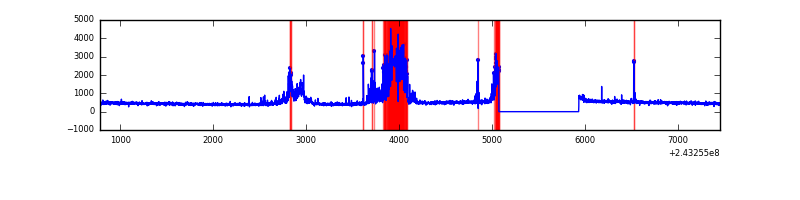 |
| D | 6673 | 5814 | 107 | 107 | 1.60% | 1.84% | 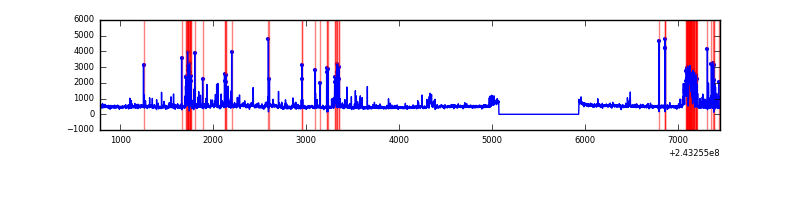 |
Top three noisy pixels from each quadrant. If the there are fewer than three noisy pixels in the level2.evt file, extra rows are filled as -1
| Pixel properties | Quadrant properties | ||||||
|---|---|---|---|---|---|---|---|
| Quadrant | DetID | PixID | Counts | Sigma | Mean | Median | Sigma |
| A | 15 | 174 | 59017 | 401.61 | 698 | 685 | 145.2 |
| A | 1 | 162 | 22760 | 151.99 | 698 | 685 | 145.2 |
| A | 13 | 251 | 8534 | 54.04 | 698 | 685 | 145.2 |
| B | 4 | 239 | 1620431 | 12253.08 | 676 | 663 | 132.2 |
| B | 0 | 214 | 41265 | 307.14 | 676 | 663 | 132.2 |
| B | 0 | 168 | 21990 | 161.33 | 676 | 663 | 132.2 |
| C | 4 | 254 | 940061 | 6131.05 | 654 | 662 | 153.2 |
| C | 14 | 234 | 32671 | 208.91 | 654 | 662 | 153.2 |
| C | 9 | 54 | 11137 | 68.37 | 654 | 662 | 153.2 |
| D | 10 | 199 | 193608 | 1186.93 | 664 | 647 | 162.6 |
| D | 2 | 16 | 127522 | 780.43 | 664 | 647 | 162.6 |
| D | 7 | 71 | 117903 | 721.26 | 664 | 647 | 162.6 |
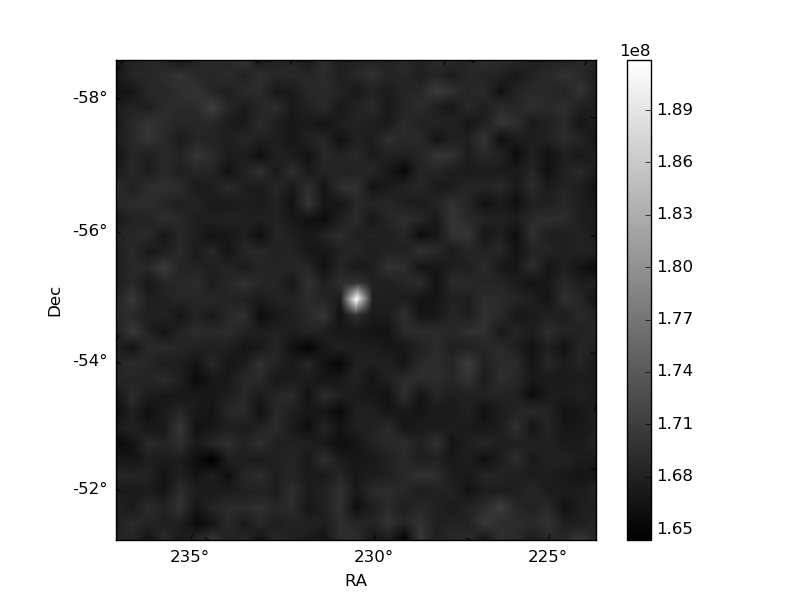
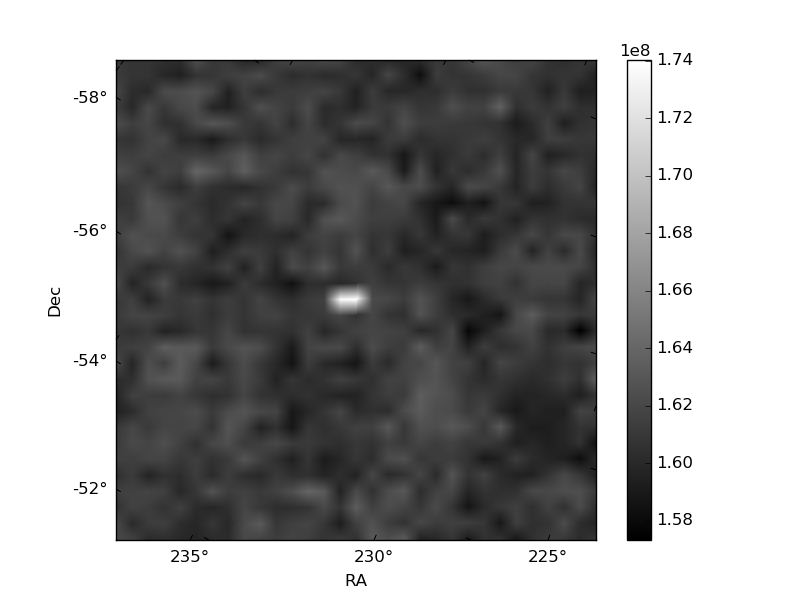
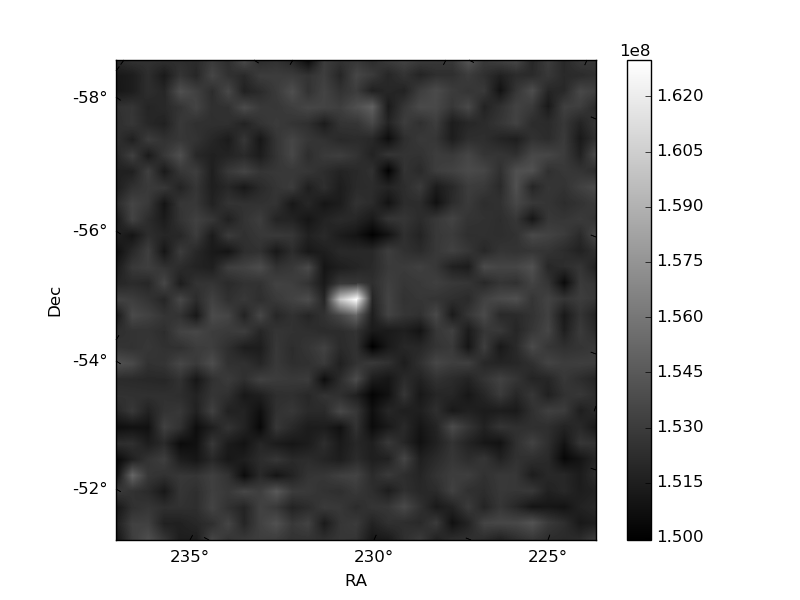
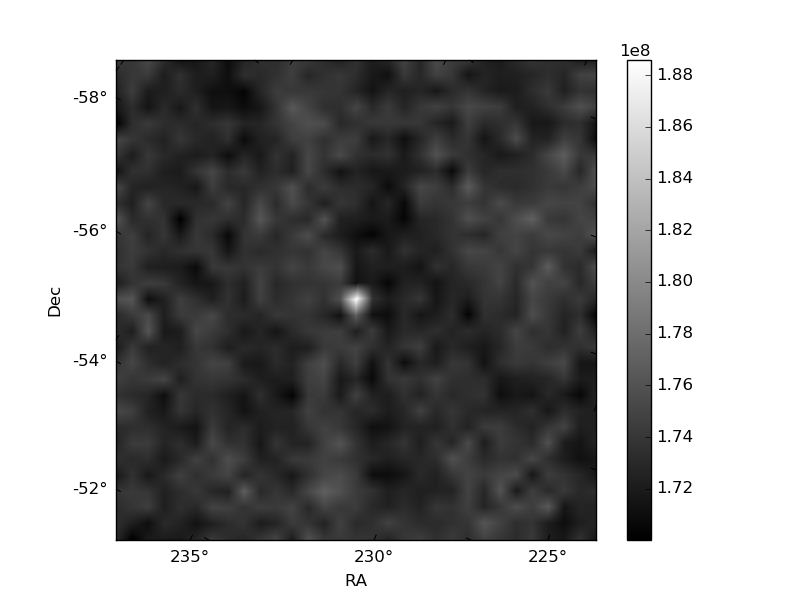
Histogram calculated using DETX and DETY for each event in the final _common_clean file
| Quadrant A |  |
 |
Quadrant B |
|---|---|---|---|
| Quadrant D | 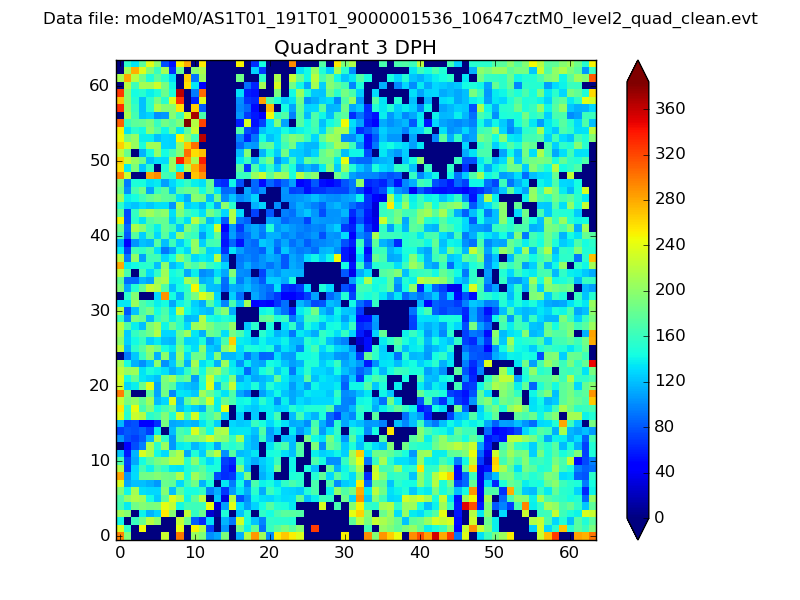 |
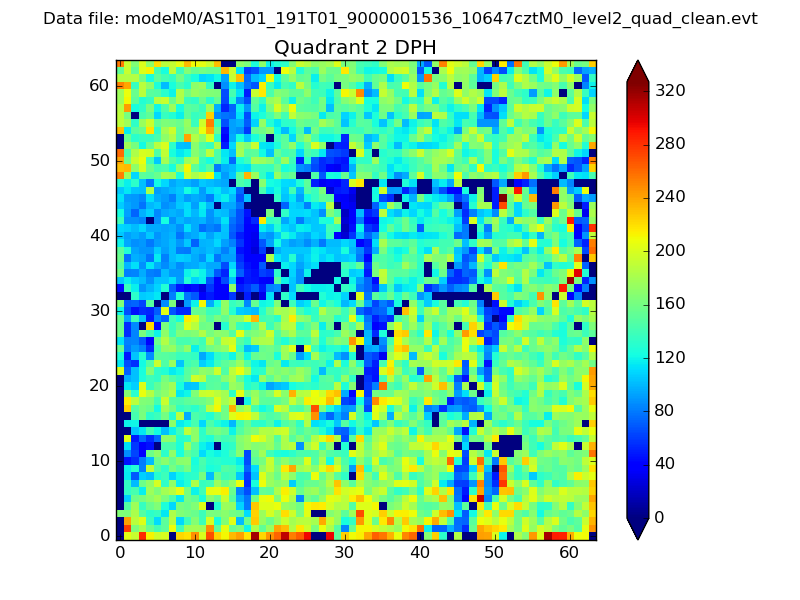 |
Quadrant C |
| Plot type | Count rate plots | Images |
|---|---|---|
| Comparison with Poisson distribution Blue bars denote a histogram of data divided into 1 sec bins. Red curve is a Poisson curve with rate = median count rate of data. |
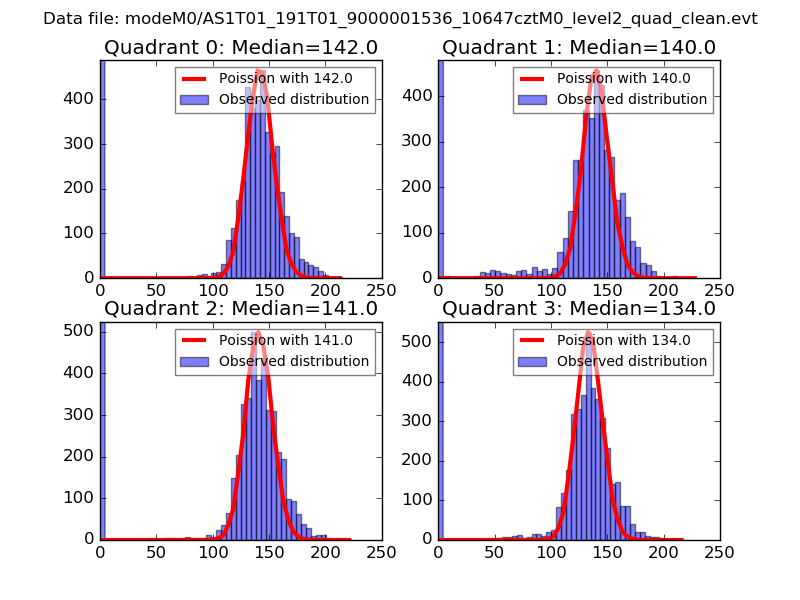 |
 |
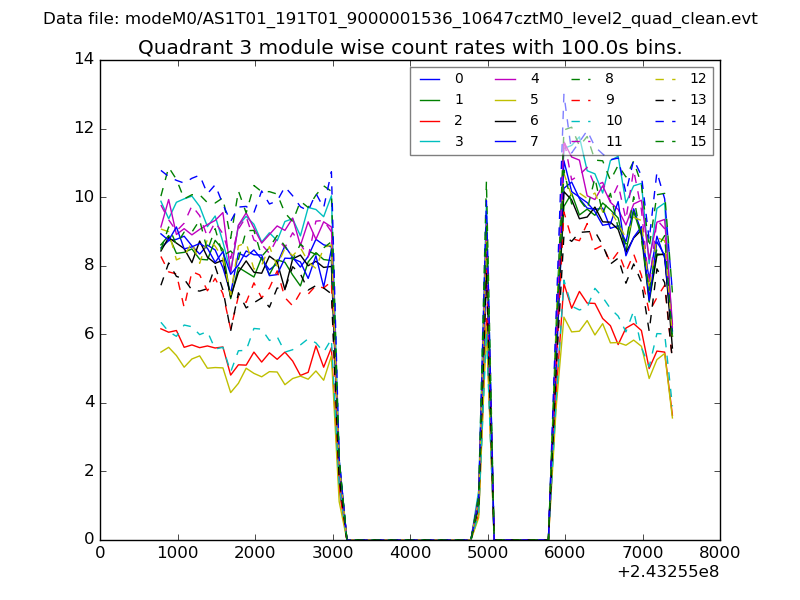
| Quadrant-wise count rates Data is divided into 100 sec bins |
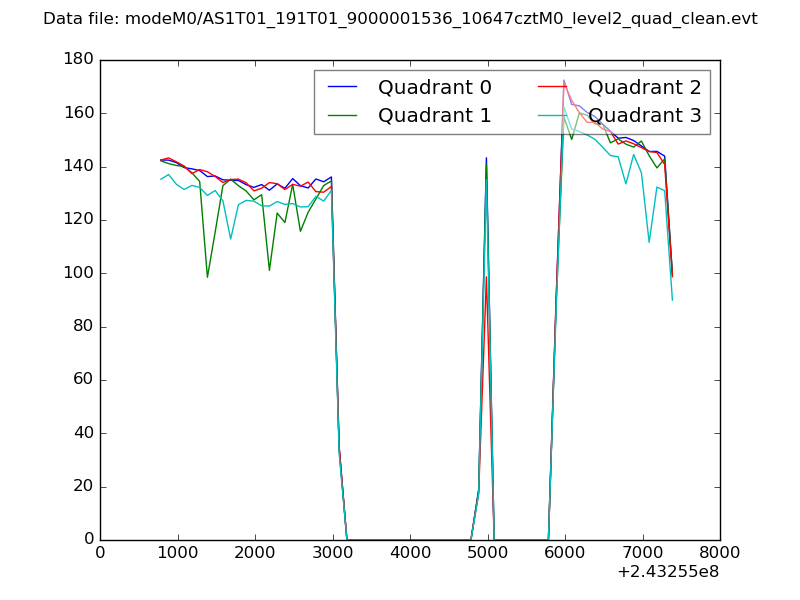 |
|
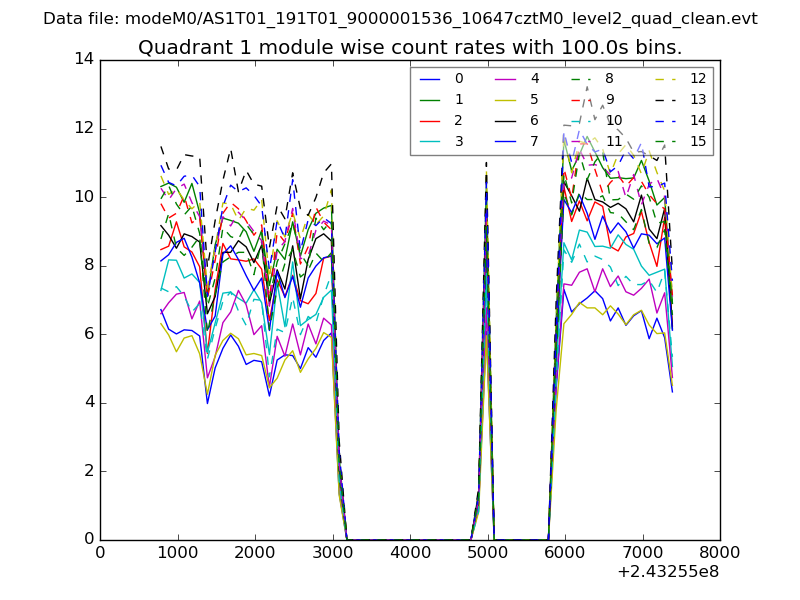
| Module-wise count rates for Quadrant A Data is divided into 100 sec bins |
 |
 |
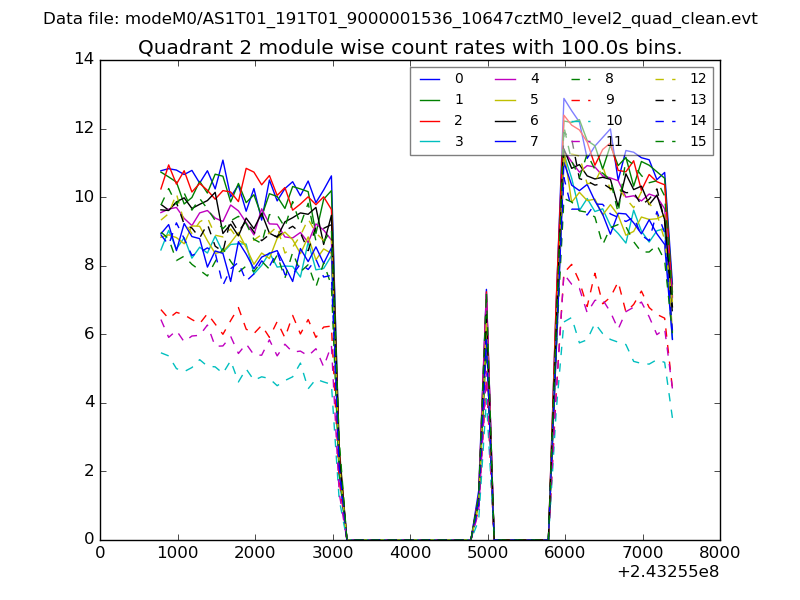
| Module-wise count rates for Quadrant B Data is divided into 100 sec bins |
 |
 |
| Module-wise count rates for Quadrant C Data is divided into 100 sec bins |
 |
 |
| Module-wise count rates for Quadrant D Data is divided into 100 sec bins |
 |
 |
| Parameter | Plot |
|---|---|
| CZT HV Monitor |  |
| D_VDD | 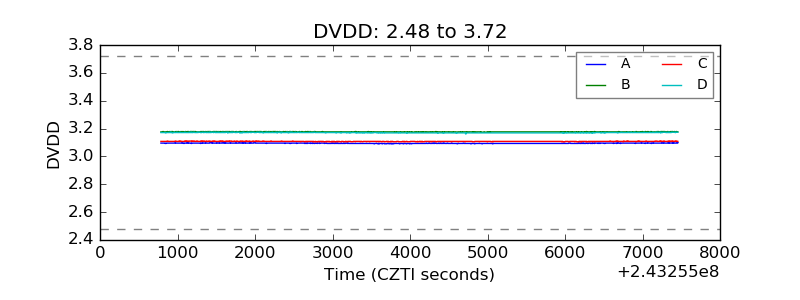 |
| Temperature 1 | 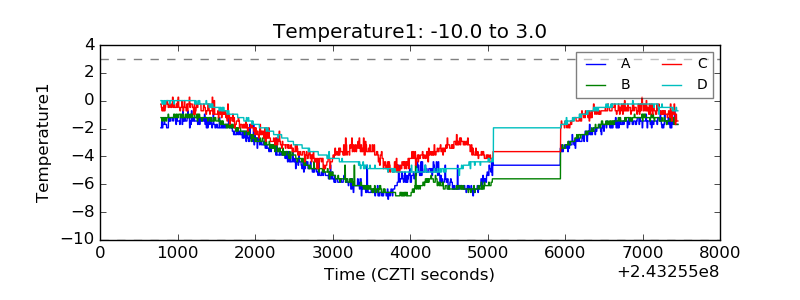 |
| Veto HV Monitor | 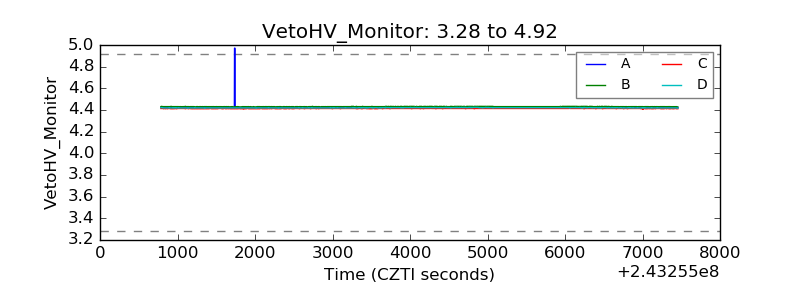 |
| Veto LLD | 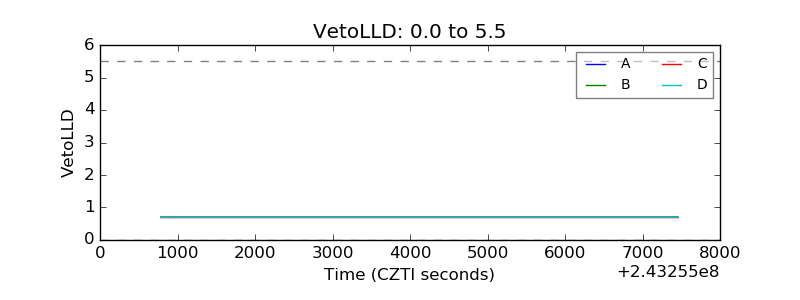 |
| Alpha Counter | 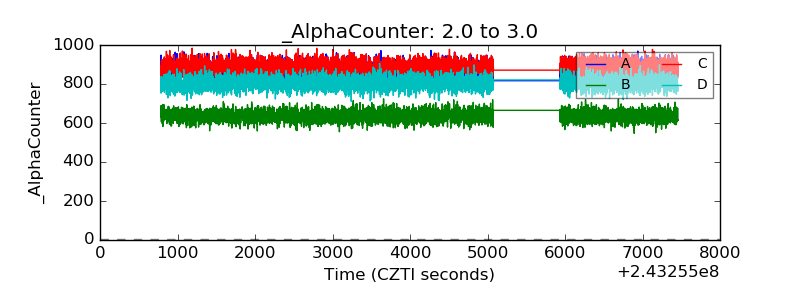 |
| _CPM_Rate | 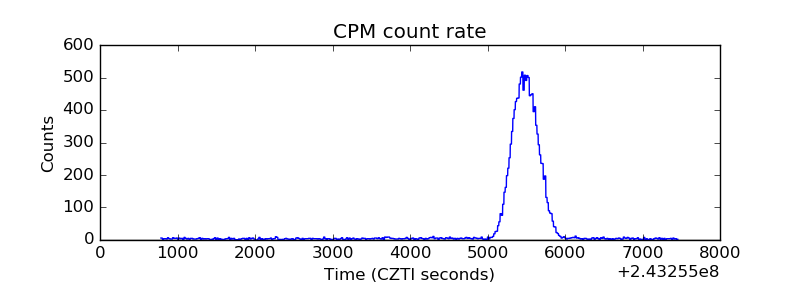 |
| CZT Counter | 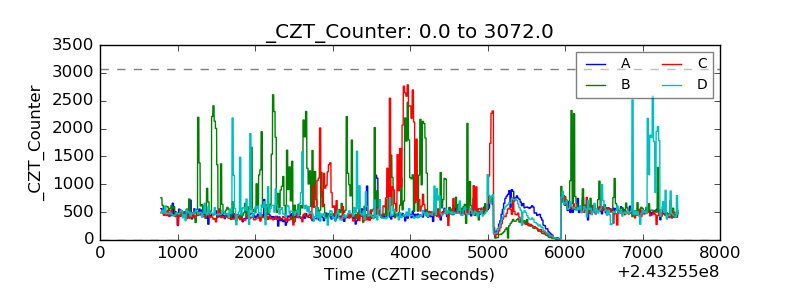 |
| +2.5 Volts monitor |  |
| +5 Volts monitor | 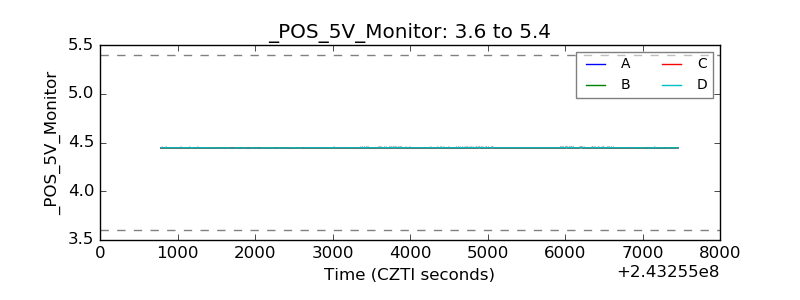 |
| _ROLL_ROT | 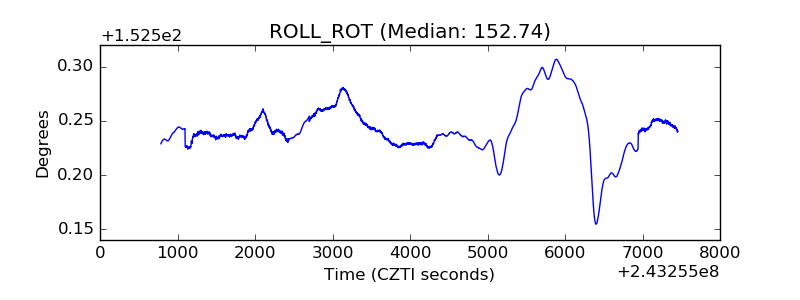 |
| _Roll_DEC | 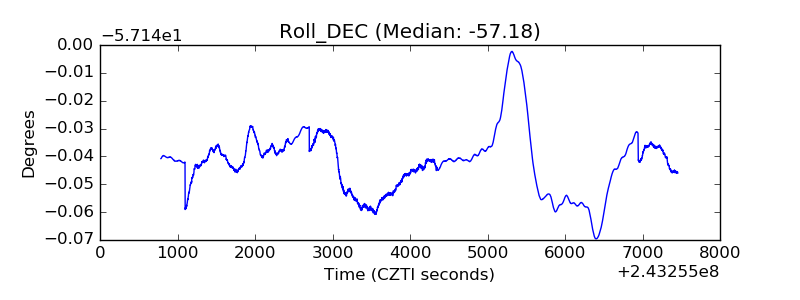 |
| _Roll_RA | 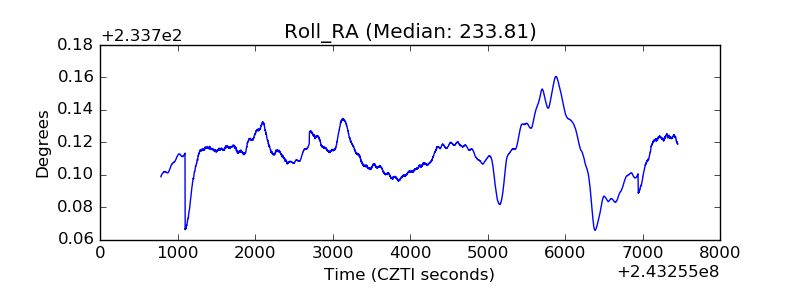 |
| Veto Counter | 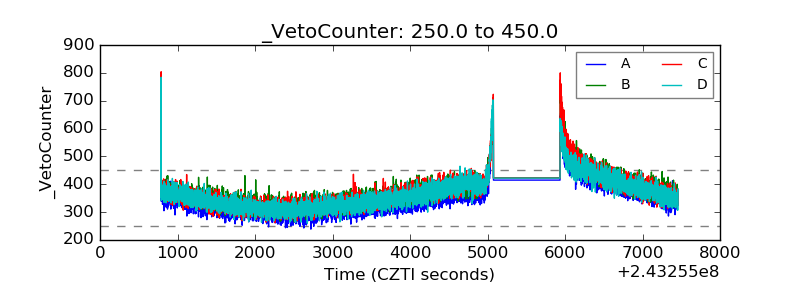 |