| Param | Original file | Final file |
|---|---|---|
| Filename | modeM0/AS1T01_191T01_9000001536_10648cztM0_level2.evt | modeM0/AS1T01_191T01_9000001536_10648cztM0_level2_quad_clean.evt |
| Size (bytes) | 449,925,120 | 92,321,280 |
| Size | 429.1 MB | 88.0 MB |
| Events in quadrant A | 2,787,063 | 616,831 |
| Events in quadrant B | 4,102,836 | 586,875 |
| Events in quadrant C | 2,843,199 | 607,082 |
| Events in quadrant D | 3,490,784 | 571,614 |
| Mode SS | |||
|---|---|---|---|
| Quadrant | BADHDUFLAG | Total packets | Discarded packets |
| A | 0 | 122 | 0 |
| B | 0 | 122 | 0 |
| C | 0 | 122 | 0 |
| D | 0 | 122 | 0 |
| Mode M9 | |||
|---|---|---|---|
| Quadrant | BADHDUFLAG | Total packets | Discarded packets |
| A | 0 | 10 | 0 |
| B | 0 | 10 | 0 |
| C | 0 | 10 | 0 |
| D | 0 | 10 | 0 |
| Mode M0 | |||
|---|---|---|---|
| Quadrant | BADHDUFLAG | Total packets | Discarded packets |
| A | 0 | 12231 | 2 |
| B | 0 | 16009 | 1 |
| C | 0 | 12454 | 1 |
| D | 0 | 14589 | 1 |
| Quadrant | Total seconds | Saturated seconds | Saturation percentage |
|---|---|---|---|
| A | 5911 | 53 | 0.896633% |
| B | 5911 | 347 | 5.870411% |
| C | 5911 | 32 | 0.541364% |
| D | 5911 | 193 | 3.265099% |
Noise dominated data is calculated using 1-second bins in cleaned event files. If a bin has >2000 counts, and if more than 50% of those come from <1% of pixels, then it is considered to be noise-dominated and hence unusable.
| Quadrant | # 1 sec bins | Bins with >0 counts | Bins with >2000 counts | High rate bins dominated by noise | Noise dominated (total time) | Noise dominated (detector-on time) | Marked lightcurve |
|---|---|---|---|---|---|---|---|
| A | 6956 | 5912 | 0 | 0 | 0.00% | 0.00% | 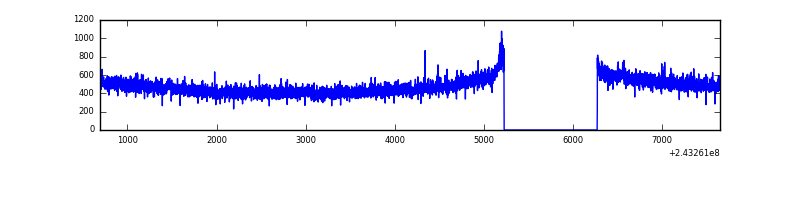 |
| B | 6956 | 5912 | 202 | 202 | 2.90% | 3.42% | 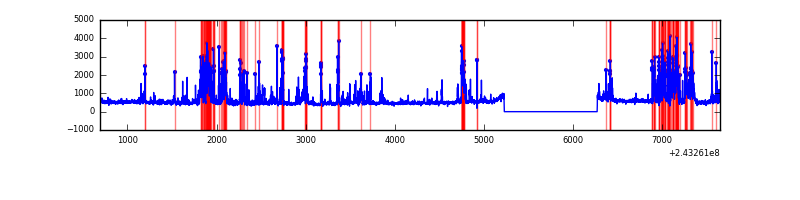 |
| C | 6956 | 5912 | 6 | 6 | 0.09% | 0.10% | 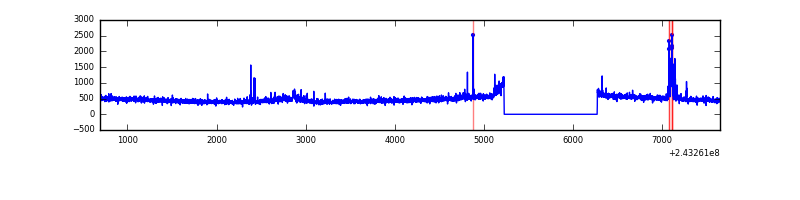 |
| D | 6956 | 5912 | 131 | 131 | 1.88% | 2.22% | 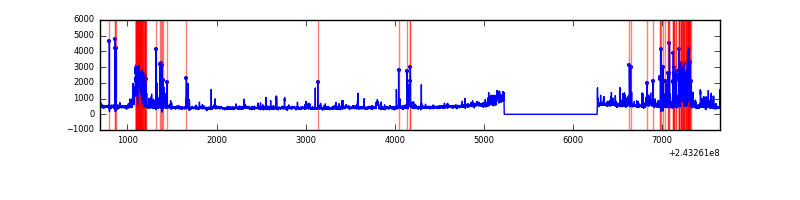 |
Top three noisy pixels from each quadrant. If the there are fewer than three noisy pixels in the level2.evt file, extra rows are filled as -1
| Pixel properties | Quadrant properties | ||||||
|---|---|---|---|---|---|---|---|
| Quadrant | DetID | PixID | Counts | Sigma | Mean | Median | Sigma |
| A | 1 | 162 | 11103 | 69.46 | 714 | 702 | 149.7 |
| A | 15 | 239 | 7525 | 45.57 | 714 | 702 | 149.7 |
| A | 0 | 226 | 6588 | 39.31 | 714 | 702 | 149.7 |
| B | 4 | 239 | 1281062 | 9449.82 | 699 | 685 | 135.5 |
| B | 0 | 214 | 28223 | 203.24 | 699 | 685 | 135.5 |
| B | 0 | 168 | 15939 | 112.58 | 699 | 685 | 135.5 |
| C | 4 | 254 | 140431 | 870.71 | 684 | 693 | 160.5 |
| C | 14 | 234 | 18557 | 111.31 | 684 | 693 | 160.5 |
| C | 4 | 175 | 9647 | 55.79 | 684 | 693 | 160.5 |
| D | 10 | 199 | 225660 | 1352.35 | 677 | 660 | 166.4 |
| D | 12 | 233 | 190207 | 1139.26 | 677 | 660 | 166.4 |
| D | 2 | 14 | 133143 | 796.28 | 677 | 660 | 166.4 |
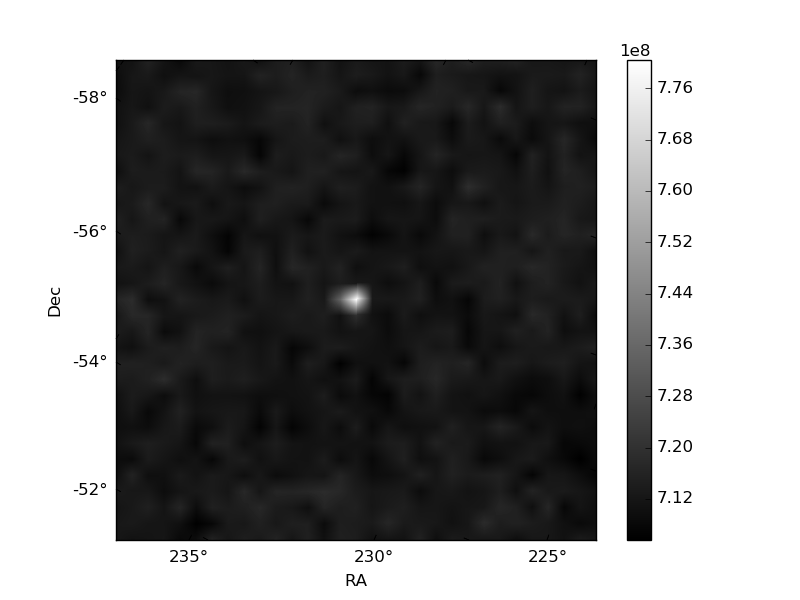
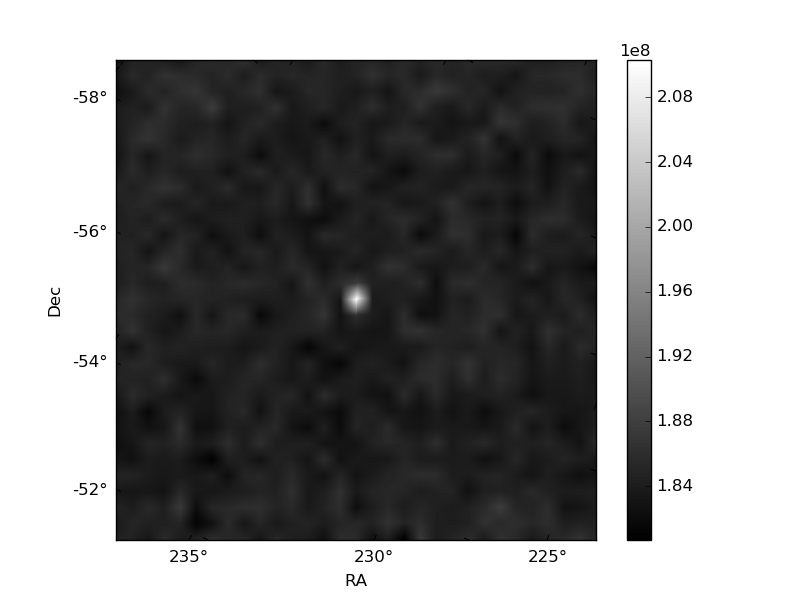
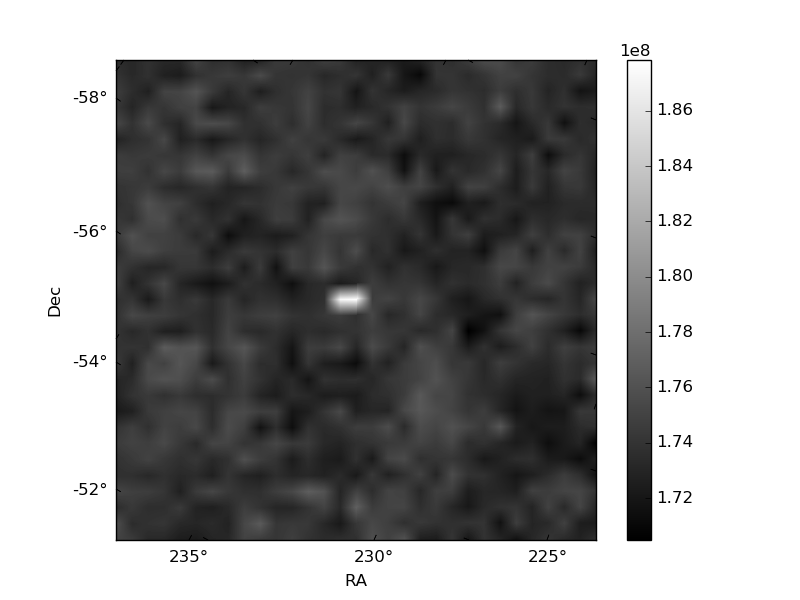
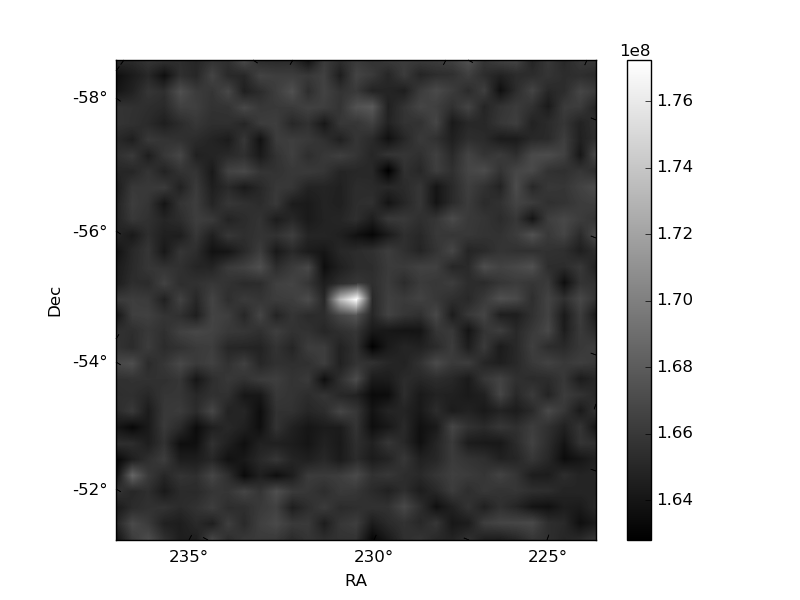
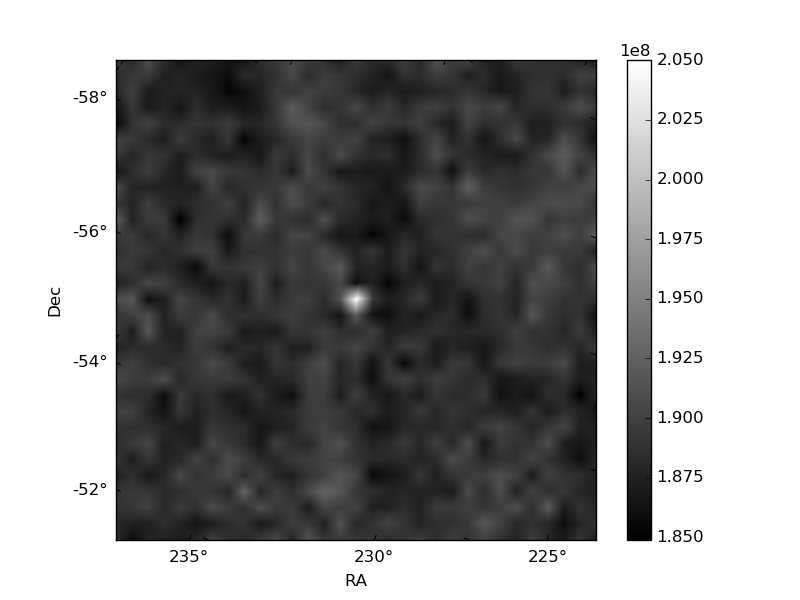
Histogram calculated using DETX and DETY for each event in the final _common_clean file
| Quadrant A | 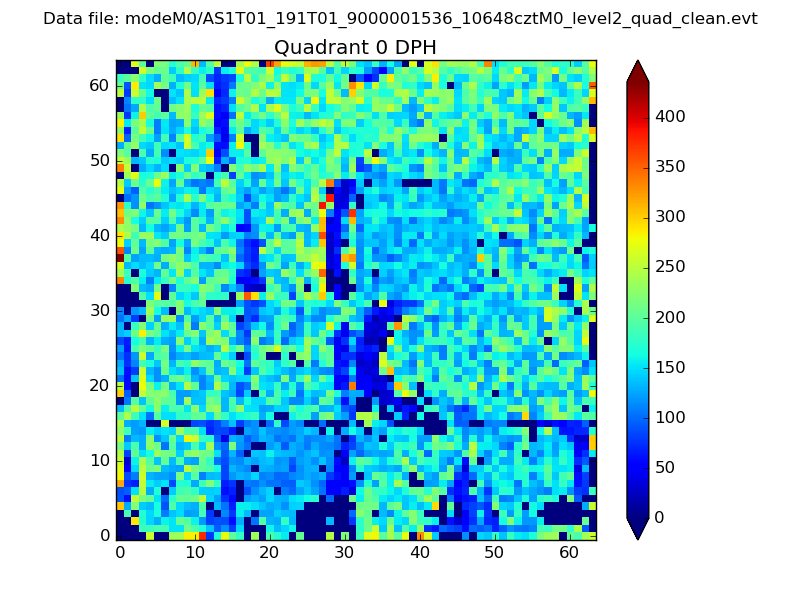 |
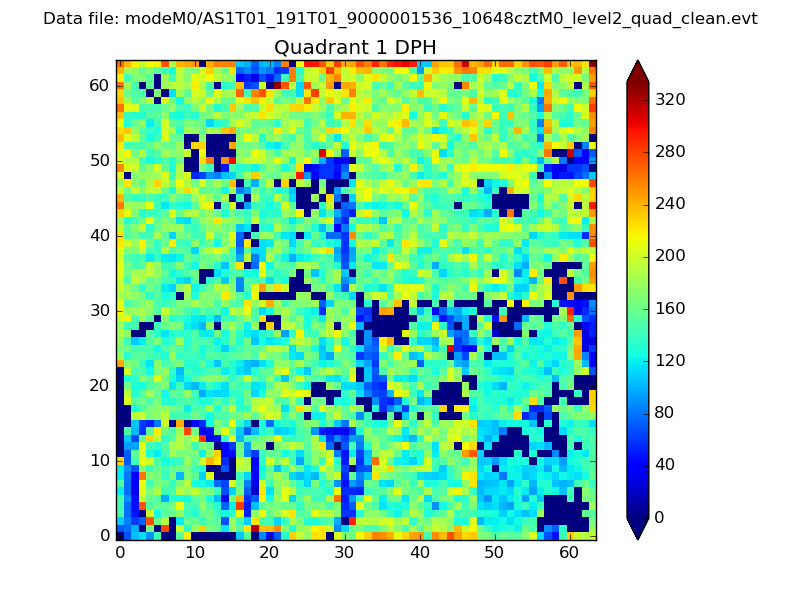 |
Quadrant B |
|---|---|---|---|
| Quadrant D | 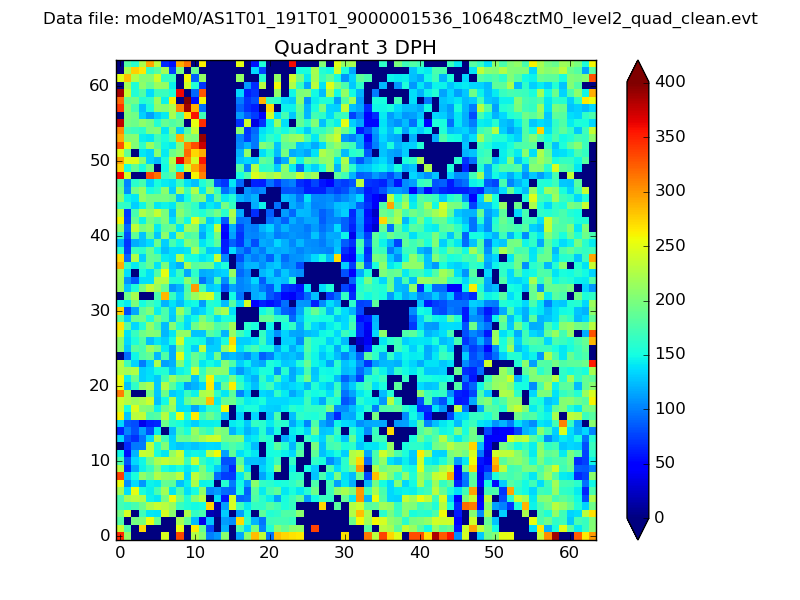 |
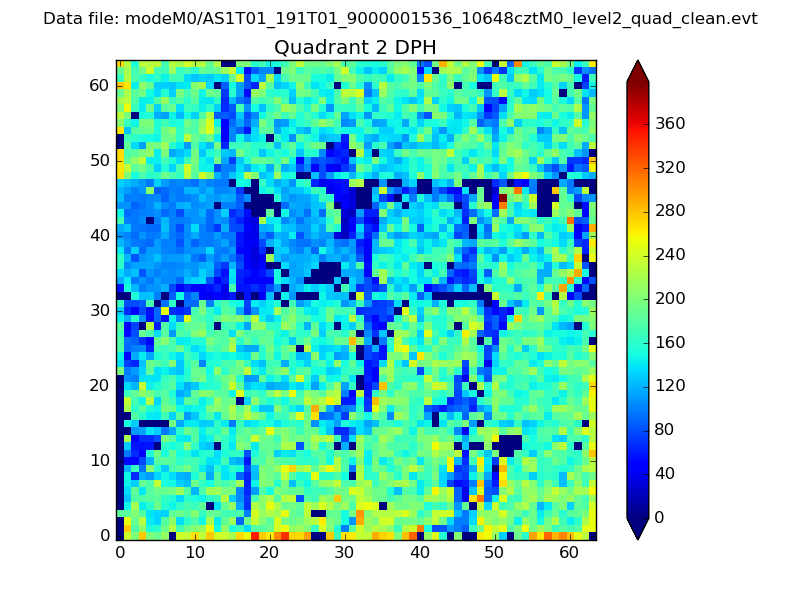 |
Quadrant C |
| Plot type | Count rate plots | Images |
|---|---|---|
| Comparison with Poisson distribution Blue bars denote a histogram of data divided into 1 sec bins. Red curve is a Poisson curve with rate = median count rate of data. |
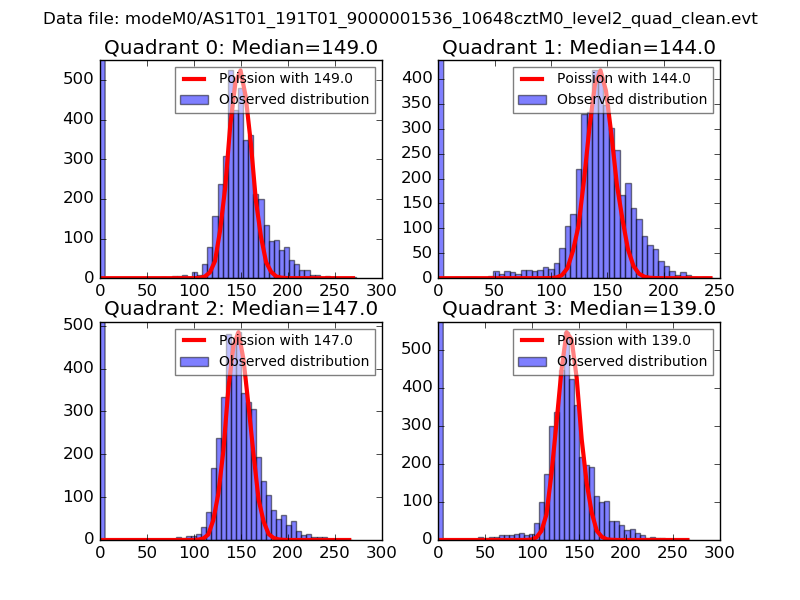 |
 |
| Quadrant-wise count rates Data is divided into 100 sec bins |
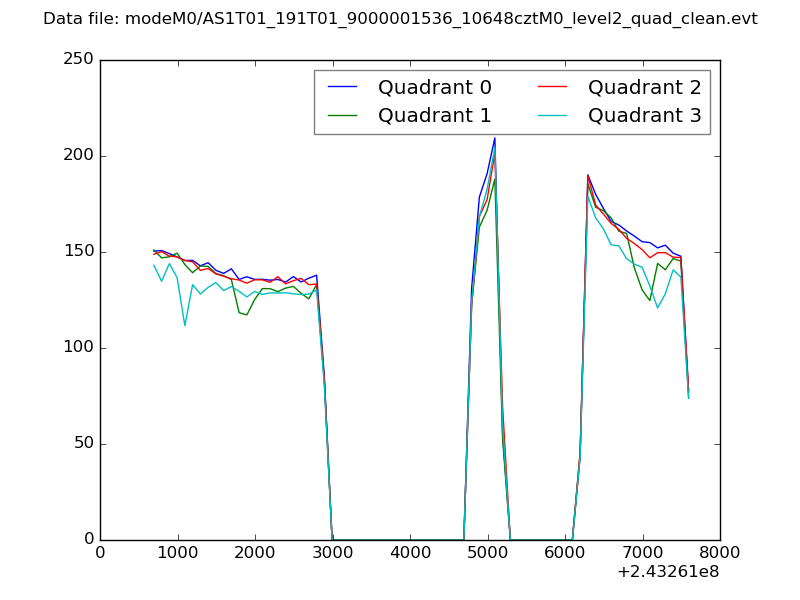 |
|
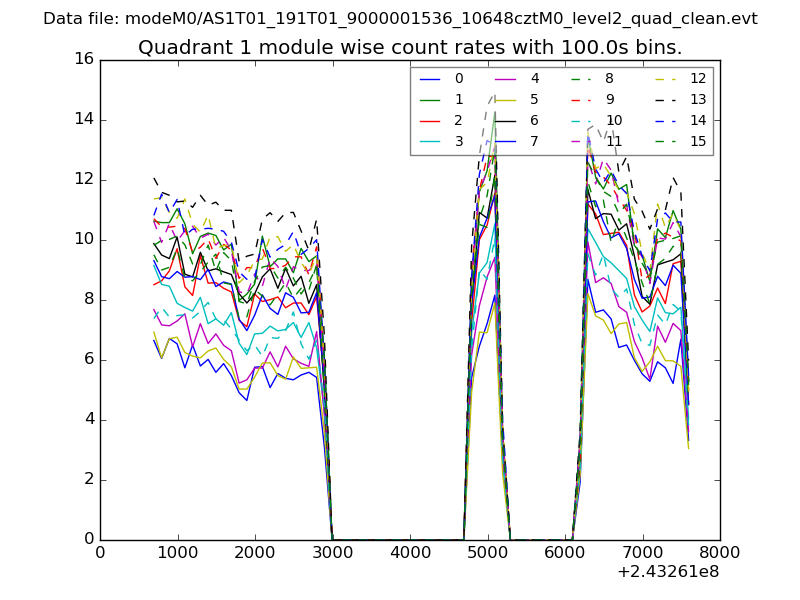
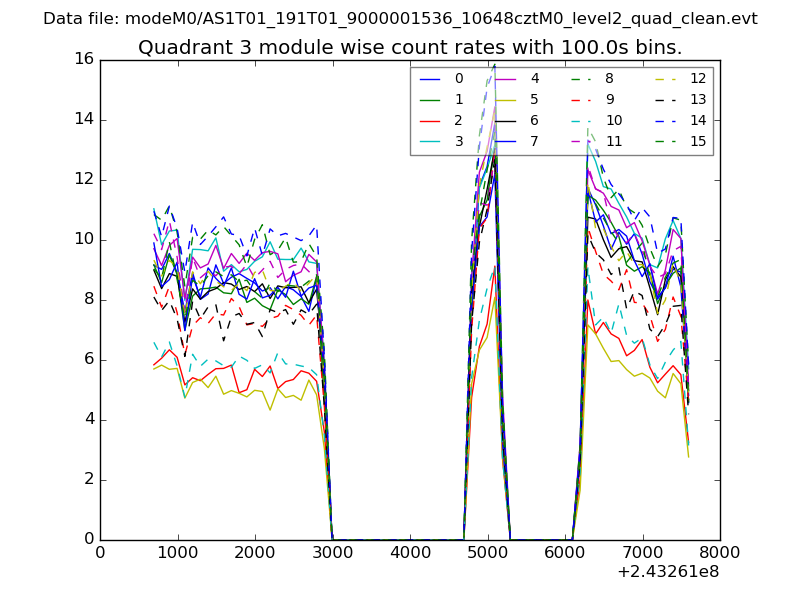
| Module-wise count rates for Quadrant A Data is divided into 100 sec bins |
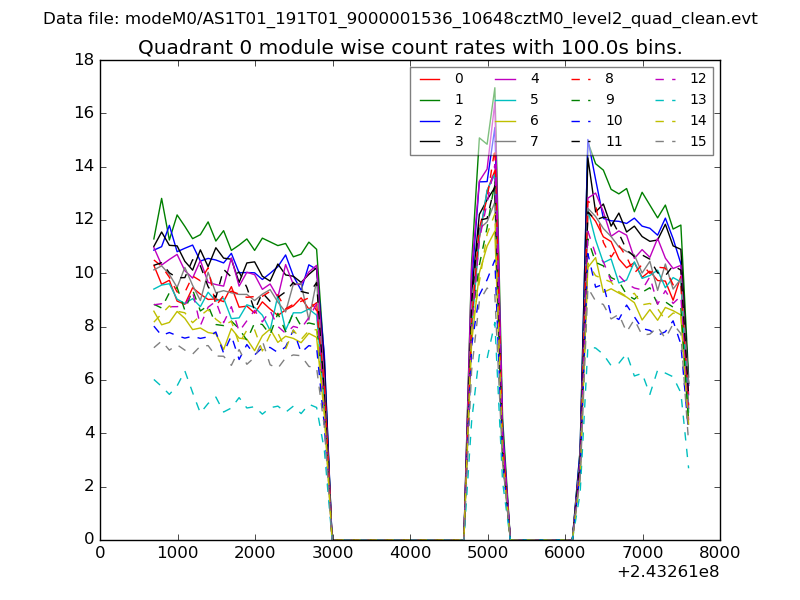 |
 |
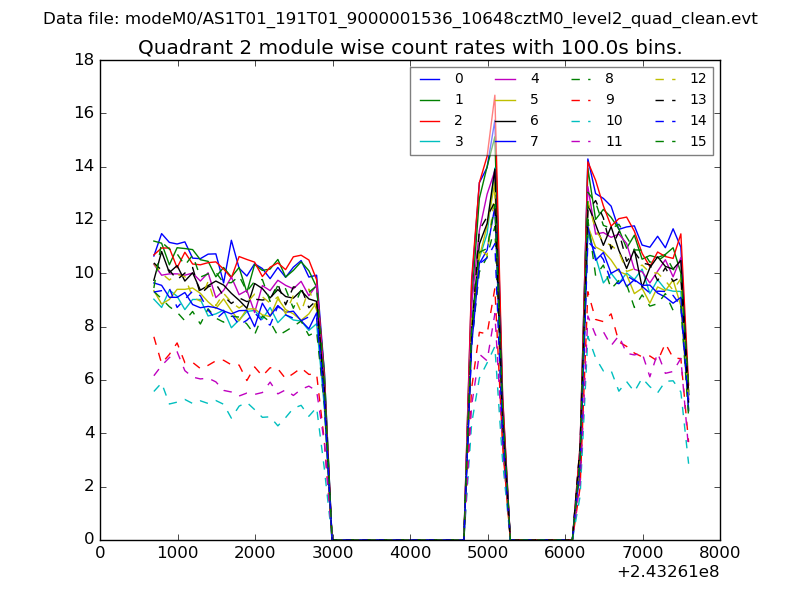
| Module-wise count rates for Quadrant B Data is divided into 100 sec bins |
 |
 |
| Module-wise count rates for Quadrant C Data is divided into 100 sec bins |
 |
 |
| Module-wise count rates for Quadrant D Data is divided into 100 sec bins |
 |
 |
| Parameter | Plot |
|---|---|
| CZT HV Monitor | 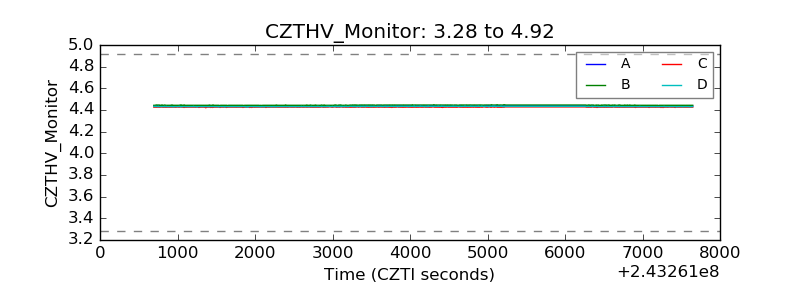 |
| D_VDD | 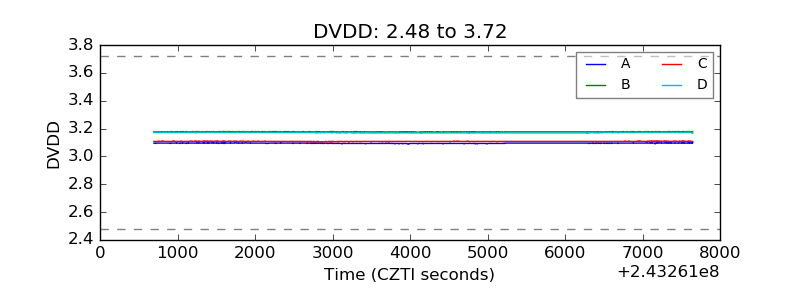 |
| Temperature 1 | 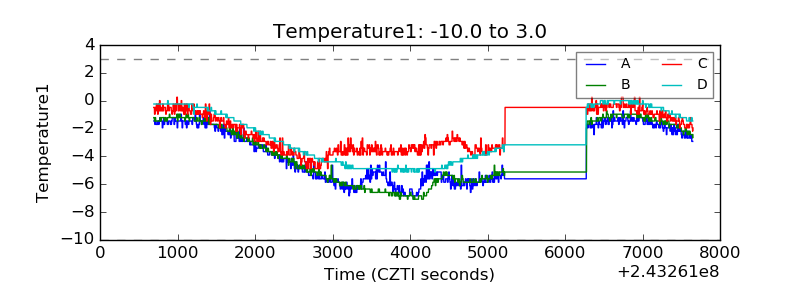 |
| Veto HV Monitor |  |
| Veto LLD | 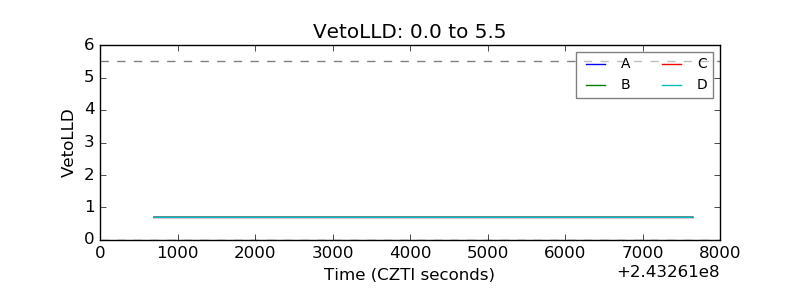 |
| Alpha Counter | 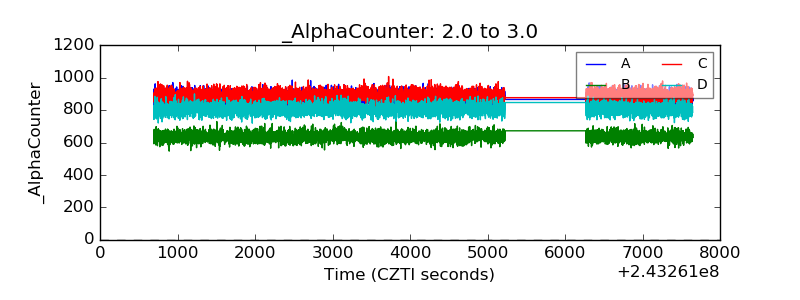 |
| _CPM_Rate | 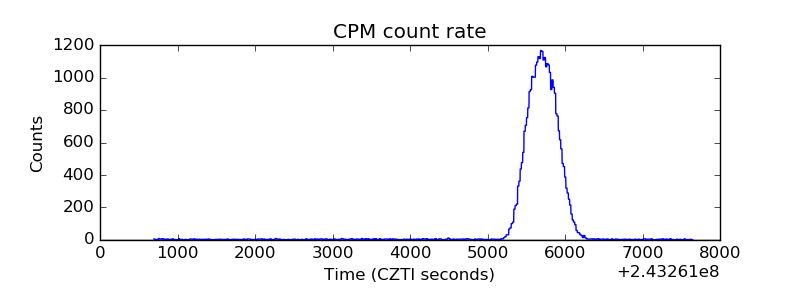 |
| CZT Counter | 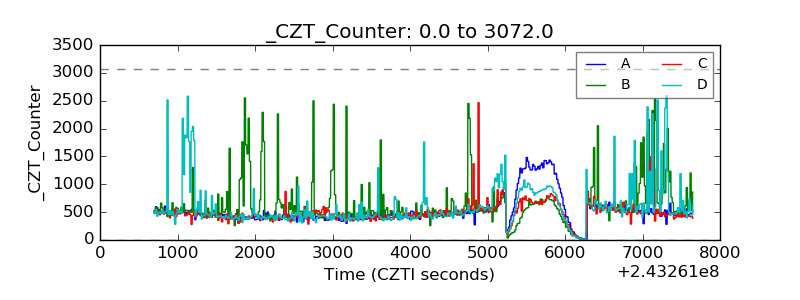 |
| +2.5 Volts monitor |  |
| +5 Volts monitor |  |
| _ROLL_ROT | 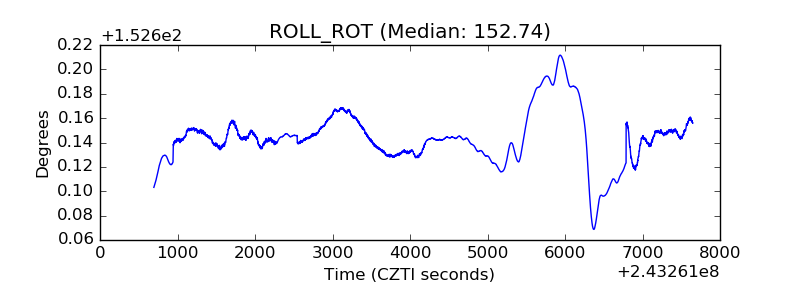 |
| _Roll_DEC | 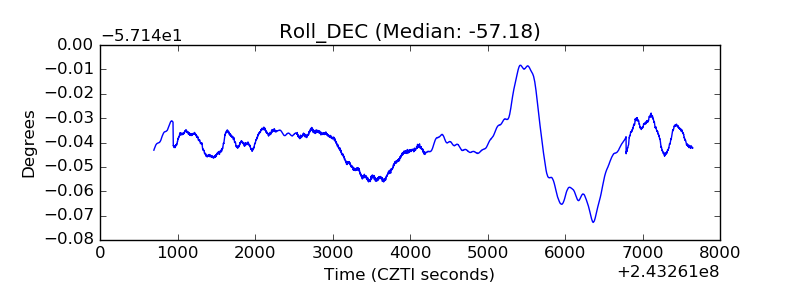 |
| _Roll_RA | 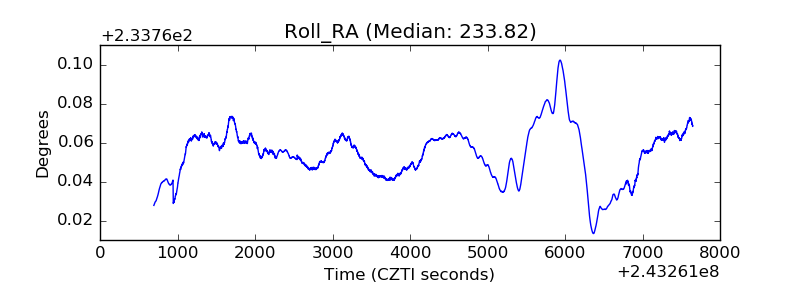 |
| Veto Counter | 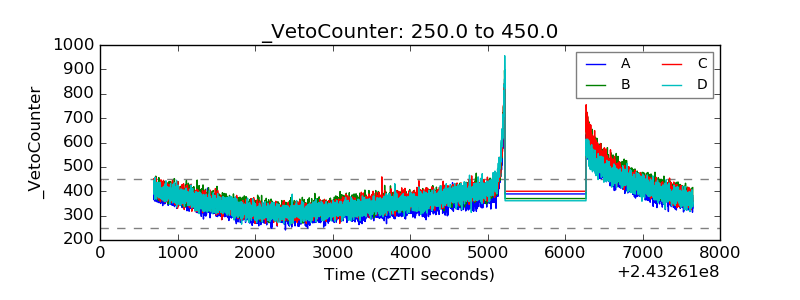 |