| Param | Original file | Final file |
|---|---|---|
| Filename | modeM0/AS1T01_191T01_9000001536_10651cztM0_level2.evt | modeM0/AS1T01_191T01_9000001536_10651cztM0_level2_quad_clean.evt |
| Size (bytes) | 458,236,800 | 82,961,280 |
| Size | 437.0 MB | 79.1 MB |
| Events in quadrant A | 2,698,755 | 564,153 |
| Events in quadrant B | 4,498,745 | 536,045 |
| Events in quadrant C | 2,539,917 | 558,133 |
| Events in quadrant D | 3,772,735 | 475,024 |
| Mode SS | |||
|---|---|---|---|
| Quadrant | BADHDUFLAG | Total packets | Discarded packets |
| A | 0 | 112 | 0 |
| B | 0 | 112 | 0 |
| C | 0 | 112 | 0 |
| D | 0 | 112 | 0 |
| Mode M9 | |||
|---|---|---|---|
| Quadrant | BADHDUFLAG | Total packets | Discarded packets |
| A | 0 | 12 | 0 |
| B | 0 | 12 | 0 |
| C | 0 | 12 | 0 |
| D | 0 | 12 | 0 |
| Mode M0 | |||
|---|---|---|---|
| Quadrant | BADHDUFLAG | Total packets | Discarded packets |
| A | 0 | 11589 | 2 |
| B | 0 | 16995 | 1 |
| C | 0 | 11183 | 1 |
| D | 0 | 14853 | 1 |
| Quadrant | Total seconds | Saturated seconds | Saturation percentage |
|---|---|---|---|
| A | 5401 | 35 | 0.648028% |
| B | 5401 | 582 | 10.775782% |
| C | 5401 | 5 | 0.092575% |
| D | 5401 | 439 | 8.128124% |
Noise dominated data is calculated using 1-second bins in cleaned event files. If a bin has >2000 counts, and if more than 50% of those come from <1% of pixels, then it is considered to be noise-dominated and hence unusable.
| Quadrant | # 1 sec bins | Bins with >0 counts | Bins with >2000 counts | High rate bins dominated by noise | Noise dominated (total time) | Noise dominated (detector-on time) | Marked lightcurve |
|---|---|---|---|---|---|---|---|
| A | 6681 | 5402 | 12 | 12 | 0.18% | 0.22% | 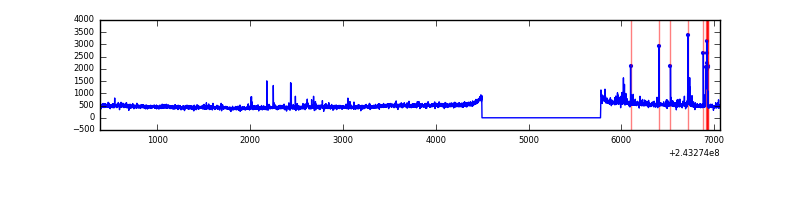 |
| B | 6681 | 5402 | 411 | 411 | 6.15% | 7.61% | 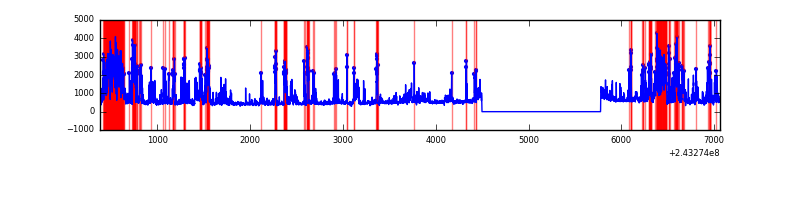 |
| C | 6681 | 5402 | 0 | 0 | 0.00% | 0.00% | 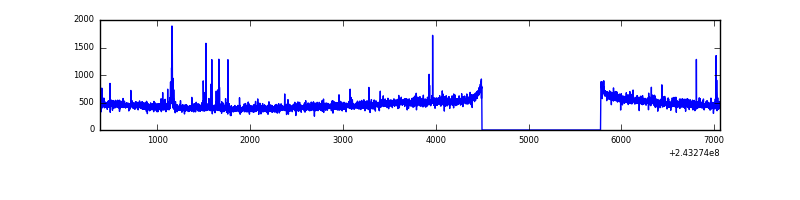 |
| D | 6681 | 5402 | 417 | 417 | 6.24% | 7.72% | 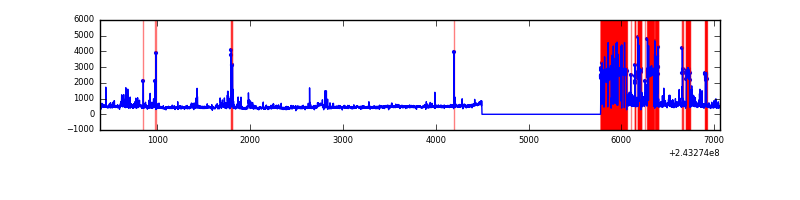 |
Top three noisy pixels from each quadrant. If the there are fewer than three noisy pixels in the level2.evt file, extra rows are filled as -1
| Pixel properties | Quadrant properties | ||||||
|---|---|---|---|---|---|---|---|
| Quadrant | DetID | PixID | Counts | Sigma | Mean | Median | Sigma |
| A | 15 | 223 | 47721 | 343.51 | 664 | 653 | 137.0 |
| A | 15 | 239 | 27445 | 195.53 | 664 | 653 | 137.0 |
| A | 1 | 162 | 14825 | 103.43 | 664 | 653 | 137.0 |
| B | 4 | 239 | 1860292 | 14985.32 | 646 | 635 | 124.1 |
| B | 6 | 51 | 58059 | 462.73 | 646 | 635 | 124.1 |
| B | 0 | 219 | 34768 | 275.05 | 646 | 635 | 124.1 |
| C | 4 | 254 | 27402 | 181.69 | 635 | 642 | 147.3 |
| C | 14 | 234 | 22206 | 146.41 | 635 | 642 | 147.3 |
| C | 4 | 175 | 9032 | 56.96 | 635 | 642 | 147.3 |
| D | 1 | 20 | 1165409 | 7963.73 | 594 | 579 | 146.3 |
| D | 2 | 16 | 154784 | 1054.27 | 594 | 579 | 146.3 |
| D | 13 | 104 | 68801 | 466.42 | 594 | 579 | 146.3 |
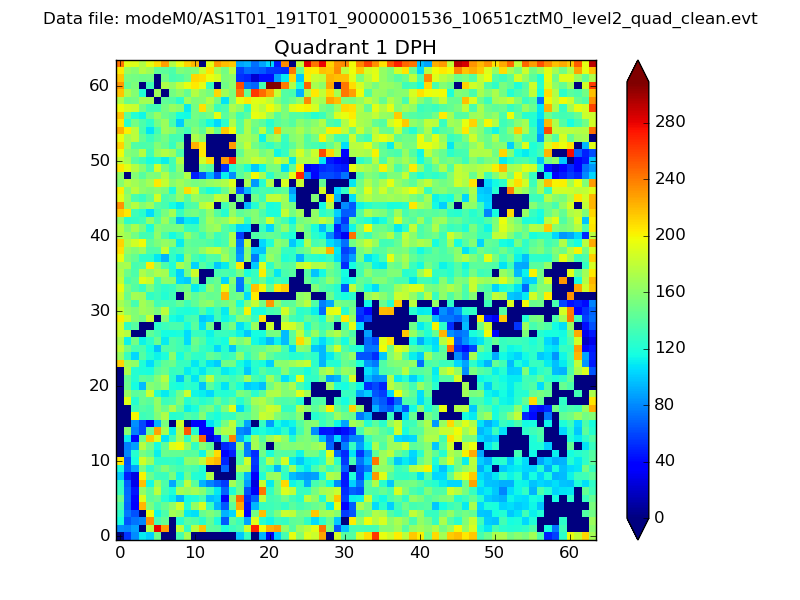
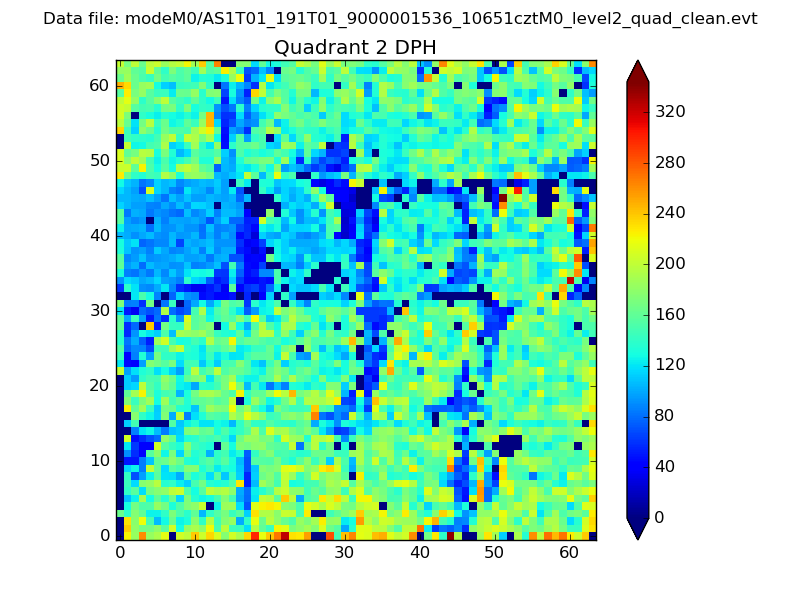
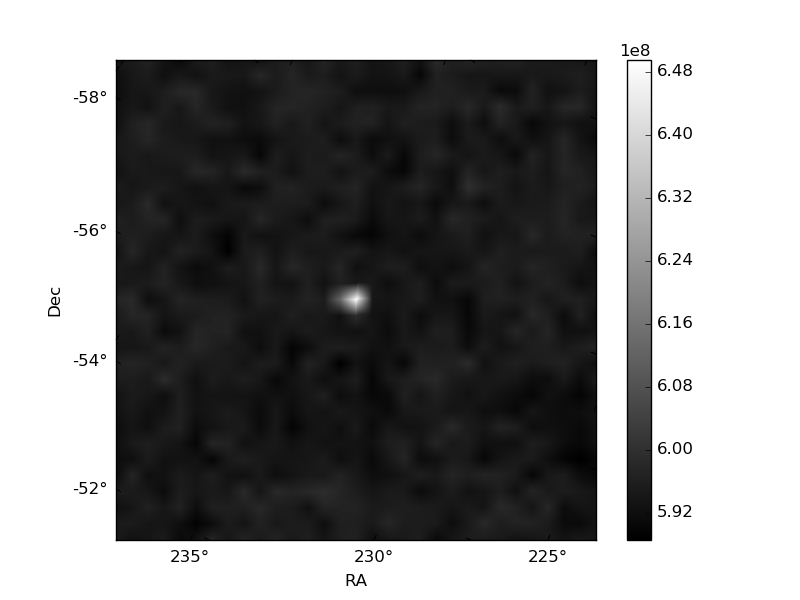
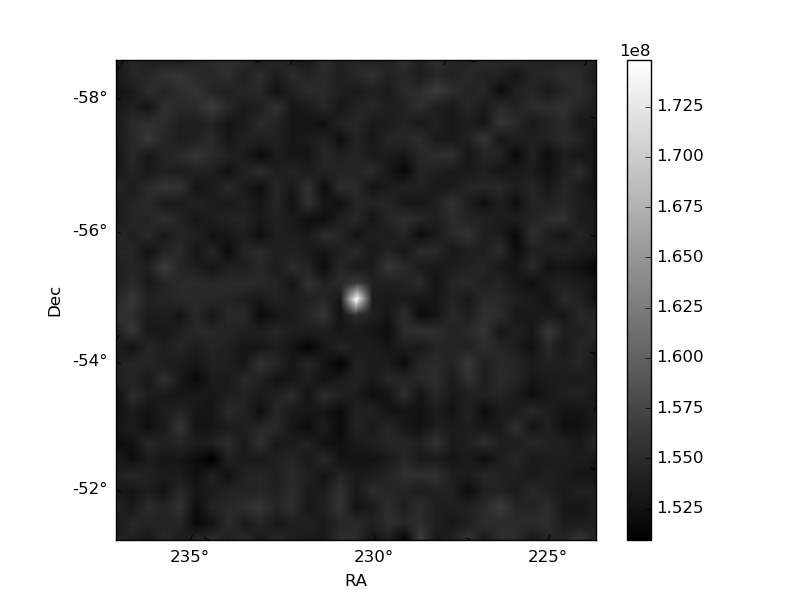
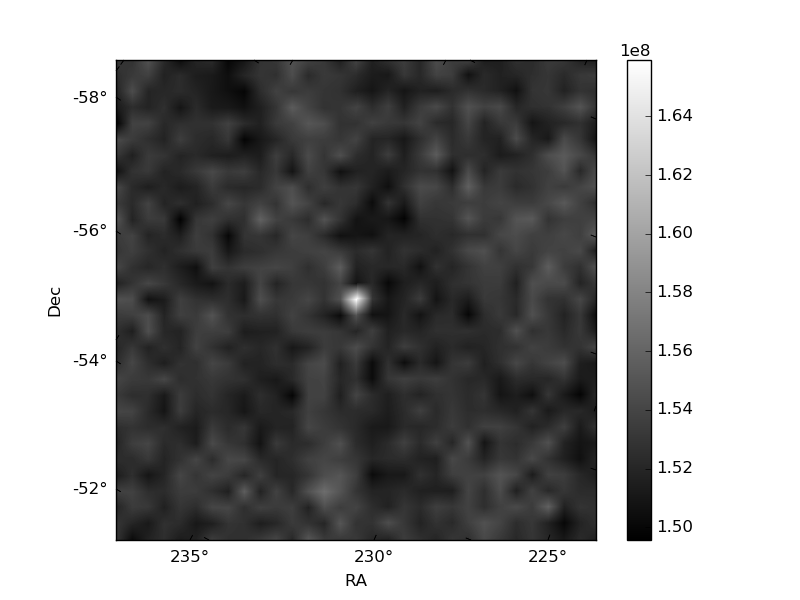
Histogram calculated using DETX and DETY for each event in the final _common_clean file
| Quadrant A |  |
 |
Quadrant B |
|---|---|---|---|
| Quadrant D | 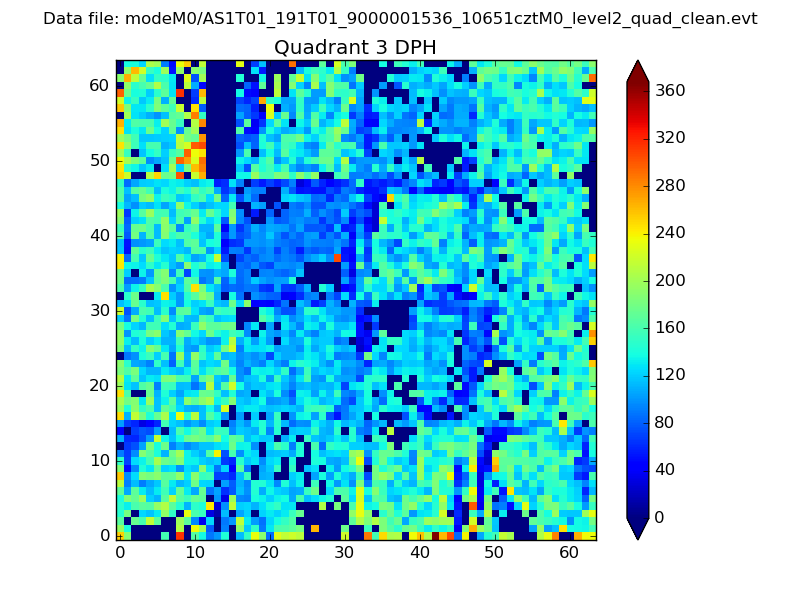 |
 |
Quadrant C |
| Plot type | Count rate plots | Images |
|---|---|---|
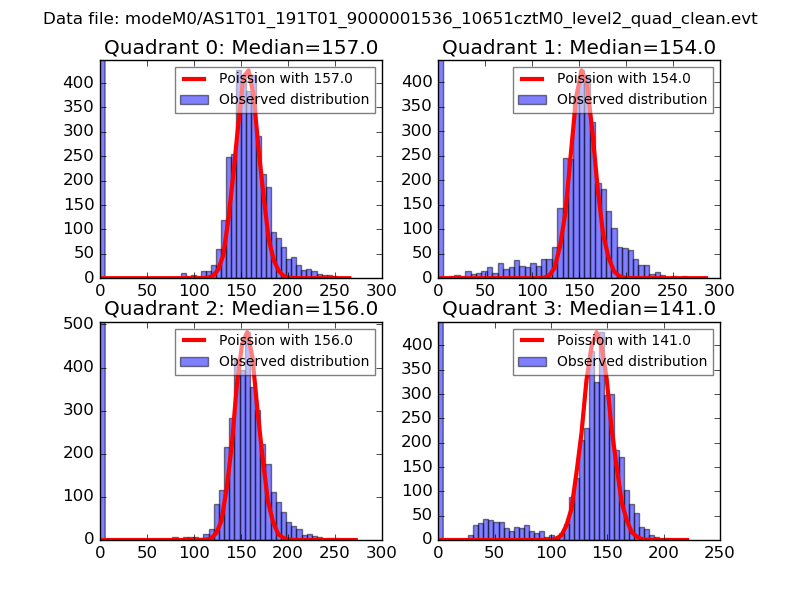
| Comparison with Poisson distribution Blue bars denote a histogram of data divided into 1 sec bins. Red curve is a Poisson curve with rate = median count rate of data. |
 |
 |
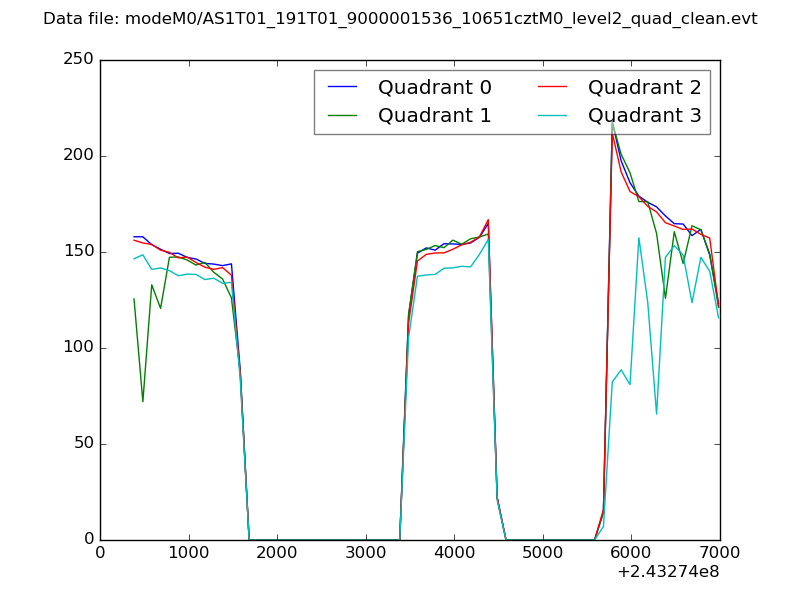
| Quadrant-wise count rates Data is divided into 100 sec bins |
 |
|
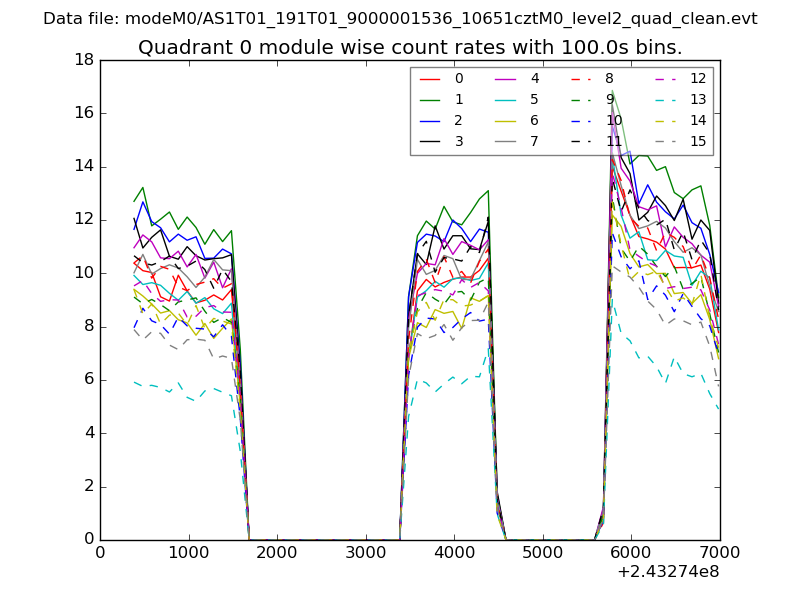
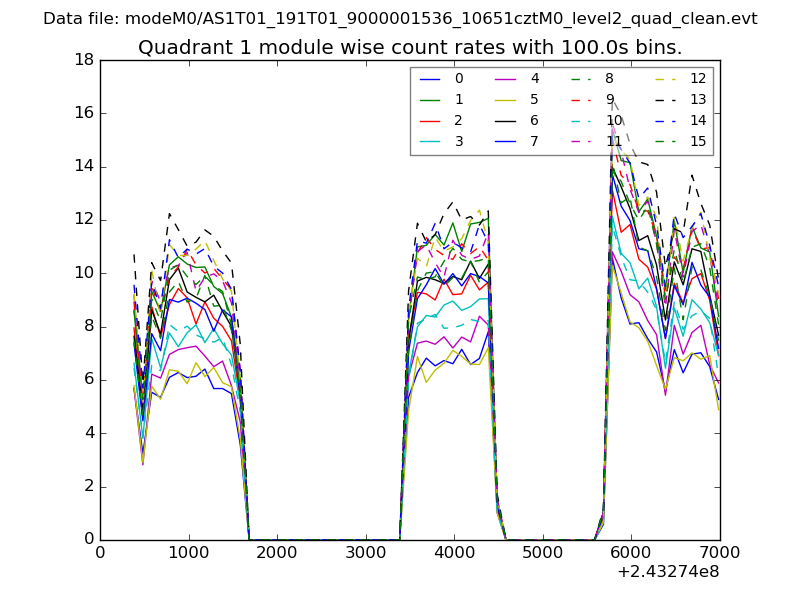
| Module-wise count rates for Quadrant A Data is divided into 100 sec bins |
 |
 |
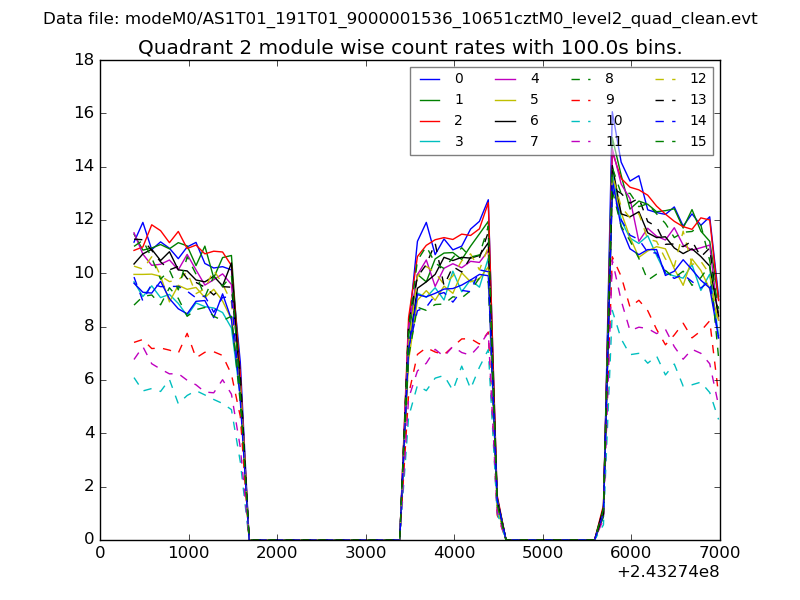
| Module-wise count rates for Quadrant B Data is divided into 100 sec bins |
 |
 |
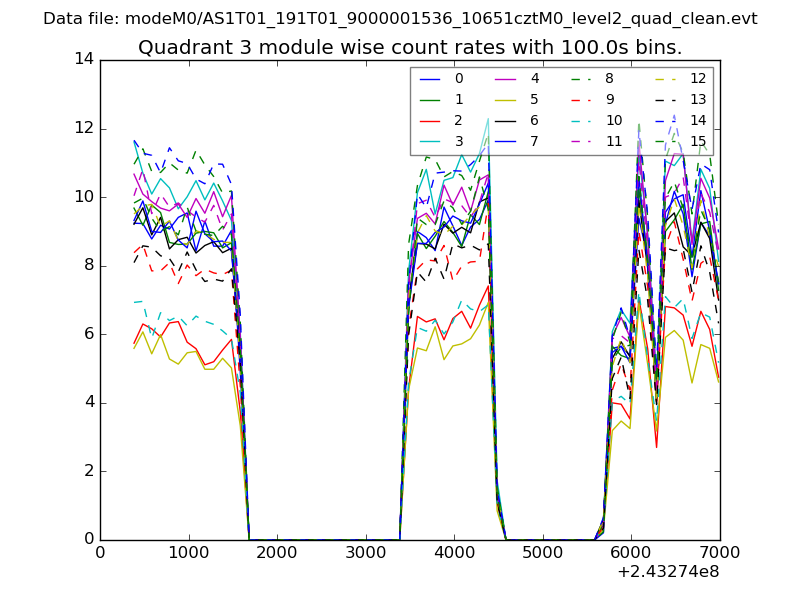
| Module-wise count rates for Quadrant C Data is divided into 100 sec bins |
 |
 |
| Module-wise count rates for Quadrant D Data is divided into 100 sec bins |
 |
 |
| Parameter | Plot |
|---|---|
| CZT HV Monitor | 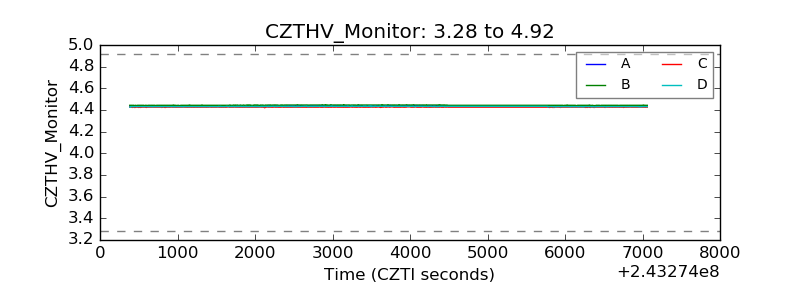 |
| D_VDD | 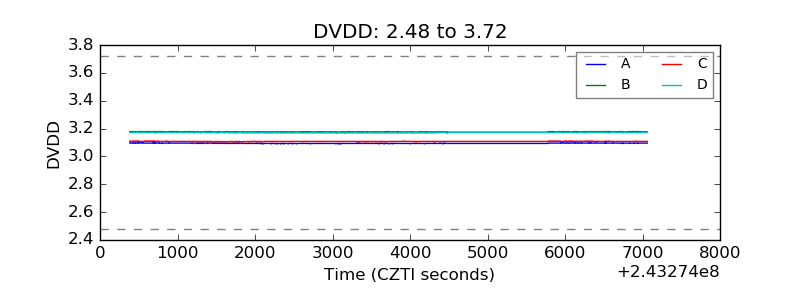 |
| Temperature 1 | 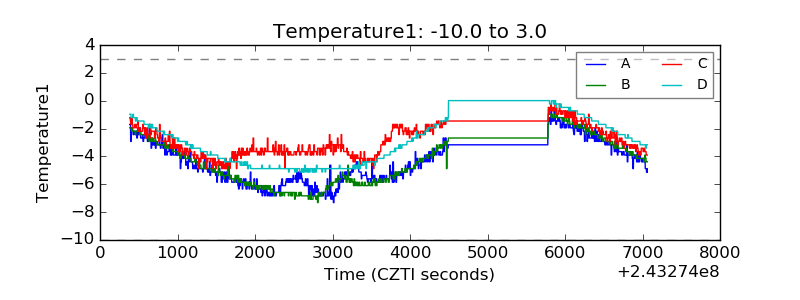 |
| Veto HV Monitor | 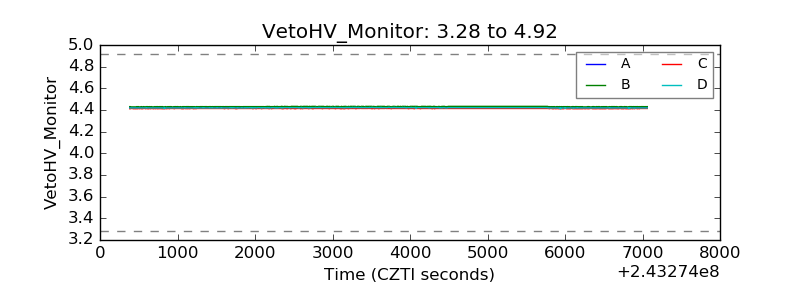 |
| Veto LLD | 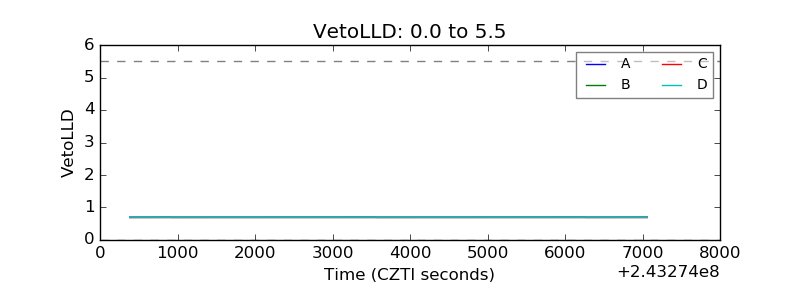 |
| Alpha Counter | 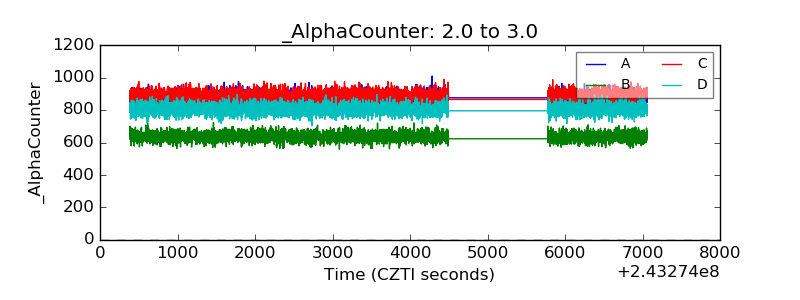 |
| _CPM_Rate | 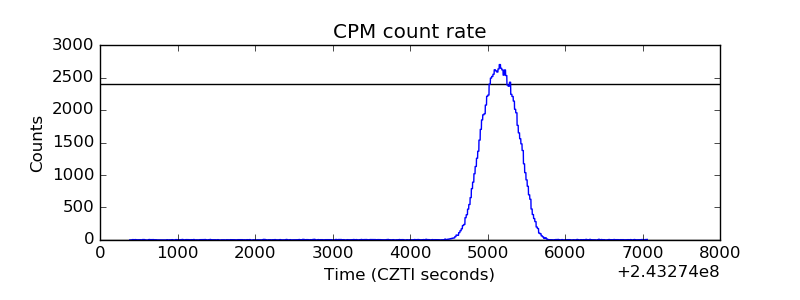 |
| CZT Counter | 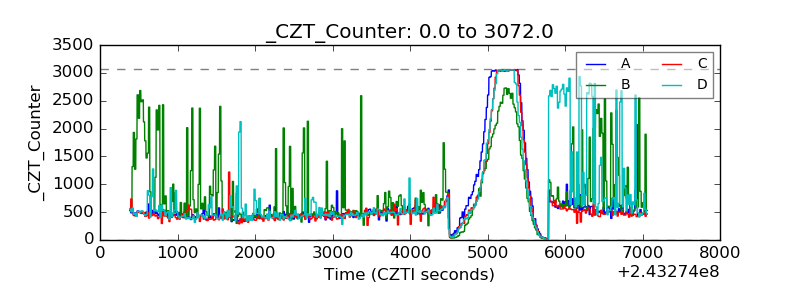 |
| +2.5 Volts monitor | 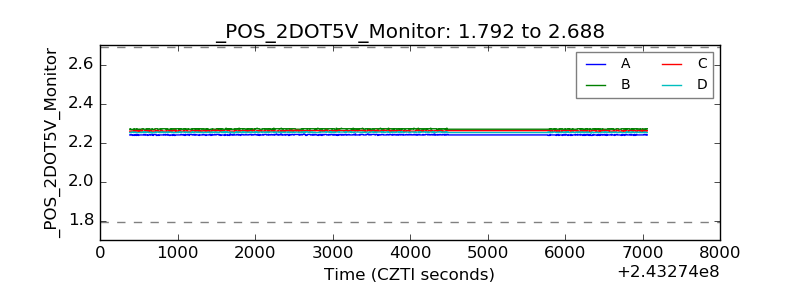 |
| +5 Volts monitor | 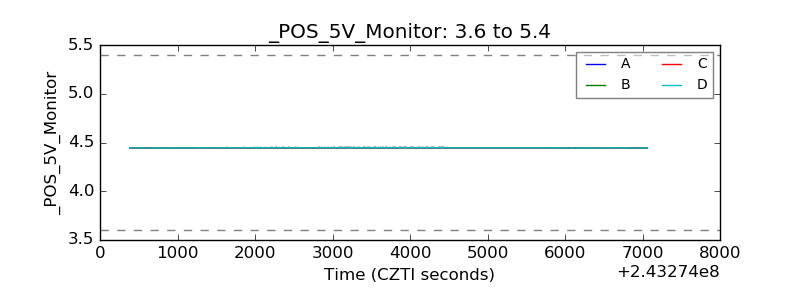 |
| _ROLL_ROT | 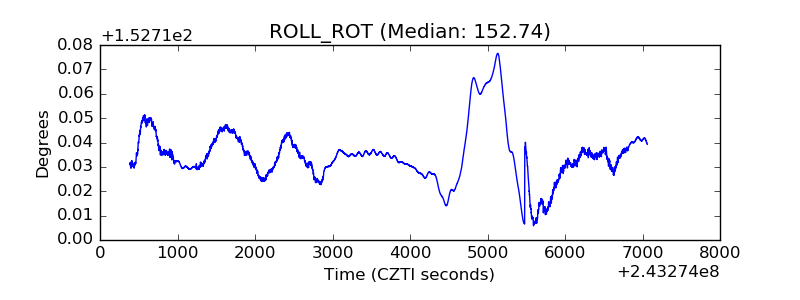 |
| _Roll_DEC | 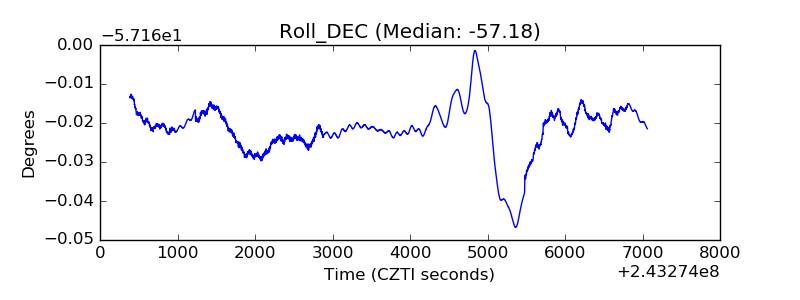 |
| _Roll_RA | 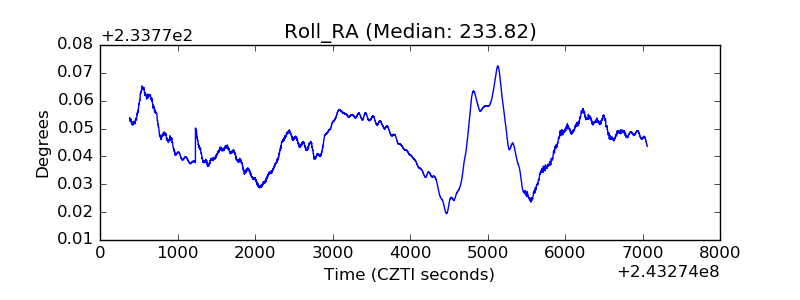 |
| Veto Counter | 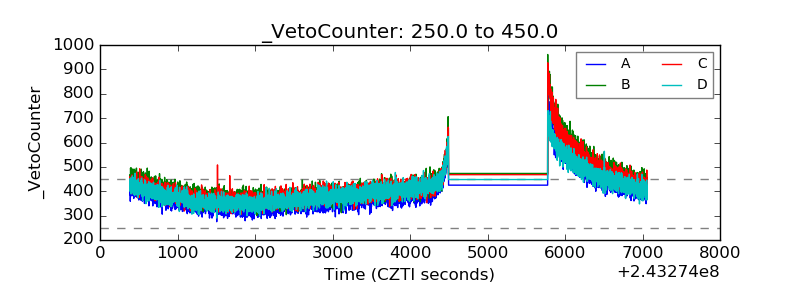 |