| Param | Original file | Final file |
|---|---|---|
| Filename | modeM0/AS1T01_191T01_9000001536_10652cztM0_level2.evt | modeM0/AS1T01_191T01_9000001536_10652cztM0_level2_quad_clean.evt |
| Size (bytes) | 515,401,920 | 93,859,200 |
| Size | 491.5 MB | 89.5 MB |
| Events in quadrant A | 3,087,142 | 633,013 |
| Events in quadrant B | 4,632,162 | 619,813 |
| Events in quadrant C | 2,775,628 | 632,957 |
| Events in quadrant D | 4,723,200 | 553,396 |
| Mode SS | |||
|---|---|---|---|
| Quadrant | BADHDUFLAG | Total packets | Discarded packets |
| A | 0 | 116 | 0 |
| B | 0 | 116 | 0 |
| C | 0 | 116 | 0 |
| D | 0 | 116 | 0 |
| Mode M9 | |||
|---|---|---|---|
| Quadrant | BADHDUFLAG | Total packets | Discarded packets |
| A | 0 | 14 | 0 |
| B | 0 | 14 | 0 |
| C | 0 | 14 | 0 |
| D | 0 | 14 | 0 |
| Mode M0 | |||
|---|---|---|---|
| Quadrant | BADHDUFLAG | Total packets | Discarded packets |
| A | 0 | 12888 | 2 |
| B | 0 | 17526 | 1 |
| C | 0 | 12015 | 1 |
| D | 0 | 17985 | 1 |
| Quadrant | Total seconds | Saturated seconds | Saturation percentage |
|---|---|---|---|
| A | 5769 | 108 | 1.872075% |
| B | 5769 | 496 | 8.597677% |
| C | 5769 | 10 | 0.173340% |
| D | 5769 | 456 | 7.904316% |
Noise dominated data is calculated using 1-second bins in cleaned event files. If a bin has >2000 counts, and if more than 50% of those come from <1% of pixels, then it is considered to be noise-dominated and hence unusable.
| Quadrant | # 1 sec bins | Bins with >0 counts | Bins with >2000 counts | High rate bins dominated by noise | Noise dominated (total time) | Noise dominated (detector-on time) | Marked lightcurve |
|---|---|---|---|---|---|---|---|
| A | 7104 | 5770 | 42 | 42 | 0.59% | 0.73% | 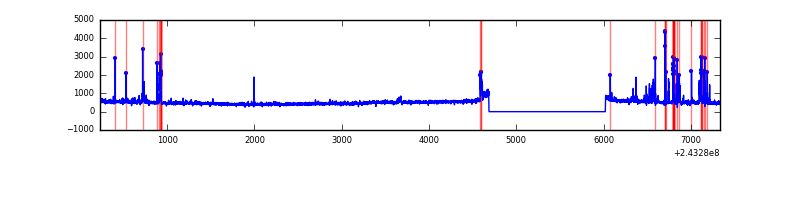 |
| B | 7104 | 5770 | 325 | 325 | 4.57% | 5.63% | 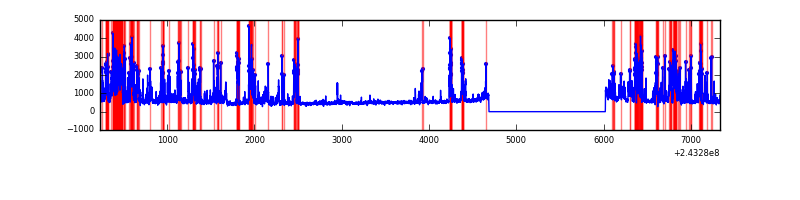 |
| C | 7104 | 5770 | 2 | 2 | 0.03% | 0.03% | 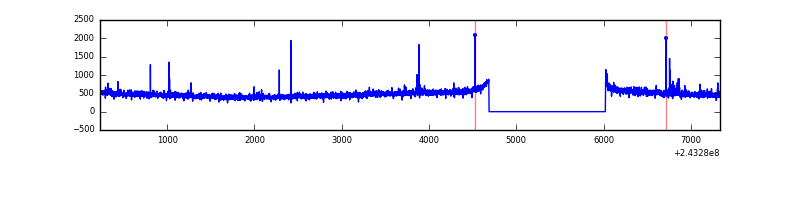 |
| D | 7104 | 5770 | 450 | 450 | 6.33% | 7.80% | 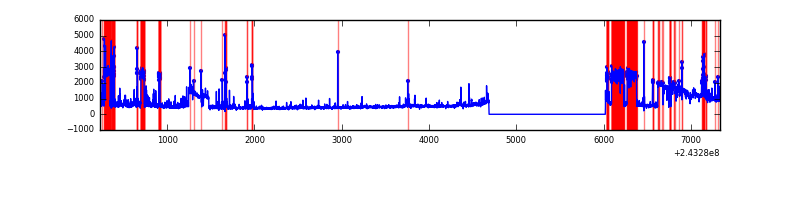 |
Top three noisy pixels from each quadrant. If the there are fewer than three noisy pixels in the level2.evt file, extra rows are filled as -1
| Pixel properties | Quadrant properties | ||||||
|---|---|---|---|---|---|---|---|
| Quadrant | DetID | PixID | Counts | Sigma | Mean | Median | Sigma |
| A | 15 | 223 | 138414 | 917.68 | 722 | 708 | 150.1 |
| A | 15 | 239 | 106109 | 702.4 | 722 | 708 | 150.1 |
| A | 15 | 255 | 16834 | 107.46 | 722 | 708 | 150.1 |
| B | 4 | 239 | 1733254 | 12776.39 | 713 | 702 | 135.6 |
| B | 0 | 219 | 75455 | 551.25 | 713 | 702 | 135.6 |
| B | 11 | 51 | 20397 | 145.24 | 713 | 702 | 135.6 |
| C | 4 | 254 | 23953 | 144.34 | 696 | 704 | 161.1 |
| C | 14 | 234 | 17308 | 103.09 | 696 | 704 | 161.1 |
| C | 4 | 175 | 16103 | 95.6 | 696 | 704 | 161.1 |
| D | 1 | 20 | 1702080 | 10504.38 | 663 | 646 | 162.0 |
| D | 2 | 16 | 208712 | 1284.57 | 663 | 646 | 162.0 |
| D | 12 | 233 | 104730 | 642.6 | 663 | 646 | 162.0 |
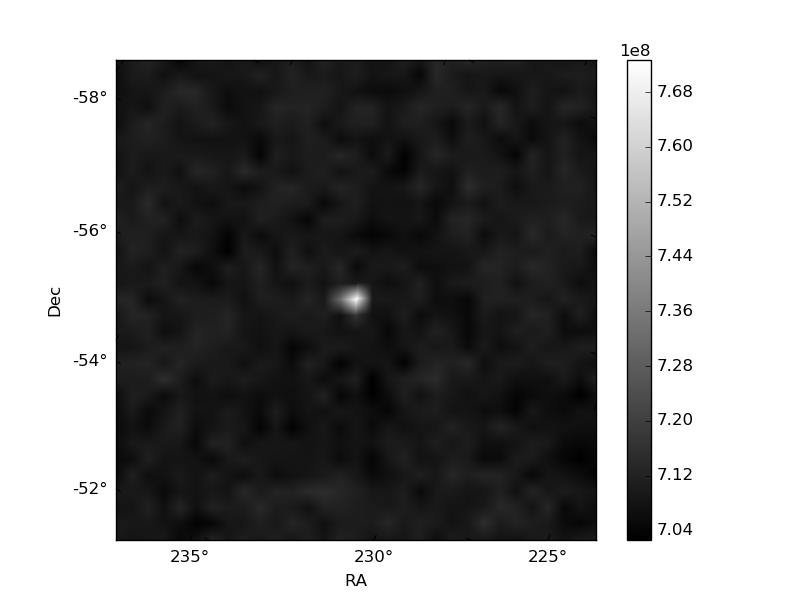
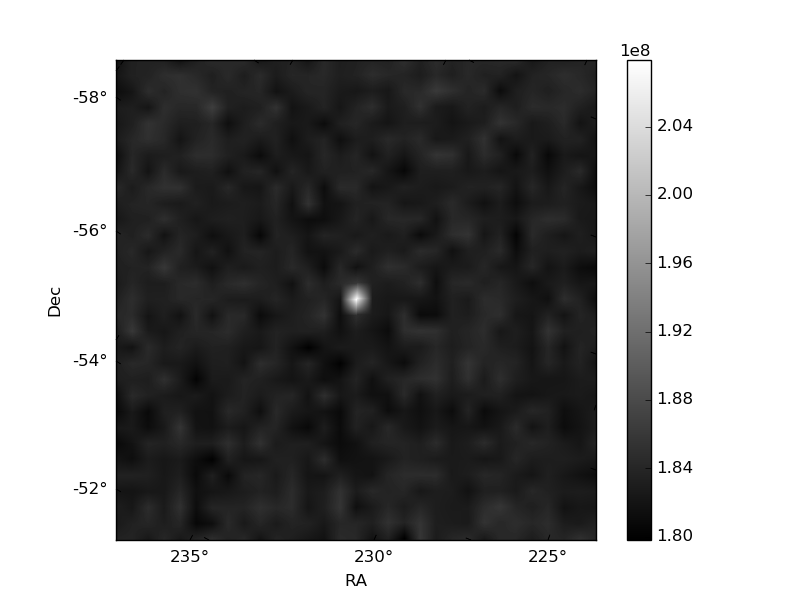
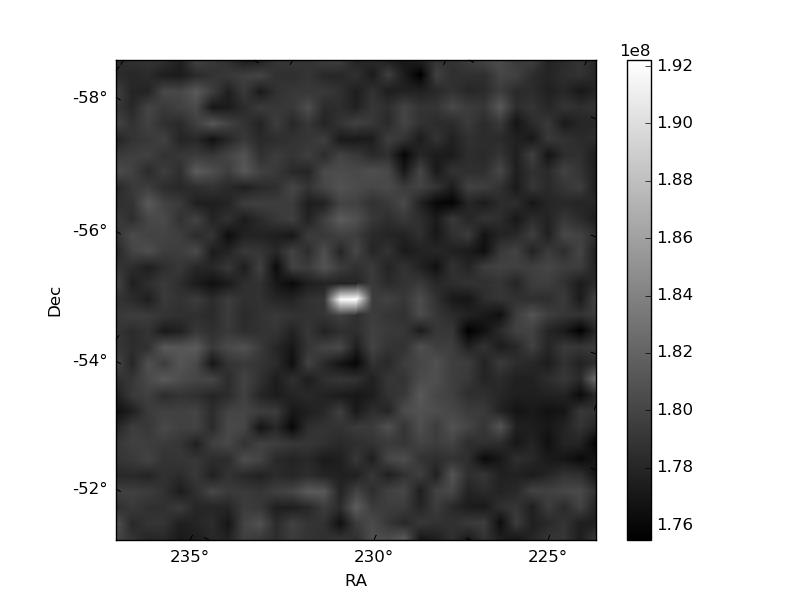
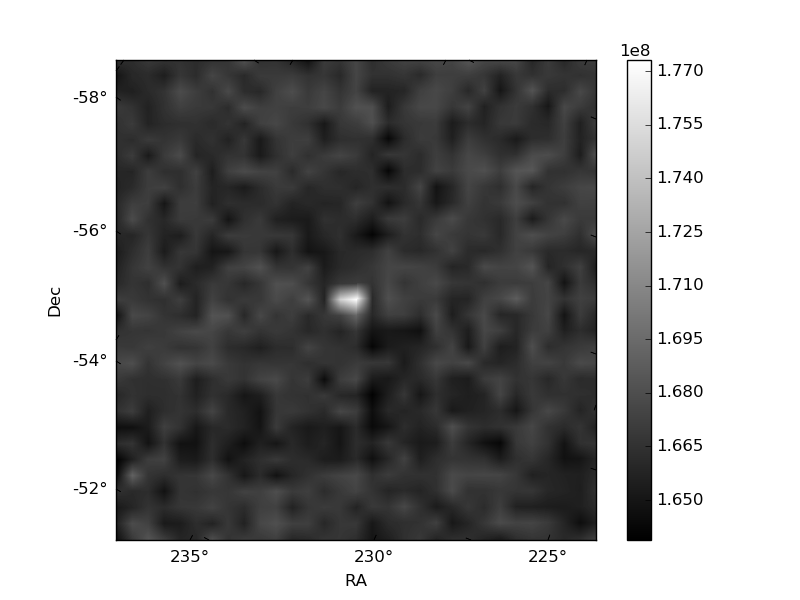
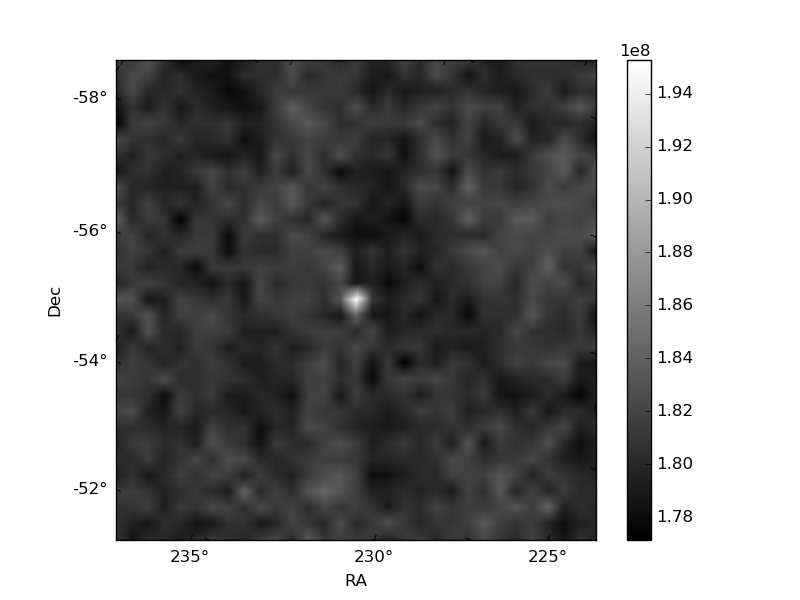
Histogram calculated using DETX and DETY for each event in the final _common_clean file
| Quadrant A | 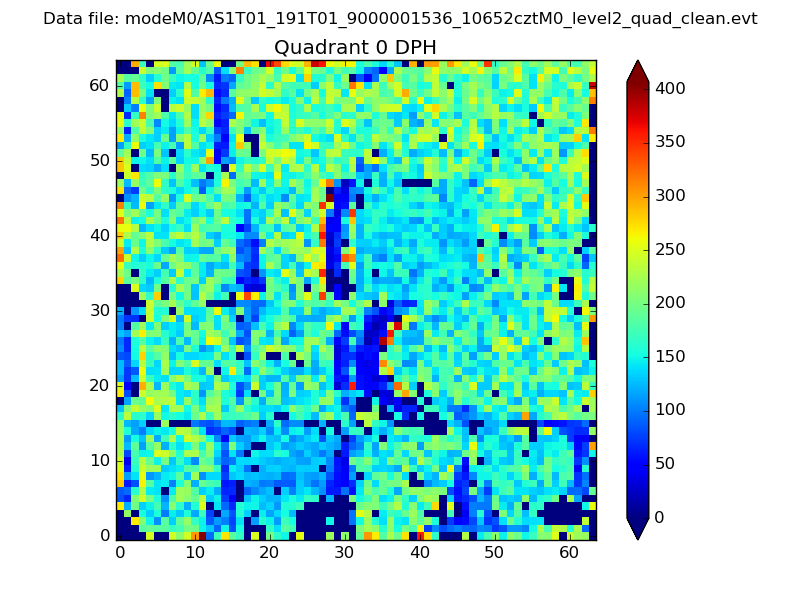 |
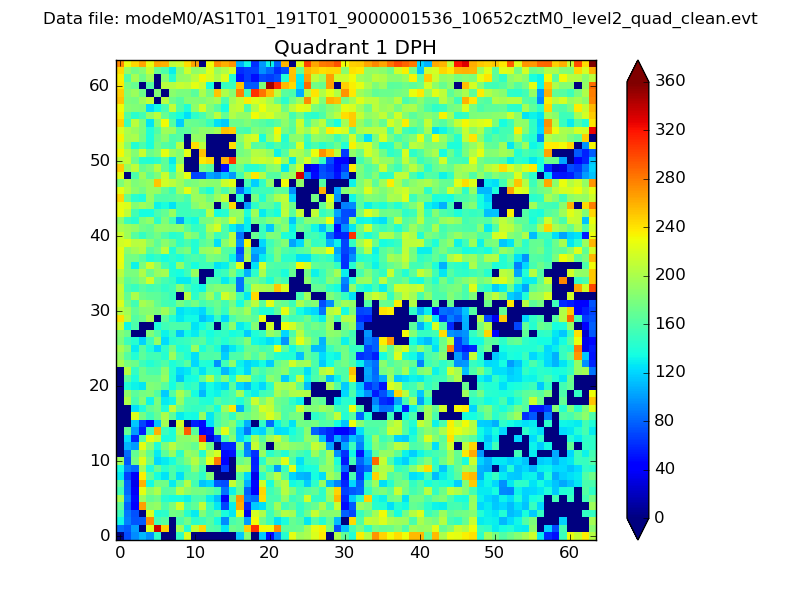 |
Quadrant B |
|---|---|---|---|
| Quadrant D | 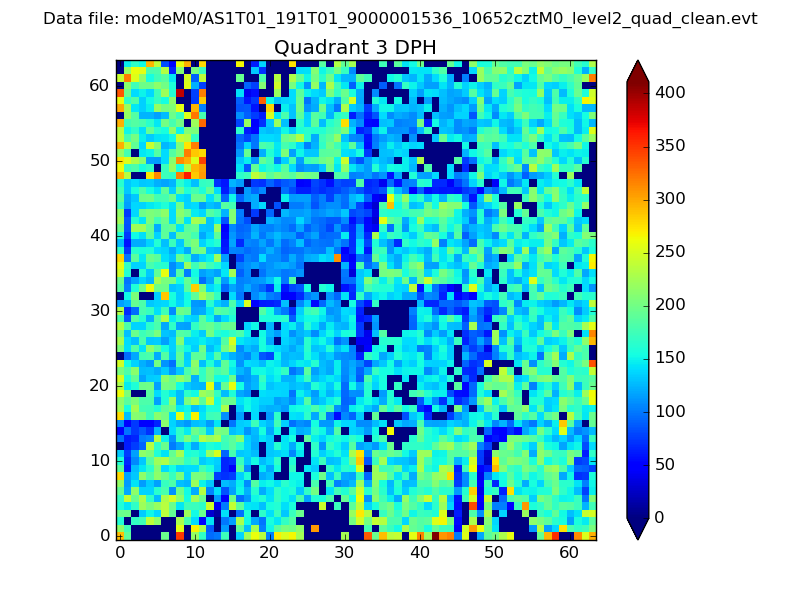 |
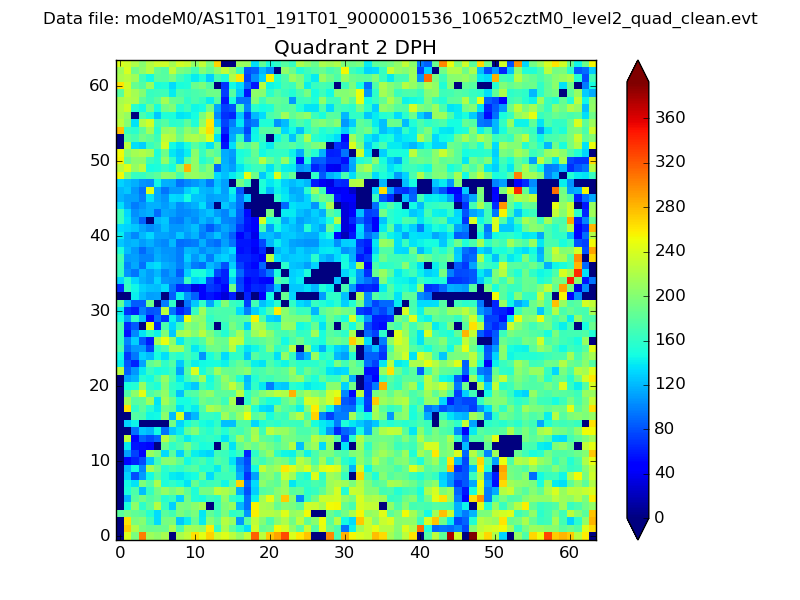 |
Quadrant C |
| Plot type | Count rate plots | Images |
|---|---|---|
| Comparison with Poisson distribution Blue bars denote a histogram of data divided into 1 sec bins. Red curve is a Poisson curve with rate = median count rate of data. |
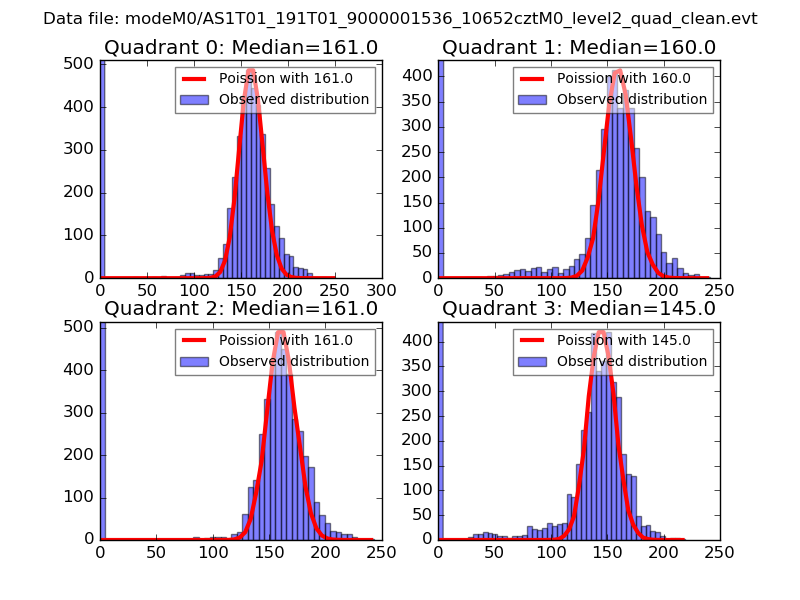 |
 |
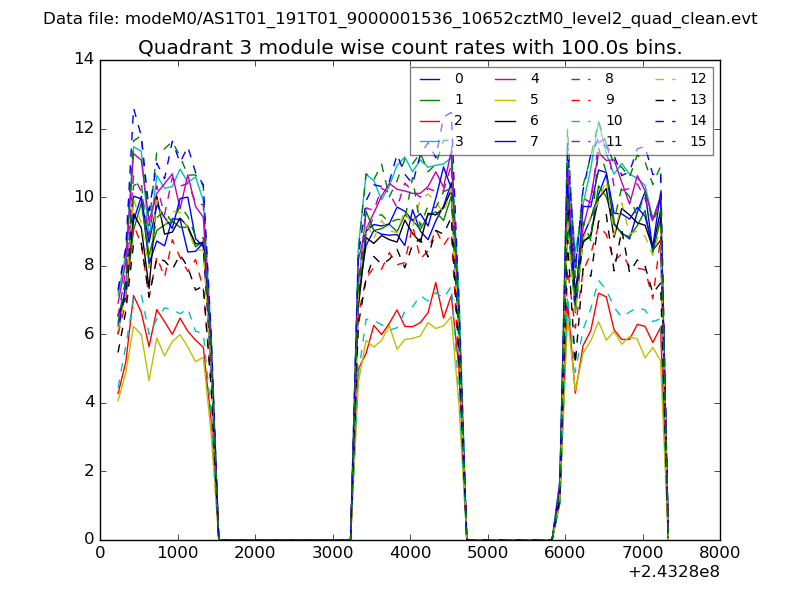
| Quadrant-wise count rates Data is divided into 100 sec bins |
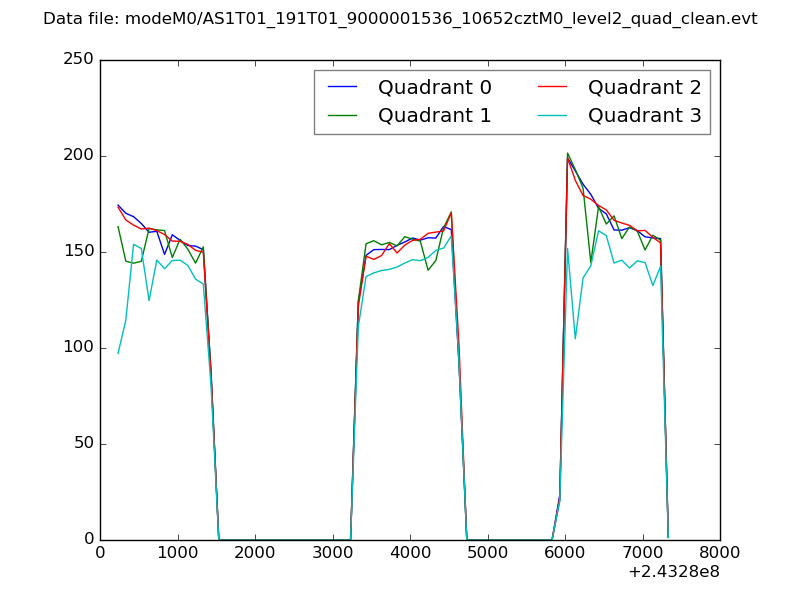 |
|
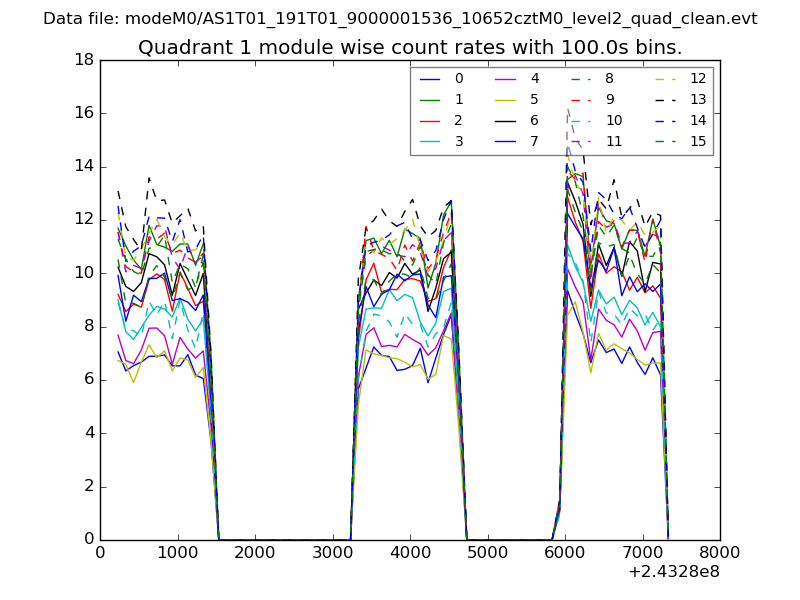
| Module-wise count rates for Quadrant A Data is divided into 100 sec bins |
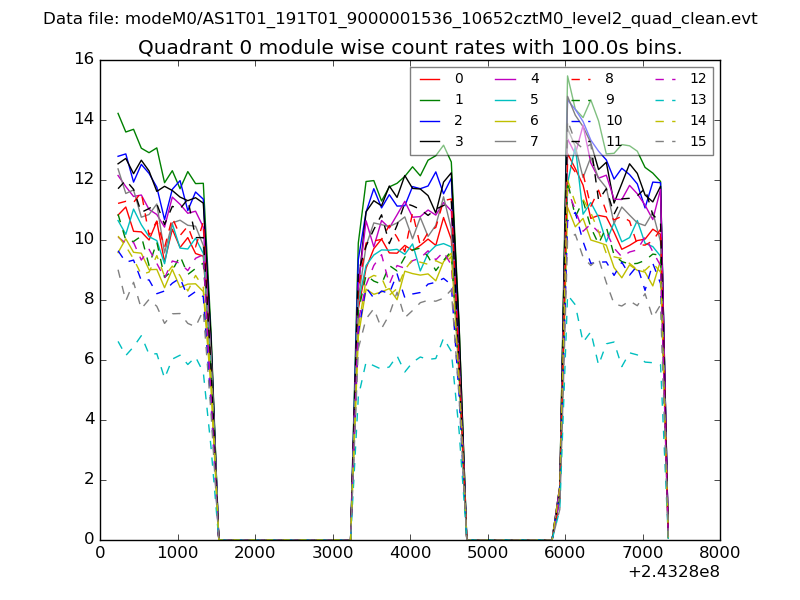 |
 |
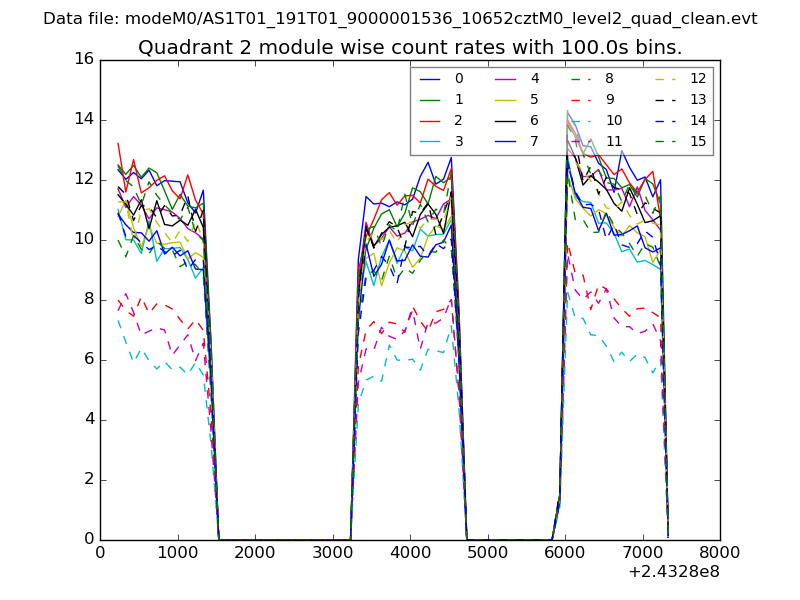
| Module-wise count rates for Quadrant B Data is divided into 100 sec bins |
 |
 |
| Module-wise count rates for Quadrant C Data is divided into 100 sec bins |
 |
 |
| Module-wise count rates for Quadrant D Data is divided into 100 sec bins |
 |
 |
| Parameter | Plot |
|---|---|
| CZT HV Monitor | 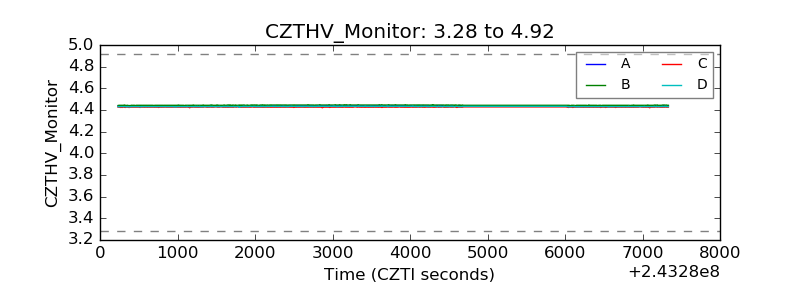 |
| D_VDD | 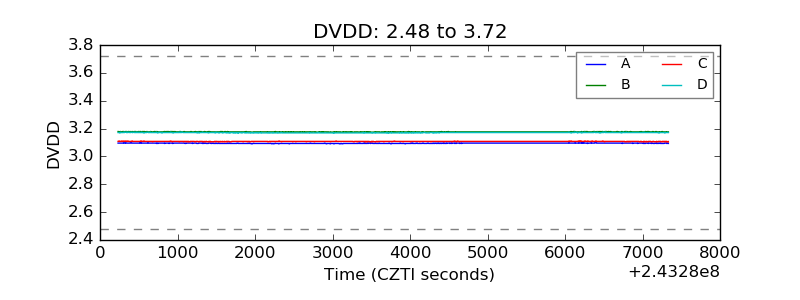 |
| Temperature 1 | 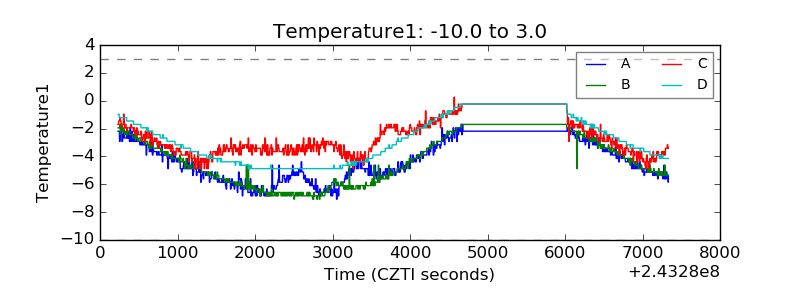 |
| Veto HV Monitor | 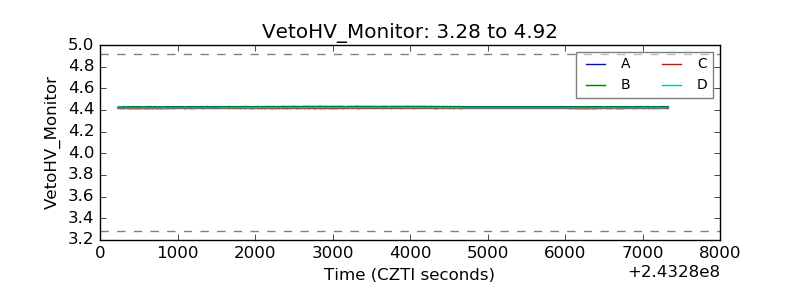 |
| Veto LLD |  |
| Alpha Counter | 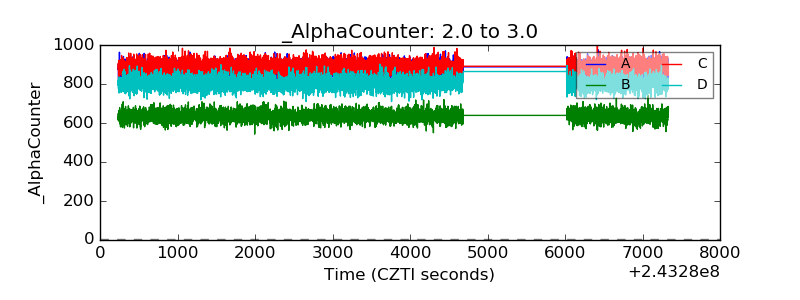 |
| _CPM_Rate | 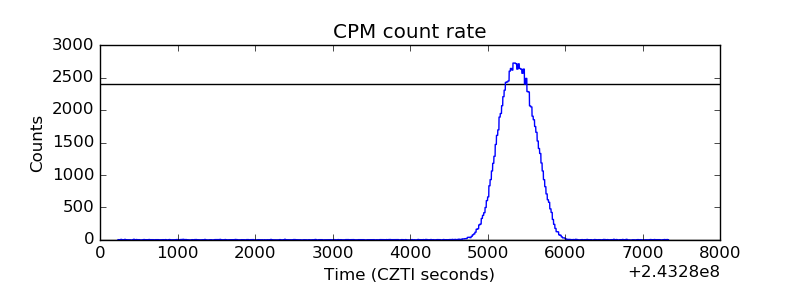 |
| CZT Counter | 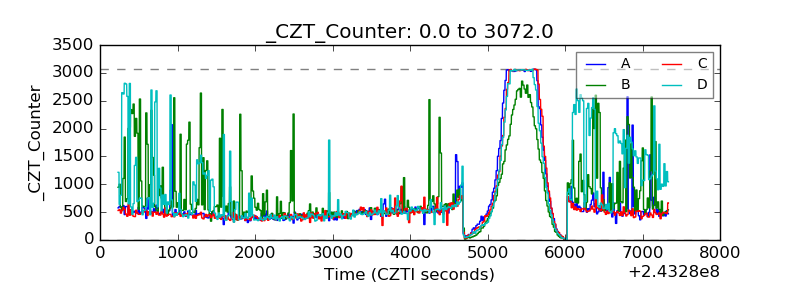 |
| +2.5 Volts monitor |  |
| +5 Volts monitor |  |
| _ROLL_ROT | 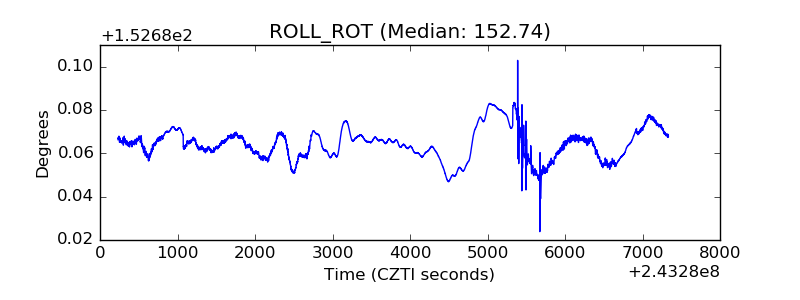 |
| _Roll_DEC | 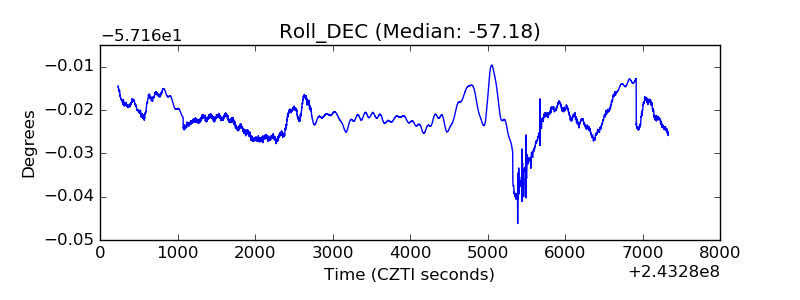 |
| _Roll_RA | 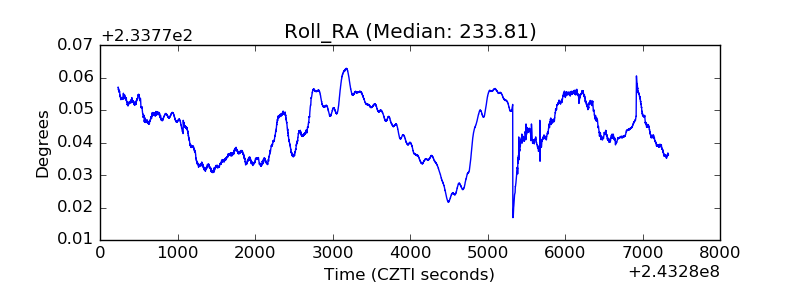 |
| Veto Counter | 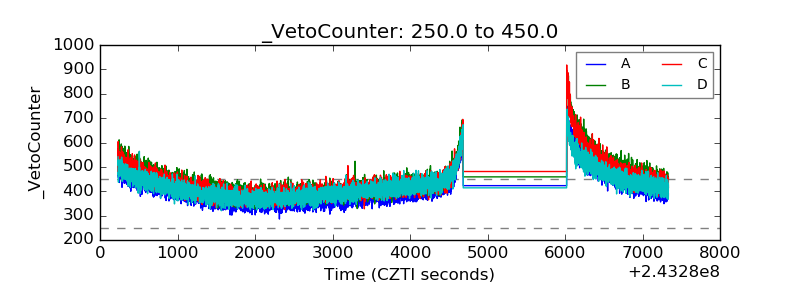 |