| Param | Original file | Final file |
|---|---|---|
| Filename | modeM0/AS1T01_191T01_9000001536_10653cztM0_level2.evt | modeM0/AS1T01_191T01_9000001536_10653cztM0_level2_quad_clean.evt |
| Size (bytes) | 485,432,640 | 81,383,040 |
| Size | 462.9 MB | 77.6 MB |
| Events in quadrant A | 3,657,354 | 497,868 |
| Events in quadrant B | 3,856,174 | 541,004 |
| Events in quadrant C | 2,702,644 | 543,965 |
| Events in quadrant D | 4,112,923 | 497,311 |
| Mode SS | |||
|---|---|---|---|
| Quadrant | BADHDUFLAG | Total packets | Discarded packets |
| A | 0 | 112 | 0 |
| B | 0 | 112 | 0 |
| C | 0 | 112 | 0 |
| D | 0 | 112 | 0 |
| Mode M9 | |||
|---|---|---|---|
| Quadrant | BADHDUFLAG | Total packets | Discarded packets |
| A | 0 | 13 | 0 |
| B | 0 | 13 | 0 |
| C | 0 | 13 | 0 |
| D | 0 | 13 | 0 |
| Mode M0 | |||
|---|---|---|---|
| Quadrant | BADHDUFLAG | Total packets | Discarded packets |
| A | 0 | 14461 | 10 |
| B | 0 | 15078 | 1 |
| C | 0 | 11537 | 1 |
| D | 0 | 15898 | 1 |
| Quadrant | Total seconds | Saturated seconds | Saturation percentage |
|---|---|---|---|
| A | 5486 | 432 | 7.874590% |
| B | 5488 | 294 | 5.357143% |
| C | 5488 | 22 | 0.400875% |
| D | 5488 | 114 | 2.077259% |
Noise dominated data is calculated using 1-second bins in cleaned event files. If a bin has >2000 counts, and if more than 50% of those come from <1% of pixels, then it is considered to be noise-dominated and hence unusable.
| Quadrant | # 1 sec bins | Bins with >0 counts | Bins with >2000 counts | High rate bins dominated by noise | Noise dominated (total time) | Noise dominated (detector-on time) | Marked lightcurve |
|---|---|---|---|---|---|---|---|
| A | 6818 | 5489 | 370 | 370 | 5.43% | 6.74% |  |
| B | 6818 | 5489 | 176 | 176 | 2.58% | 3.21% | 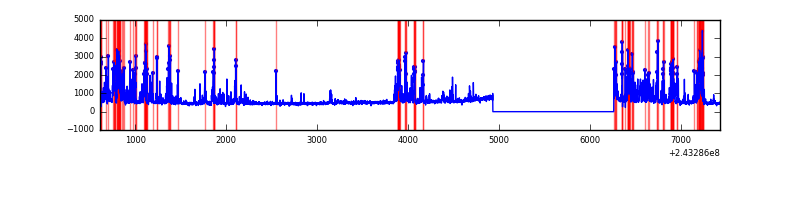 |
| C | 6818 | 5489 | 6 | 6 | 0.09% | 0.11% | 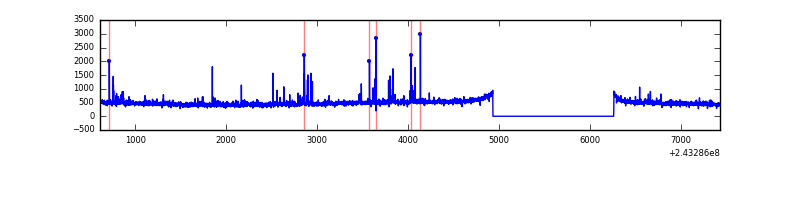 |
| D | 6818 | 5489 | 94 | 94 | 1.38% | 1.71% | 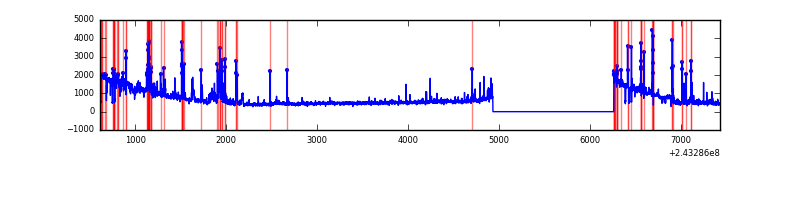 |
Top three noisy pixels from each quadrant. If the there are fewer than three noisy pixels in the level2.evt file, extra rows are filled as -1
| Pixel properties | Quadrant properties | ||||||
|---|---|---|---|---|---|---|---|
| Quadrant | DetID | PixID | Counts | Sigma | Mean | Median | Sigma |
| A | 15 | 239 | 1031852 | 7674.19 | 654 | 642 | 134.4 |
| A | 15 | 223 | 89413 | 660.63 | 654 | 642 | 134.4 |
| A | 1 | 162 | 6573 | 44.14 | 654 | 642 | 134.4 |
| B | 4 | 239 | 1136236 | 8818.86 | 682 | 670 | 128.8 |
| B | 0 | 214 | 36618 | 279.17 | 682 | 670 | 128.8 |
| B | 0 | 219 | 17332 | 129.4 | 682 | 670 | 128.8 |
| C | 4 | 254 | 62284 | 400.24 | 662 | 670 | 153.9 |
| C | 14 | 234 | 40948 | 261.64 | 662 | 670 | 153.9 |
| C | 4 | 175 | 16616 | 103.58 | 662 | 670 | 153.9 |
| D | 1 | 20 | 1094074 | 6944.54 | 648 | 633 | 157.5 |
| D | 1 | 52 | 216250 | 1369.4 | 648 | 633 | 157.5 |
| D | 12 | 233 | 104234 | 657.98 | 648 | 633 | 157.5 |
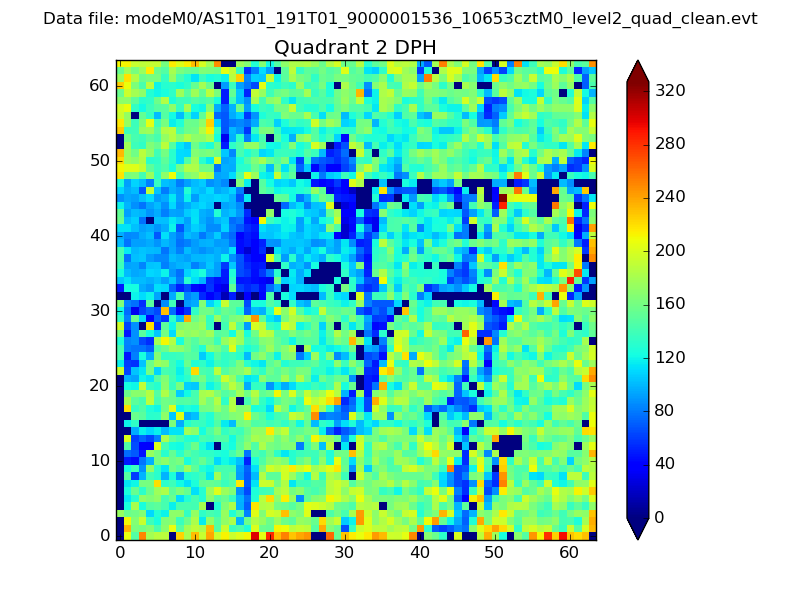
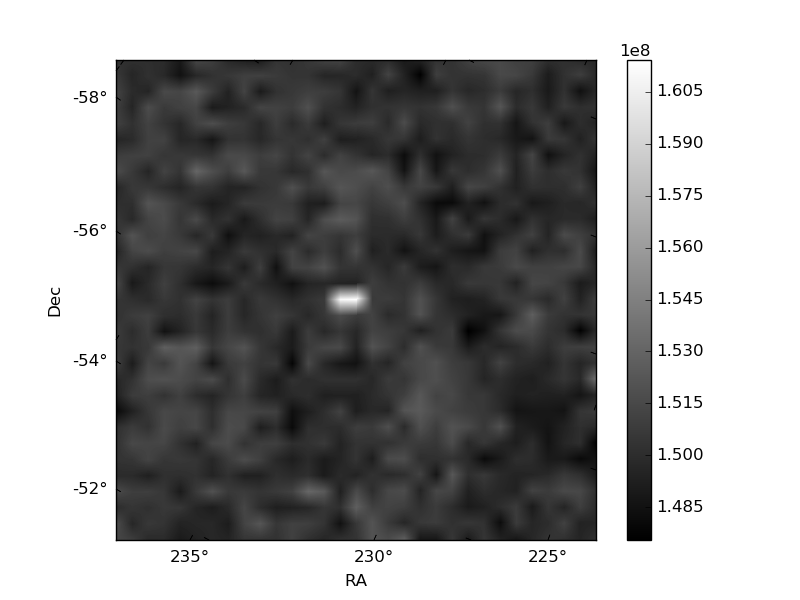
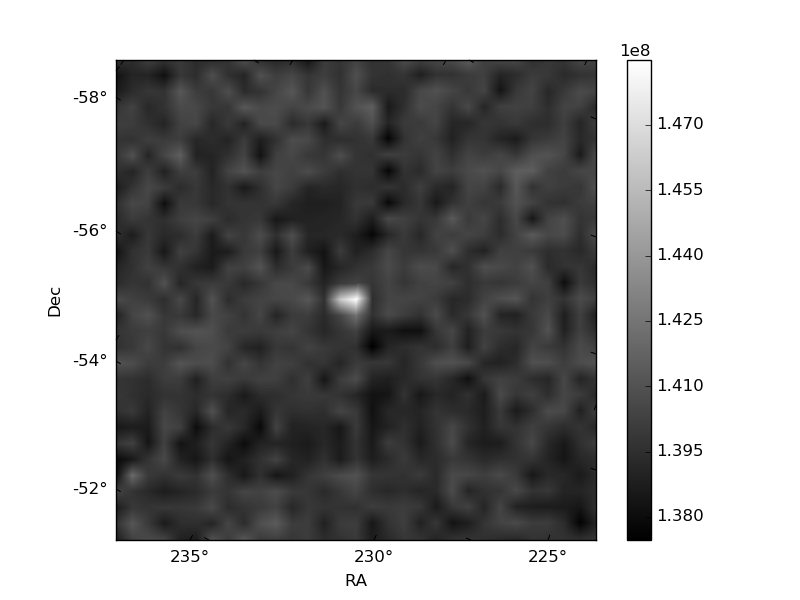
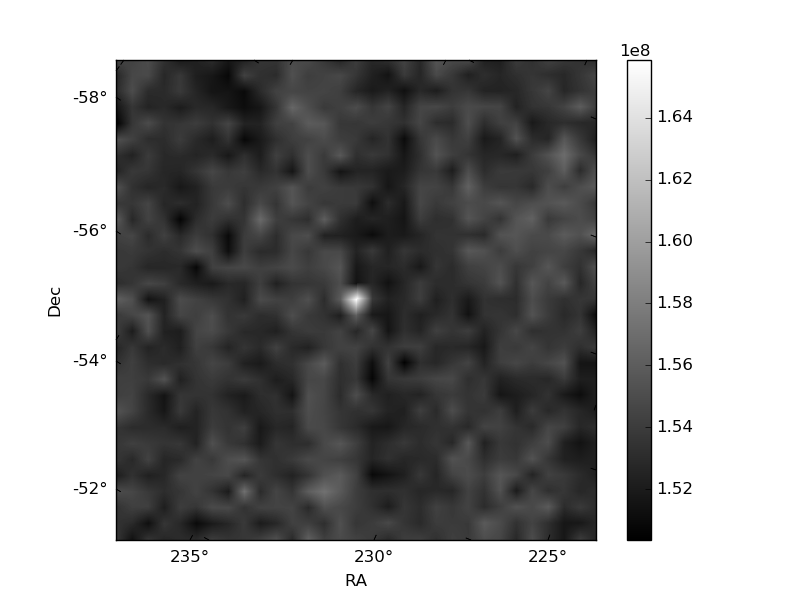
Histogram calculated using DETX and DETY for each event in the final _common_clean file
| Quadrant A | 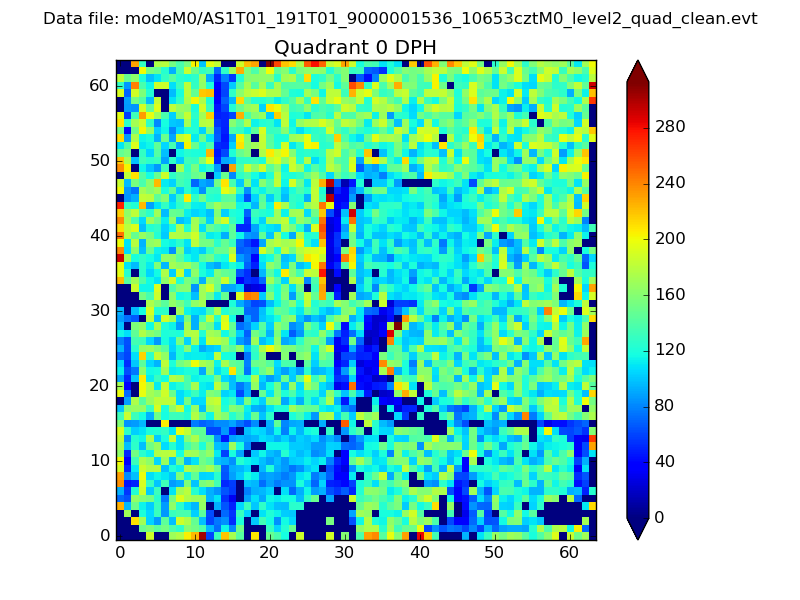 |
 |
Quadrant B |
|---|---|---|---|
| Quadrant D | 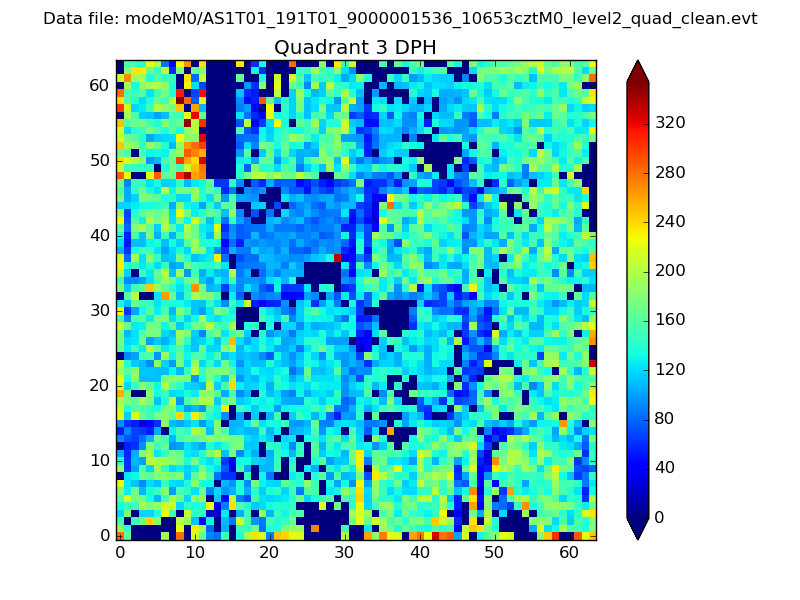 |
 |
Quadrant C |
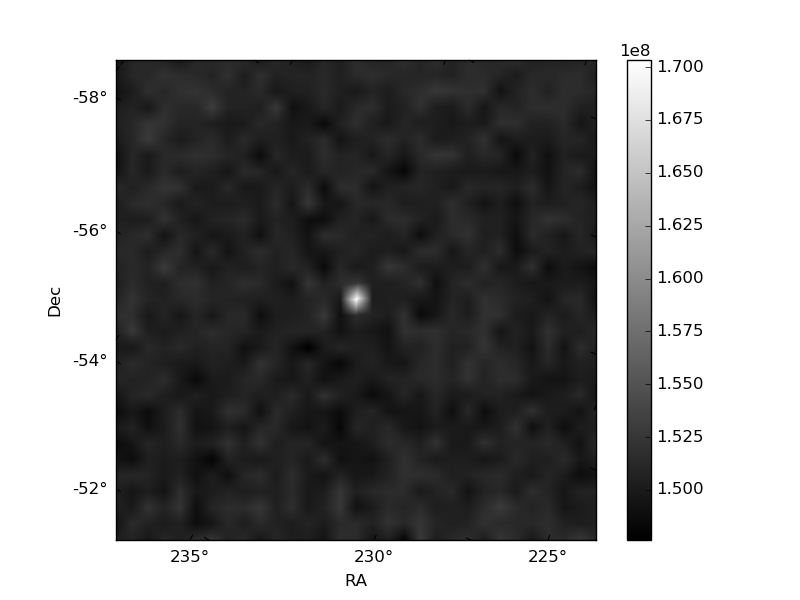
| Plot type | Count rate plots | Images |
|---|---|---|
| Comparison with Poisson distribution Blue bars denote a histogram of data divided into 1 sec bins. Red curve is a Poisson curve with rate = median count rate of data. |
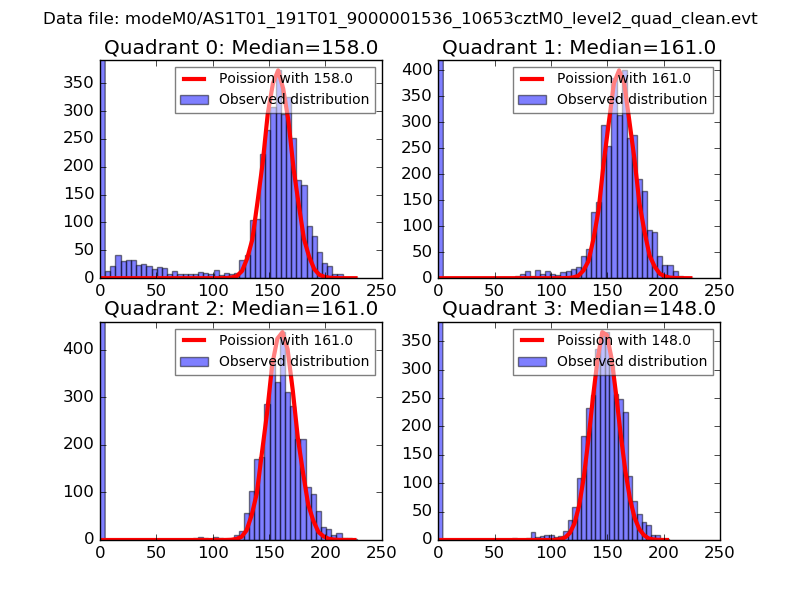 |
 |
| Quadrant-wise count rates Data is divided into 100 sec bins |
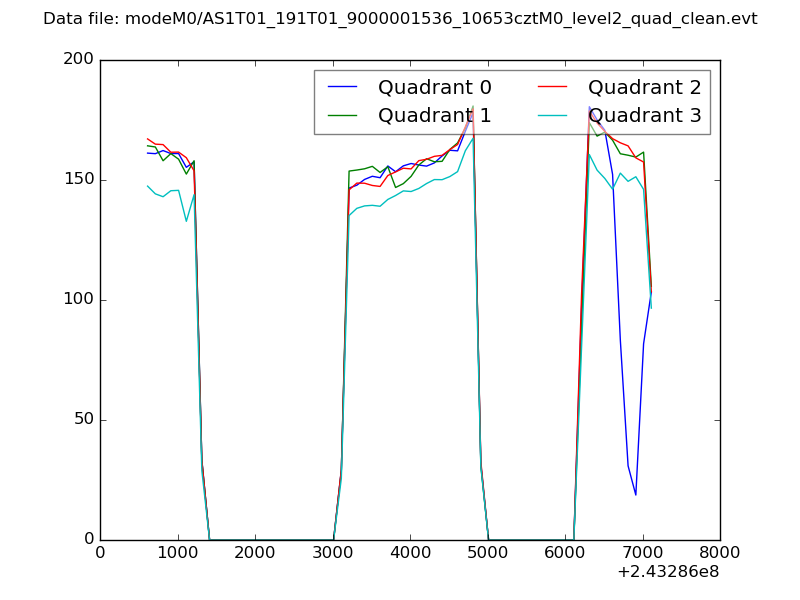 |
|
| Module-wise count rates for Quadrant A Data is divided into 100 sec bins |
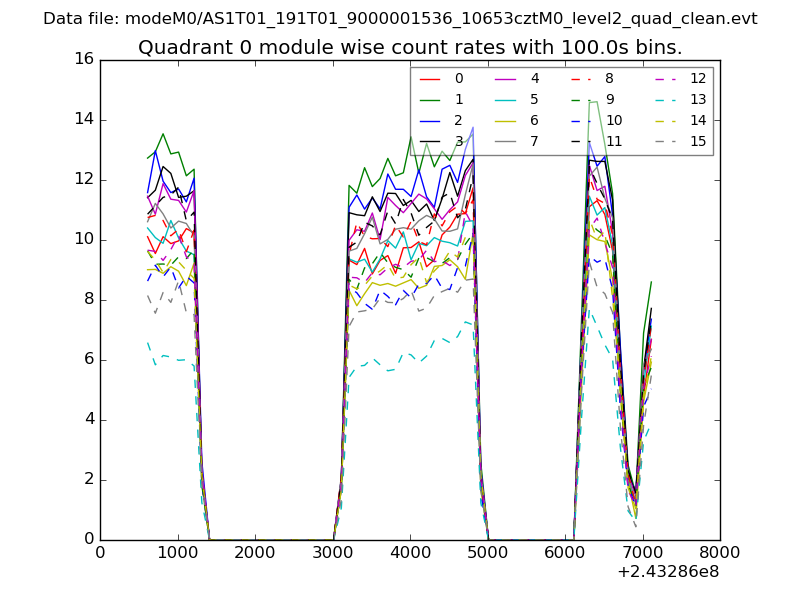 |
 |
| Module-wise count rates for Quadrant B Data is divided into 100 sec bins |
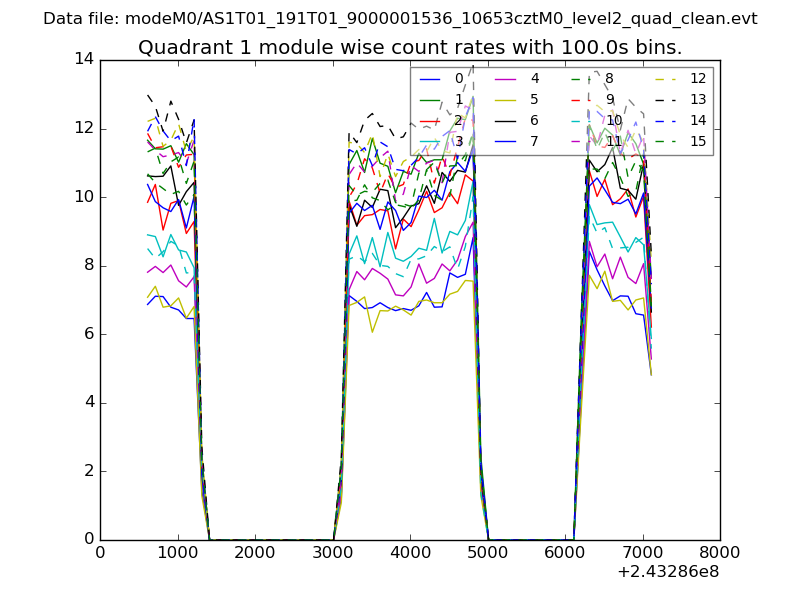 |
 |
| Module-wise count rates for Quadrant C Data is divided into 100 sec bins |
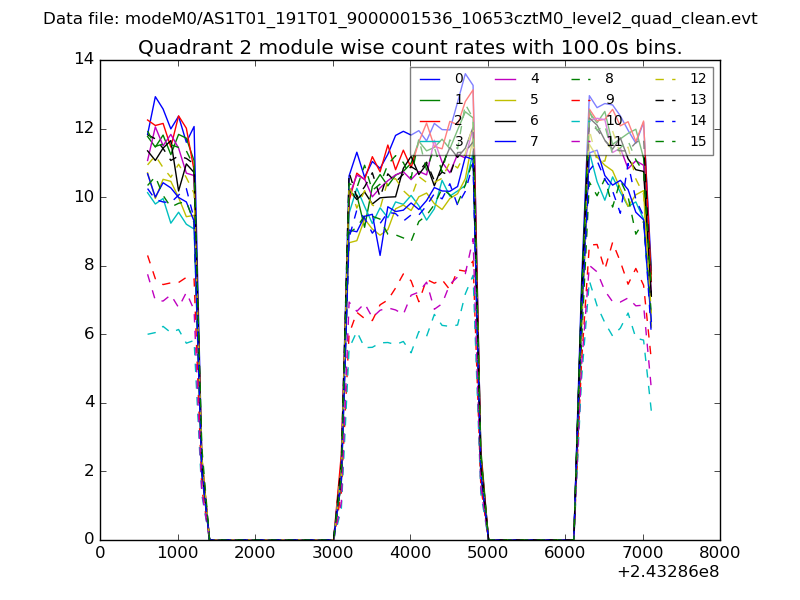 |
 |
| Module-wise count rates for Quadrant D Data is divided into 100 sec bins |
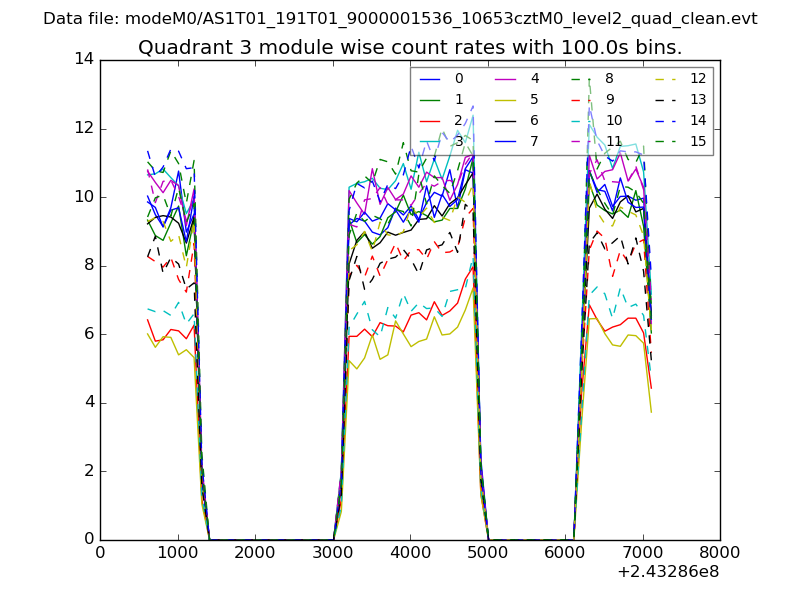 |
 |
| Parameter | Plot |
|---|---|
| CZT HV Monitor | 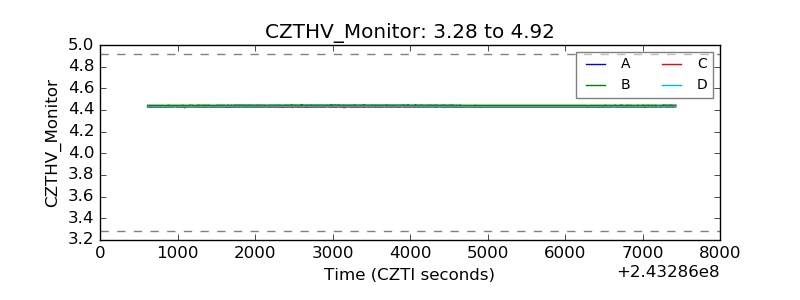 |
| D_VDD | 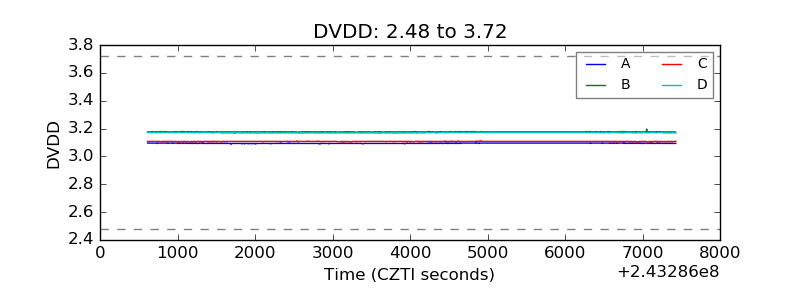 |
| Temperature 1 | 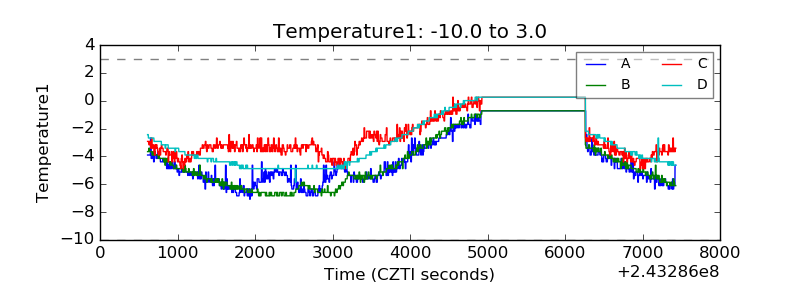 |
| Veto HV Monitor | 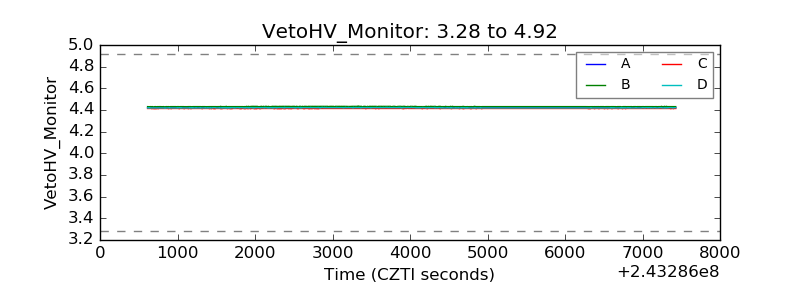 |
| Veto LLD | 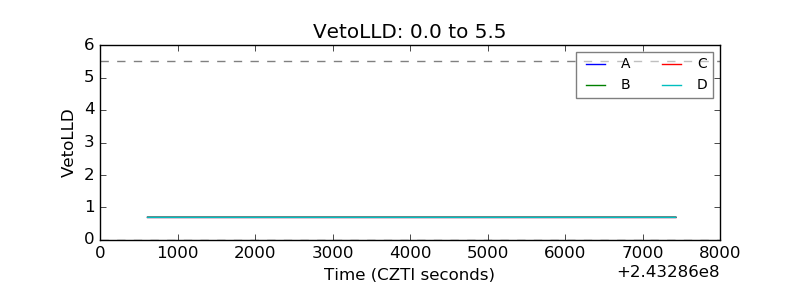 |
| Alpha Counter | 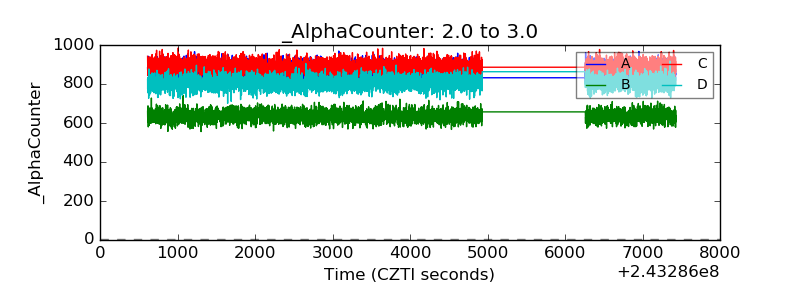 |
| _CPM_Rate | 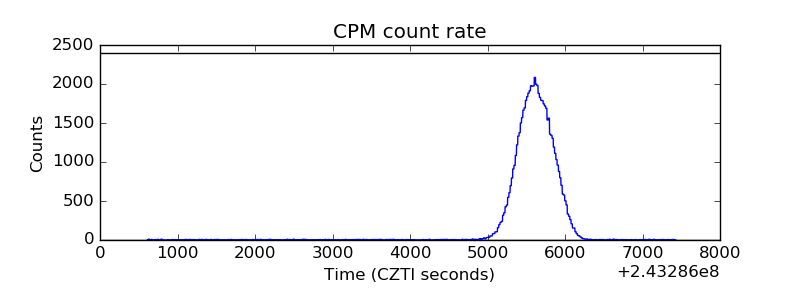 |
| CZT Counter | 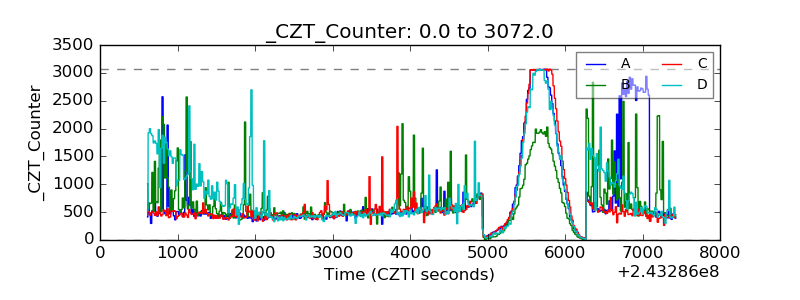 |
| +2.5 Volts monitor |  |
| +5 Volts monitor |  |
| _ROLL_ROT | 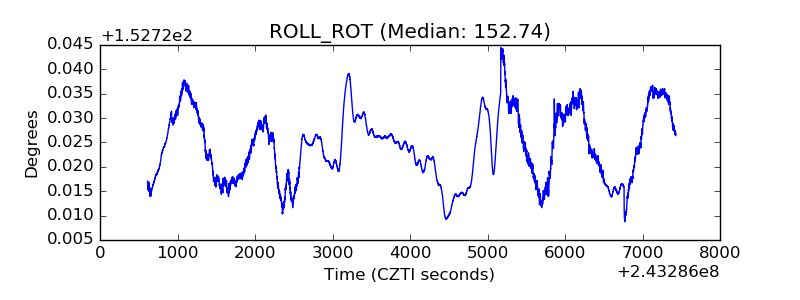 |
| _Roll_DEC |  |
| _Roll_RA | 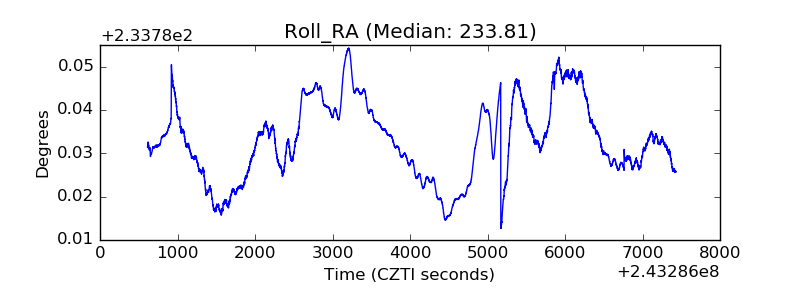 |
| Veto Counter | 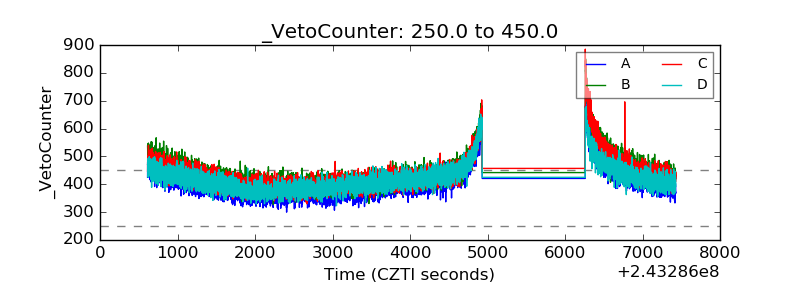 |