| Param | Original file | Final file |
|---|---|---|
| Filename | modeM0/AS1T01_191T01_9000001536_10654cztM0_level2.evt | modeM0/AS1T01_191T01_9000001536_10654cztM0_level2_quad_clean.evt |
| Size (bytes) | 472,187,520 | 78,923,520 |
| Size | 450.3 MB | 75.3 MB |
| Events in quadrant A | 3,909,305 | 470,125 |
| Events in quadrant B | 4,146,033 | 510,721 |
| Events in quadrant C | 2,755,740 | 518,774 |
| Events in quadrant D | 3,093,061 | 482,513 |
| Mode SS | |||
|---|---|---|---|
| Quadrant | BADHDUFLAG | Total packets | Discarded packets |
| A | 0 | 118 | 0 |
| B | 0 | 118 | 0 |
| C | 0 | 118 | 0 |
| D | 0 | 118 | 0 |
| Mode M9 | |||
|---|---|---|---|
| Quadrant | BADHDUFLAG | Total packets | Discarded packets |
| A | 0 | 13 | 0 |
| B | 0 | 13 | 0 |
| C | 0 | 13 | 0 |
| D | 0 | 13 | 0 |
| Mode M0 | |||
|---|---|---|---|
| Quadrant | BADHDUFLAG | Total packets | Discarded packets |
| A | 0 | 15428 | 2 |
| B | 0 | 16148 | 1 |
| C | 0 | 12024 | 1 |
| D | 0 | 13138 | 1 |
| Quadrant | Total seconds | Saturated seconds | Saturation percentage |
|---|---|---|---|
| A | 5833 | 454 | 7.783302% |
| B | 5833 | 352 | 6.034631% |
| C | 5833 | 10 | 0.171438% |
| D | 5833 | 50 | 0.857192% |
Noise dominated data is calculated using 1-second bins in cleaned event files. If a bin has >2000 counts, and if more than 50% of those come from <1% of pixels, then it is considered to be noise-dominated and hence unusable.
| Quadrant | # 1 sec bins | Bins with >0 counts | Bins with >2000 counts | High rate bins dominated by noise | Noise dominated (total time) | Noise dominated (detector-on time) | Marked lightcurve |
|---|---|---|---|---|---|---|---|
| A | 7098 | 5834 | 398 | 398 | 5.61% | 6.82% | 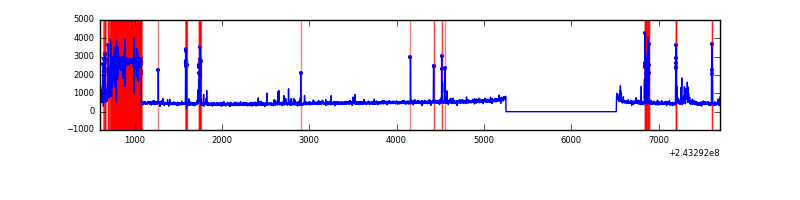 |
| B | 7098 | 5834 | 180 | 180 | 2.54% | 3.09% | 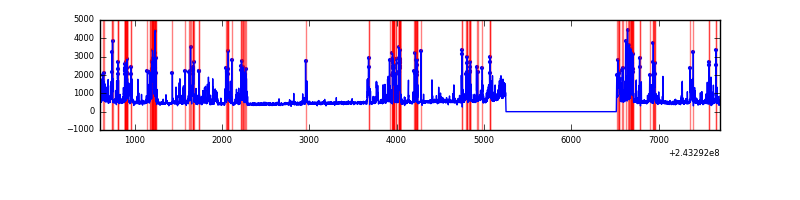 |
| C | 7098 | 5834 | 0 | 0 | 0.00% | 0.00% | 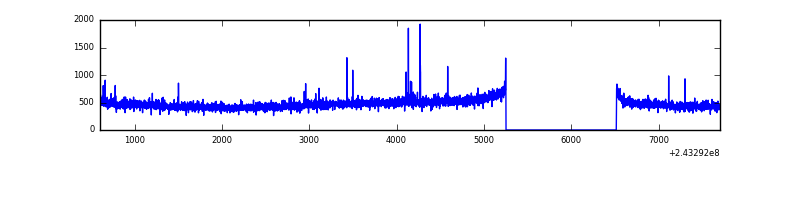 |
| D | 7098 | 5834 | 32 | 32 | 0.45% | 0.55% | 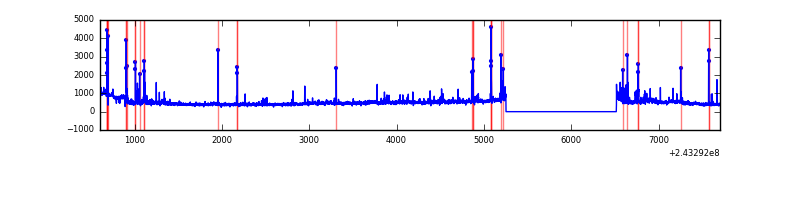 |
Top three noisy pixels from each quadrant. If the there are fewer than three noisy pixels in the level2.evt file, extra rows are filled as -1
| Pixel properties | Quadrant properties | ||||||
|---|---|---|---|---|---|---|---|
| Quadrant | DetID | PixID | Counts | Sigma | Mean | Median | Sigma |
| A | 15 | 239 | 1120055 | 8063.36 | 679 | 669 | 138.8 |
| A | 15 | 223 | 89204 | 637.75 | 679 | 669 | 138.8 |
| A | 15 | 174 | 44575 | 316.27 | 679 | 669 | 138.8 |
| B | 4 | 239 | 1328791 | 10008.85 | 707 | 693 | 132.7 |
| B | 0 | 214 | 39978 | 296.06 | 707 | 693 | 132.7 |
| B | 12 | 111 | 13481 | 96.37 | 707 | 693 | 132.7 |
| C | 4 | 175 | 23183 | 140.1 | 692 | 700 | 160.5 |
| C | 14 | 234 | 16144 | 96.24 | 692 | 700 | 160.5 |
| C | 4 | 254 | 13756 | 81.35 | 692 | 700 | 160.5 |
| D | 1 | 20 | 180905 | 1096.67 | 678 | 661 | 164.4 |
| D | 8 | 195 | 96649 | 584.02 | 678 | 661 | 164.4 |
| D | 1 | 52 | 86585 | 522.79 | 678 | 661 | 164.4 |
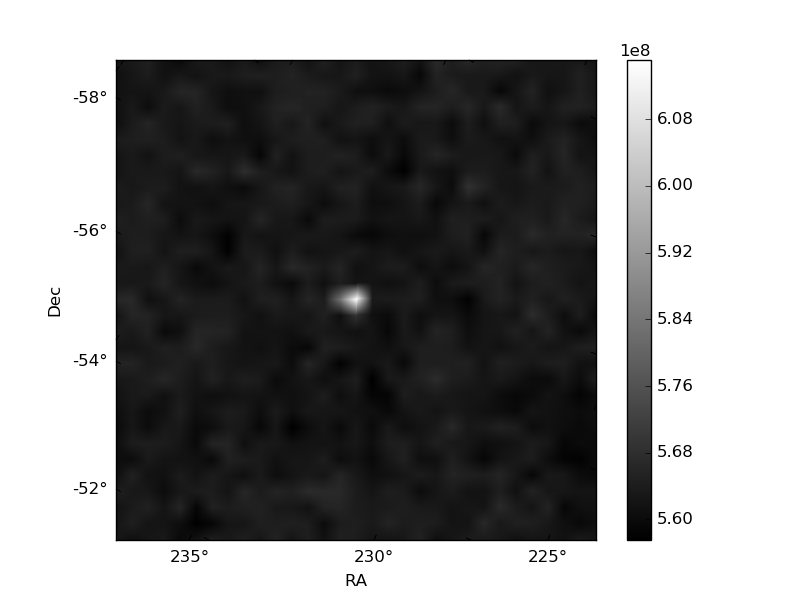
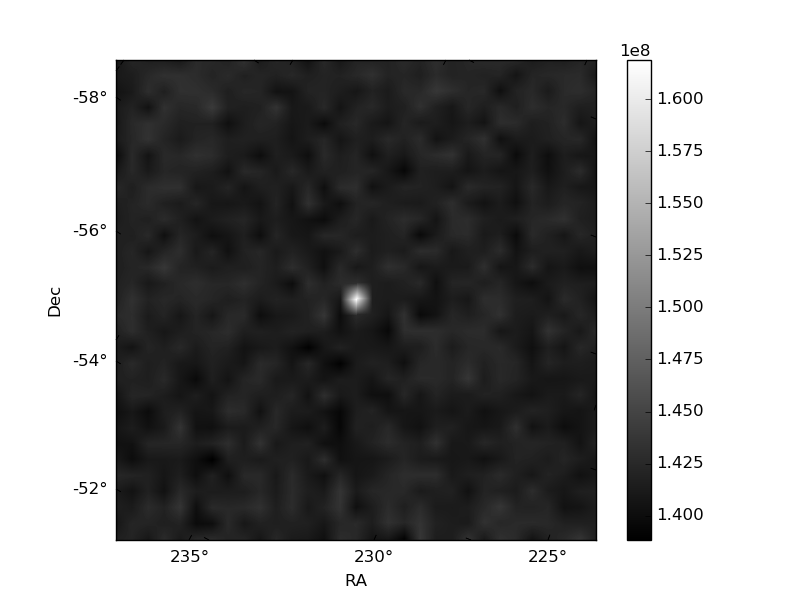
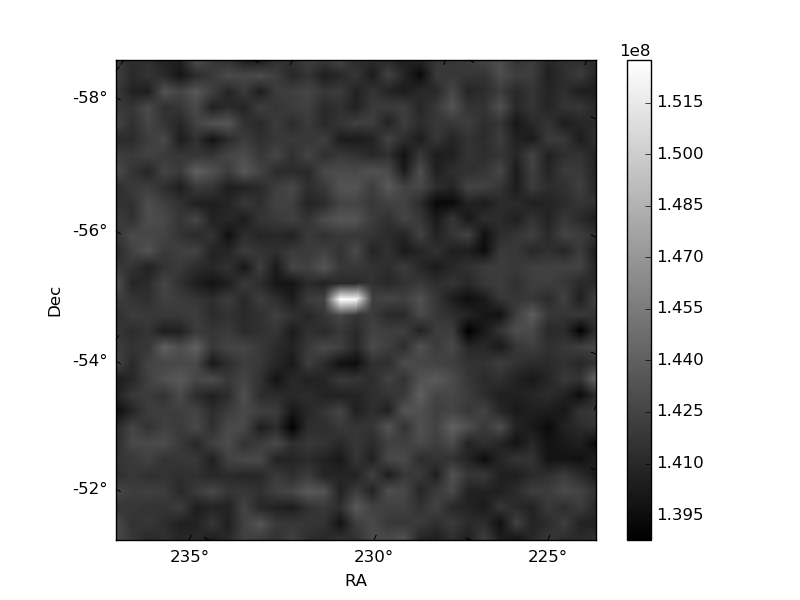
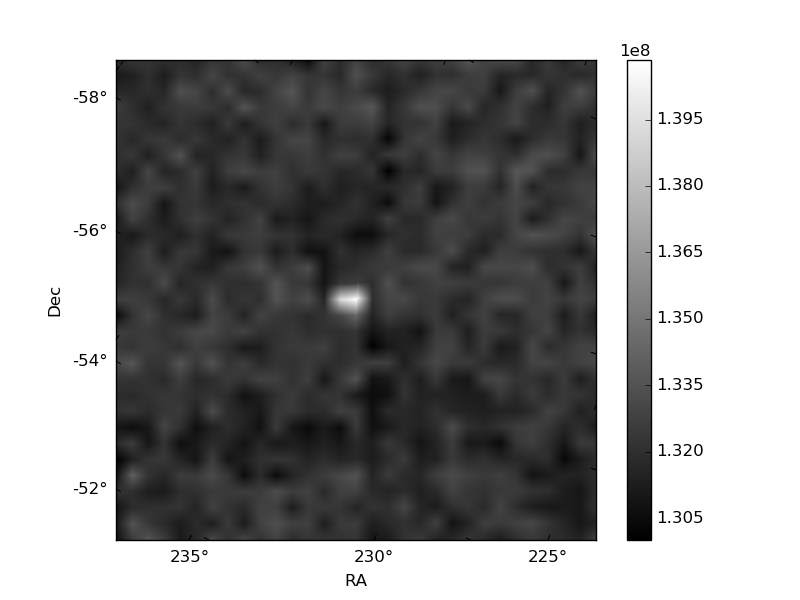
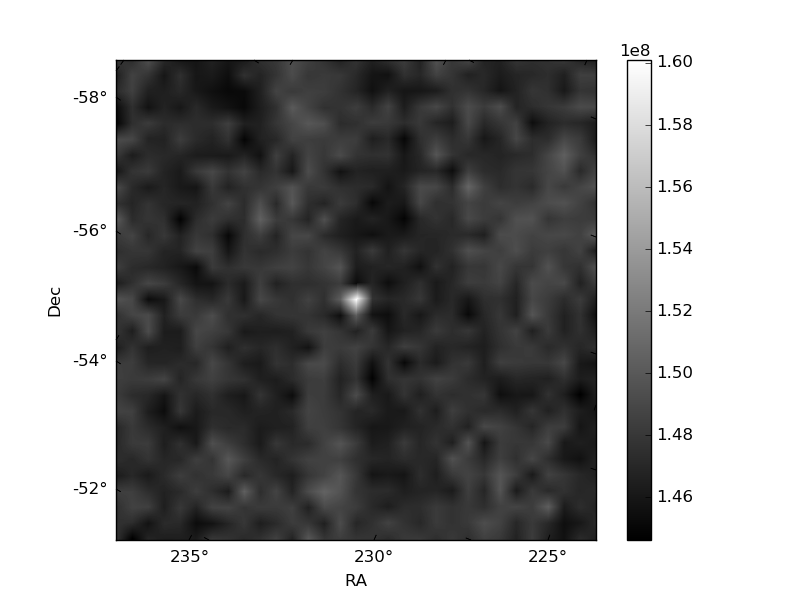
Histogram calculated using DETX and DETY for each event in the final _common_clean file
| Quadrant A | 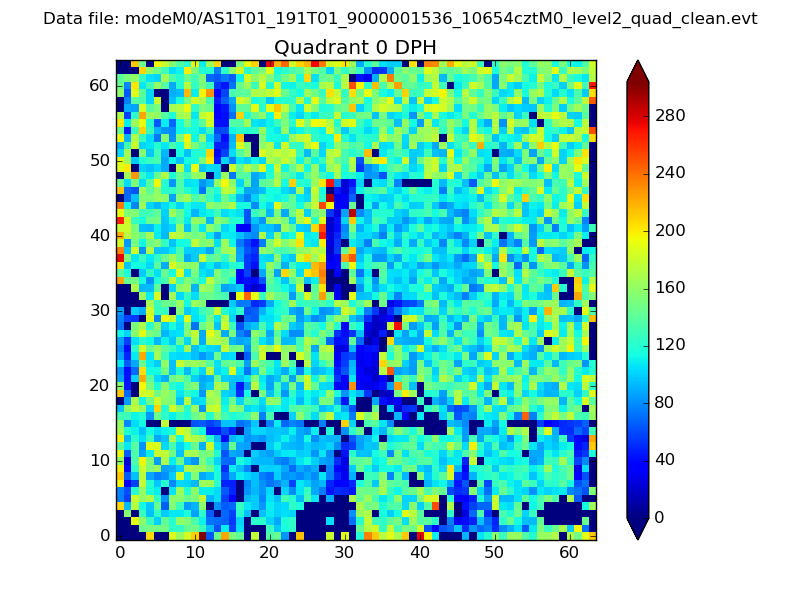 |
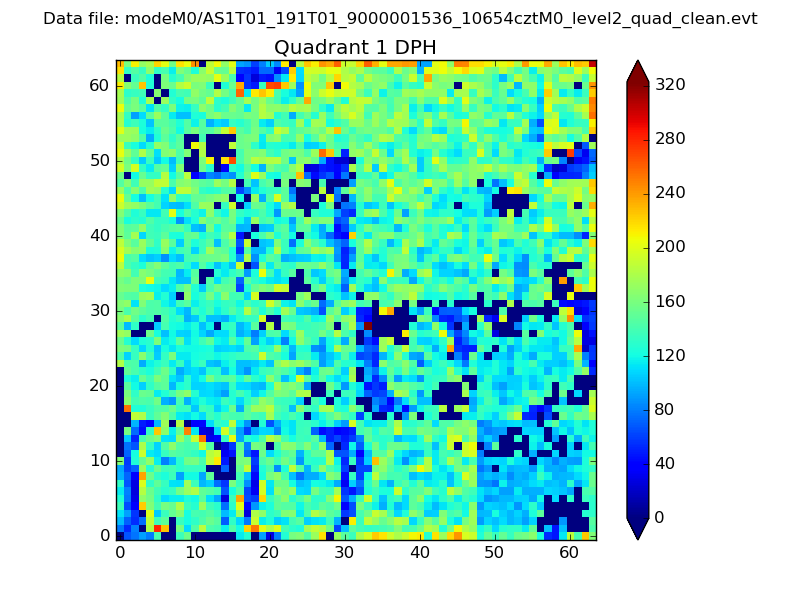 |
Quadrant B |
|---|---|---|---|
| Quadrant D | 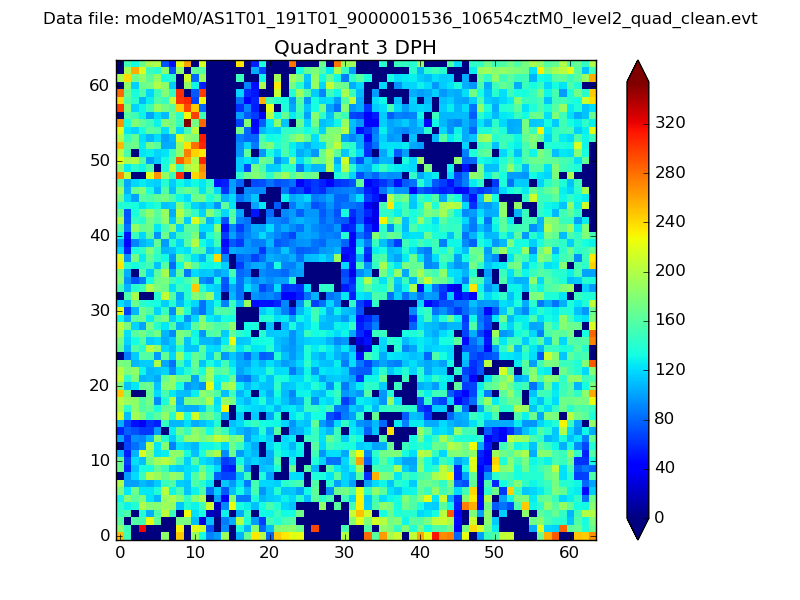 |
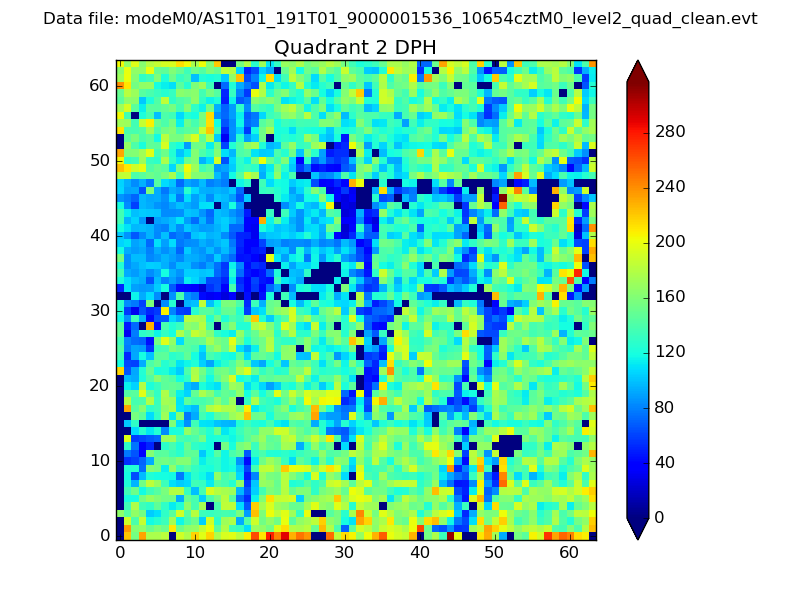 |
Quadrant C |
| Plot type | Count rate plots | Images |
|---|---|---|
| Comparison with Poisson distribution Blue bars denote a histogram of data divided into 1 sec bins. Red curve is a Poisson curve with rate = median count rate of data. |
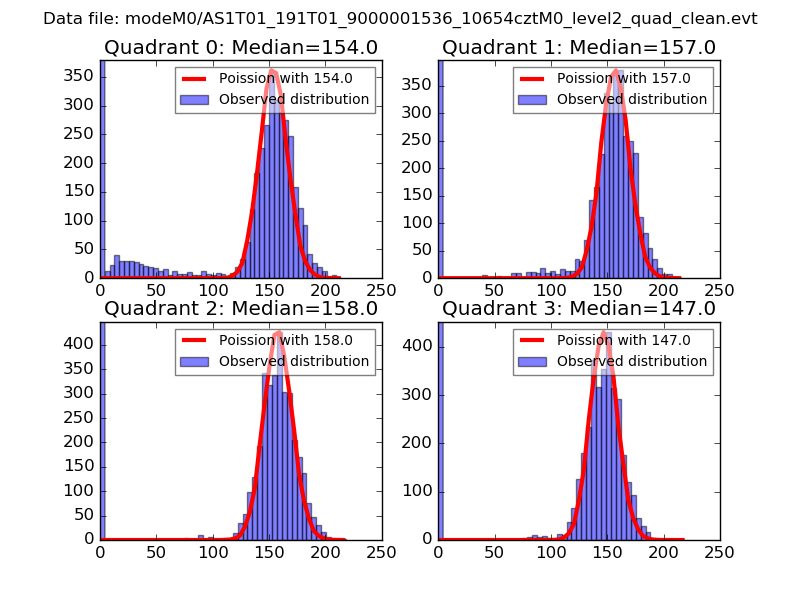 |
 |
| Quadrant-wise count rates Data is divided into 100 sec bins |
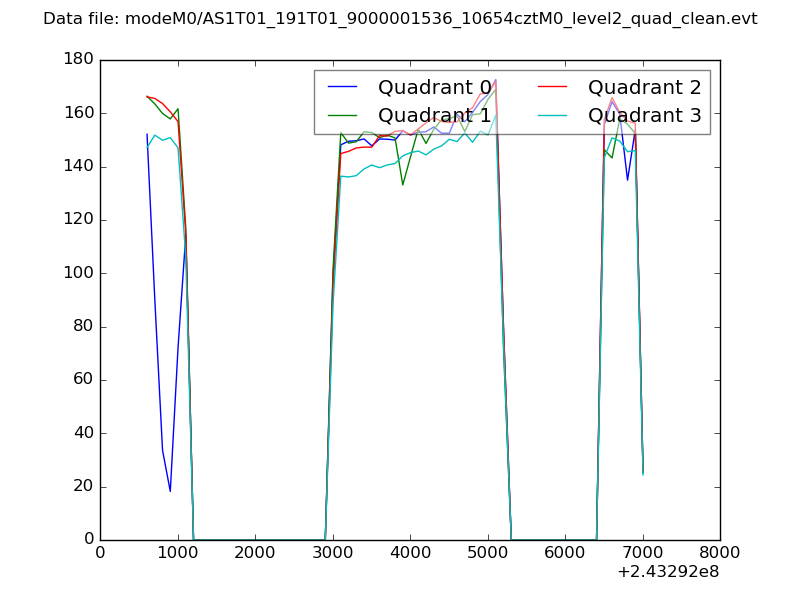 |
|
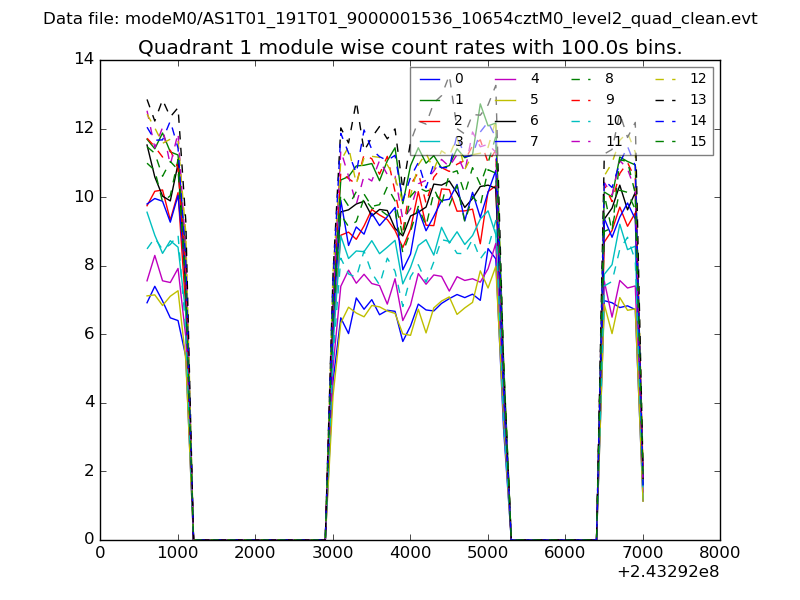
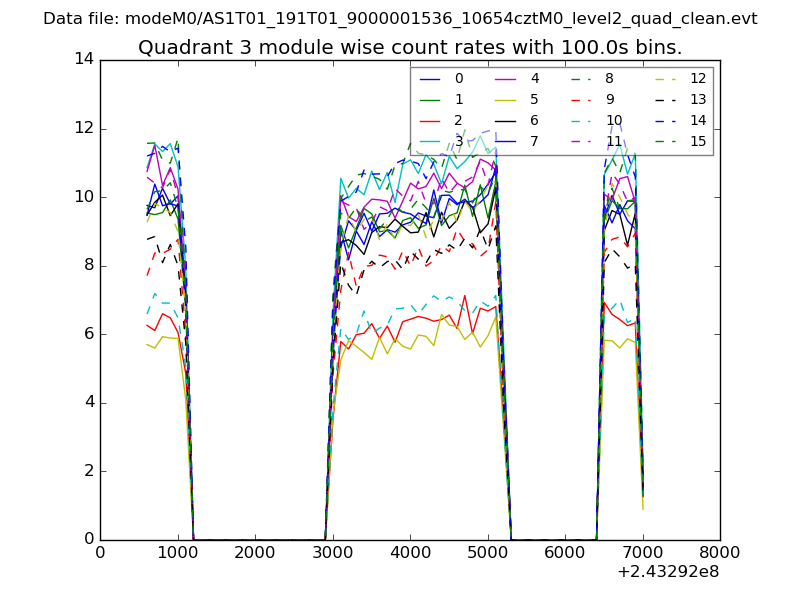
| Module-wise count rates for Quadrant A Data is divided into 100 sec bins |
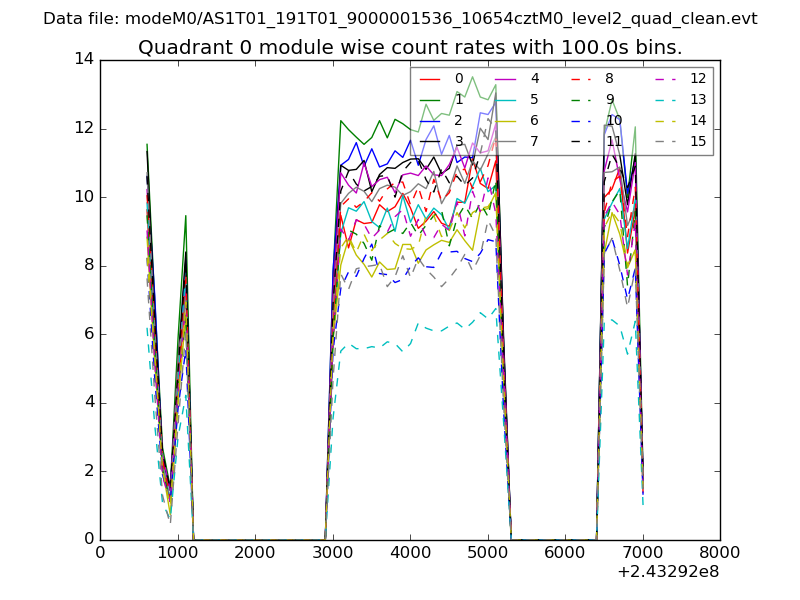 |
 |
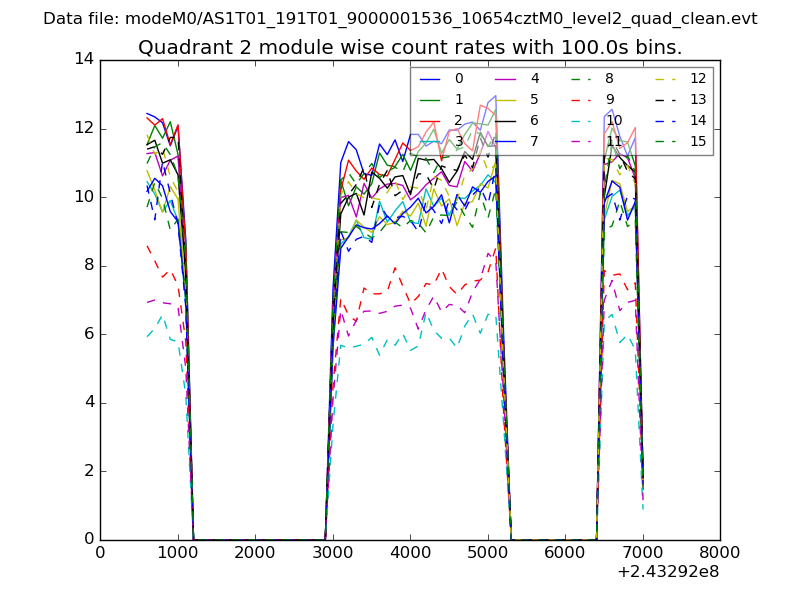
| Module-wise count rates for Quadrant B Data is divided into 100 sec bins |
 |
 |
| Module-wise count rates for Quadrant C Data is divided into 100 sec bins |
 |
 |
| Module-wise count rates for Quadrant D Data is divided into 100 sec bins |
 |
 |
| Parameter | Plot |
|---|---|
| CZT HV Monitor | 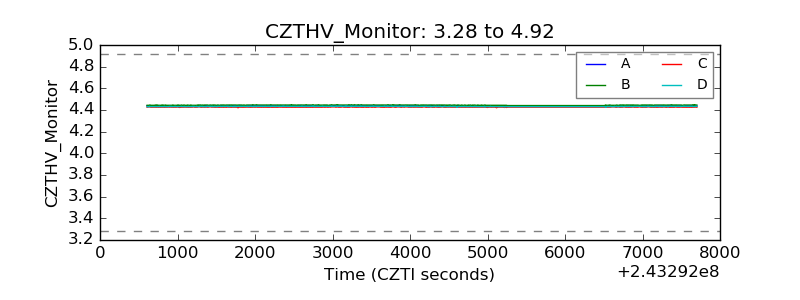 |
| D_VDD | 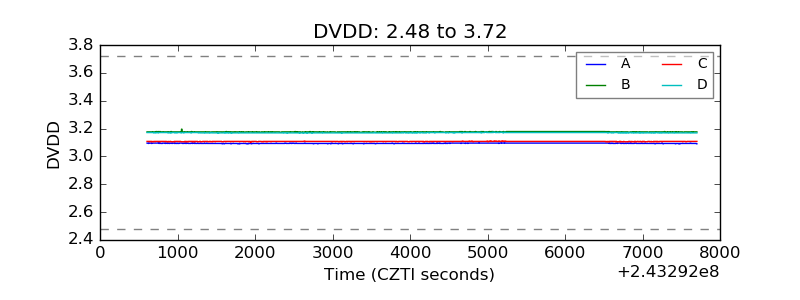 |
| Temperature 1 | 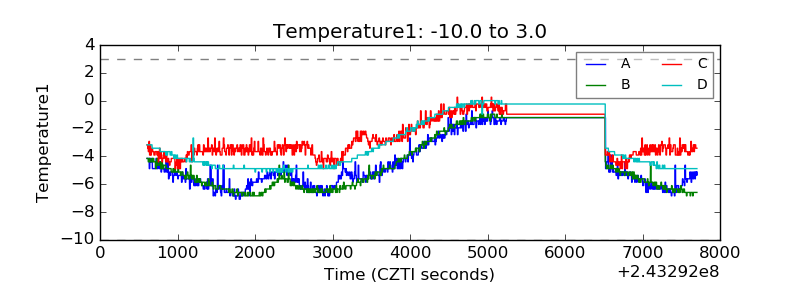 |
| Veto HV Monitor | 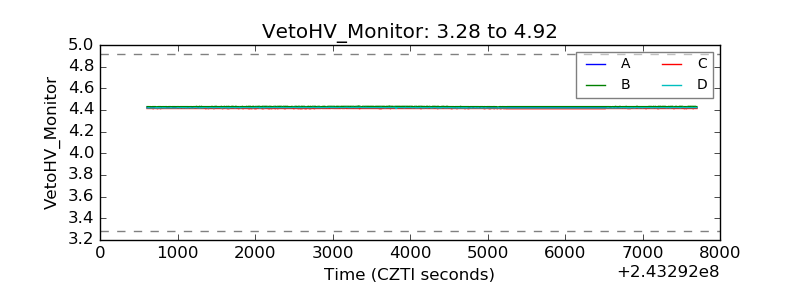 |
| Veto LLD | 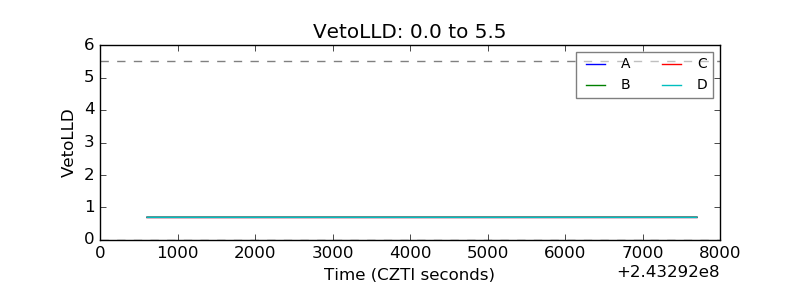 |
| Alpha Counter | 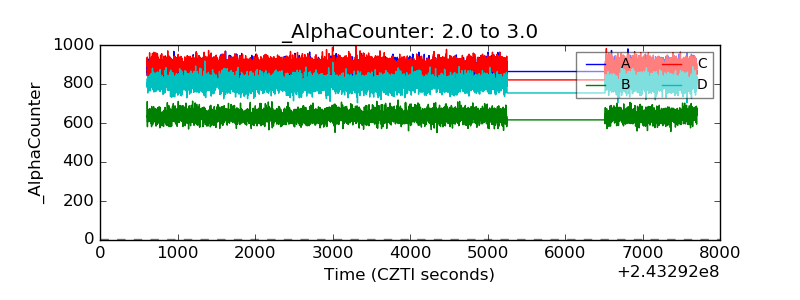 |
| _CPM_Rate | 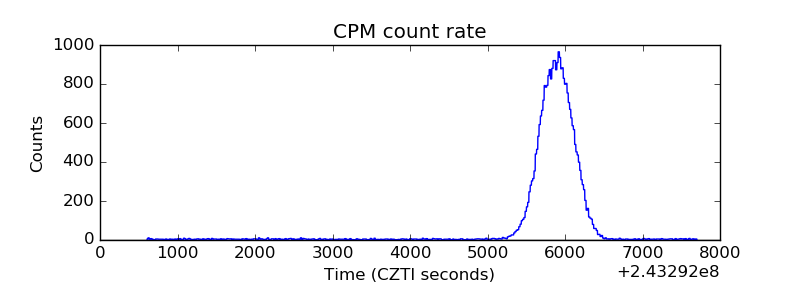 |
| CZT Counter | 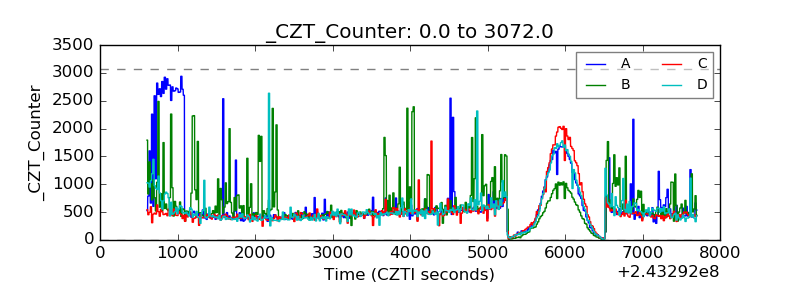 |
| +2.5 Volts monitor |  |
| +5 Volts monitor |  |
| _ROLL_ROT | 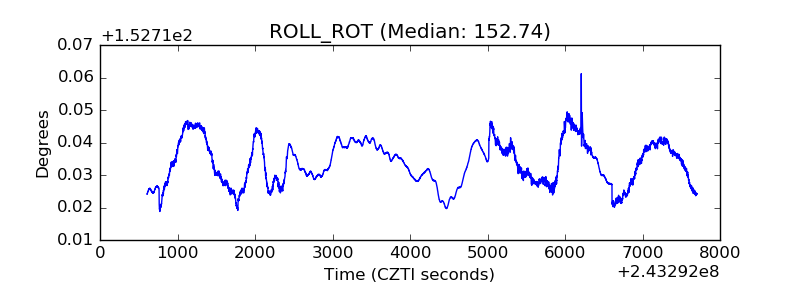 |
| _Roll_DEC | 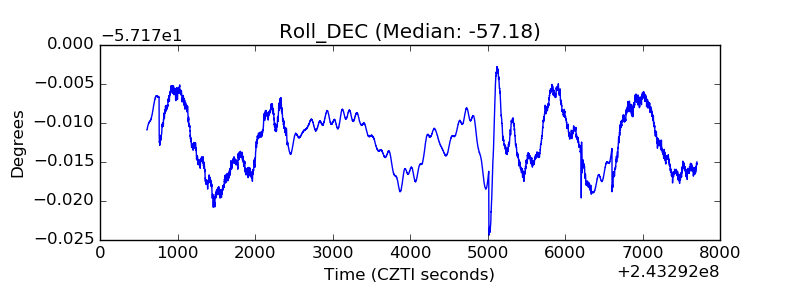 |
| _Roll_RA |  |
| Veto Counter | 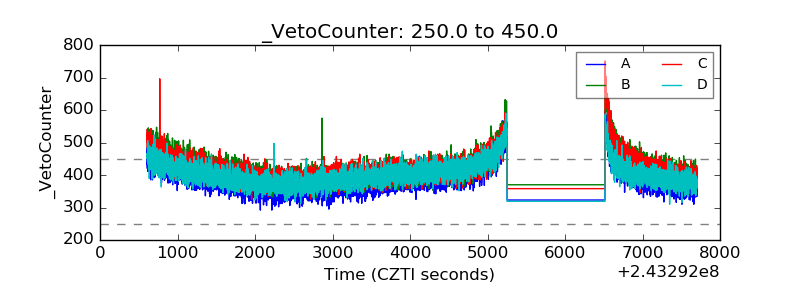 |