| Param | Original file | Final file |
|---|---|---|
| Filename | modeM0/AS1T01_191T01_9000001536_10655cztM0_level2.evt | modeM0/AS1T01_191T01_9000001536_10655cztM0_level2_quad_clean.evt |
| Size (bytes) | 521,461,440 | 84,245,760 |
| Size | 497.3 MB | 80.3 MB |
| Events in quadrant A | 3,992,472 | 527,854 |
| Events in quadrant B | 4,272,004 | 525,339 |
| Events in quadrant C | 3,071,419 | 538,499 |
| Events in quadrant D | 4,013,796 | 504,070 |
| Mode SS | |||
|---|---|---|---|
| Quadrant | BADHDUFLAG | Total packets | Discarded packets |
| A | 0 | 132 | 0 |
| B | 0 | 132 | 0 |
| C | 0 | 132 | 0 |
| D | 0 | 132 | 0 |
| Mode M9 | |||
|---|---|---|---|
| Quadrant | BADHDUFLAG | Total packets | Discarded packets |
| A | 0 | 18 | 0 |
| B | 0 | 18 | 0 |
| C | 0 | 18 | 0 |
| D | 0 | 19 | 0 |
| Mode M0 | |||
|---|---|---|---|
| Quadrant | BADHDUFLAG | Total packets | Discarded packets |
| A | 0 | 16104 | 3 |
| B | 0 | 16949 | 2 |
| C | 0 | 13531 | 2 |
| D | 0 | 16281 | 2 |
| Quadrant | Total seconds | Saturated seconds | Saturation percentage |
|---|---|---|---|
| A | 6528 | 204 | 3.125000% |
| B | 6528 | 299 | 4.580270% |
| C | 6528 | 19 | 0.291054% |
| D | 6528 | 98 | 1.501225% |
Noise dominated data is calculated using 1-second bins in cleaned event files. If a bin has >2000 counts, and if more than 50% of those come from <1% of pixels, then it is considered to be noise-dominated and hence unusable.
| Quadrant | # 1 sec bins | Bins with >0 counts | Bins with >2000 counts | High rate bins dominated by noise | Noise dominated (total time) | Noise dominated (detector-on time) | Marked lightcurve |
|---|---|---|---|---|---|---|---|
| A | 7528 | 6528 | 121 | 121 | 1.61% | 1.85% | 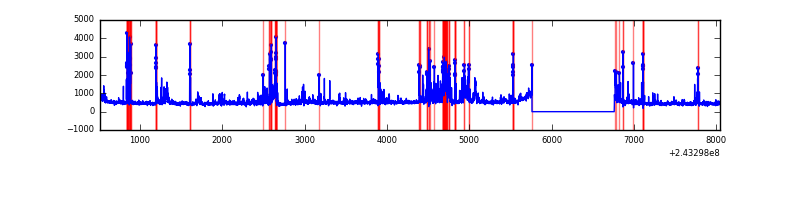 |
| B | 7528 | 6529 | 166 | 166 | 2.21% | 2.54% | 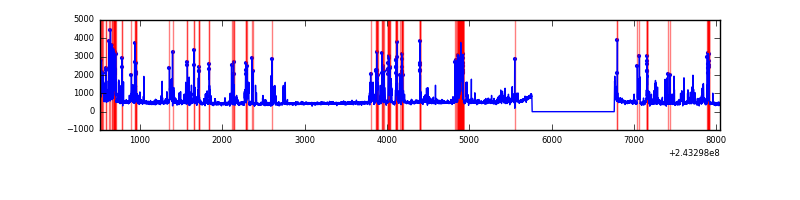 |
| C | 7528 | 6529 | 4 | 4 | 0.05% | 0.06% | 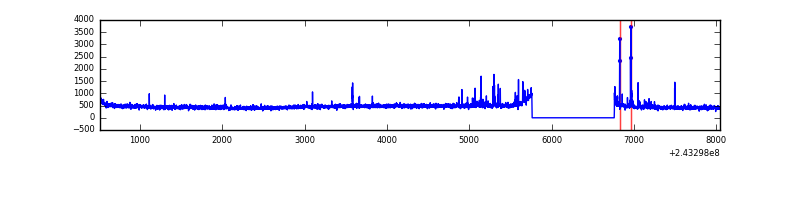 |
| D | 7528 | 6529 | 76 | 76 | 1.01% | 1.16% | 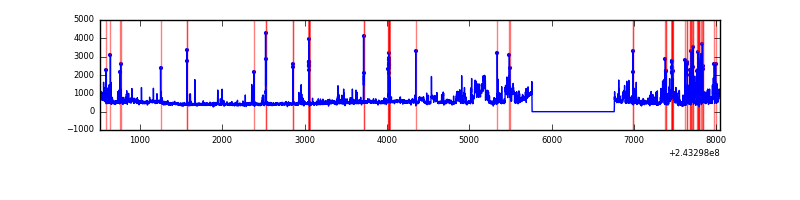 |
Top three noisy pixels from each quadrant. If the there are fewer than three noisy pixels in the level2.evt file, extra rows are filled as -1
| Pixel properties | Quadrant properties | ||||||
|---|---|---|---|---|---|---|---|
| Quadrant | DetID | PixID | Counts | Sigma | Mean | Median | Sigma |
| A | 15 | 239 | 734424 | 4590.92 | 777 | 763 | 159.8 |
| A | 15 | 223 | 139285 | 866.81 | 777 | 763 | 159.8 |
| A | 1 | 162 | 37237 | 228.24 | 777 | 763 | 159.8 |
| B | 4 | 239 | 1164321 | 7857.42 | 776 | 758 | 148.1 |
| B | 0 | 214 | 54741 | 364.54 | 776 | 758 | 148.1 |
| B | 12 | 111 | 15252 | 97.88 | 776 | 758 | 148.1 |
| C | 4 | 254 | 96927 | 550.61 | 759 | 768 | 174.6 |
| C | 4 | 175 | 10008 | 52.91 | 759 | 768 | 174.6 |
| C | 13 | 61 | 5703 | 28.26 | 759 | 768 | 174.6 |
| D | 14 | 34 | 438538 | 2397.56 | 748 | 729 | 182.6 |
| D | 1 | 20 | 399014 | 2181.11 | 748 | 729 | 182.6 |
| D | 8 | 195 | 136144 | 741.57 | 748 | 729 | 182.6 |
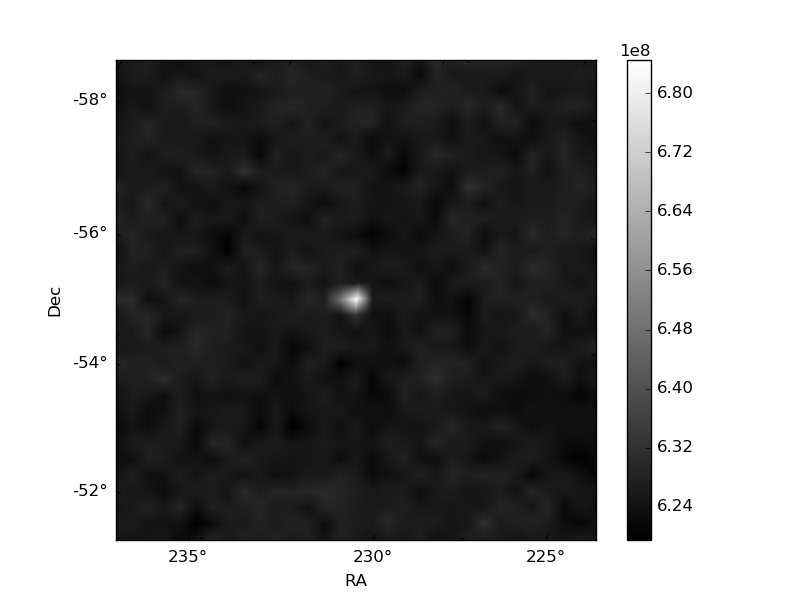
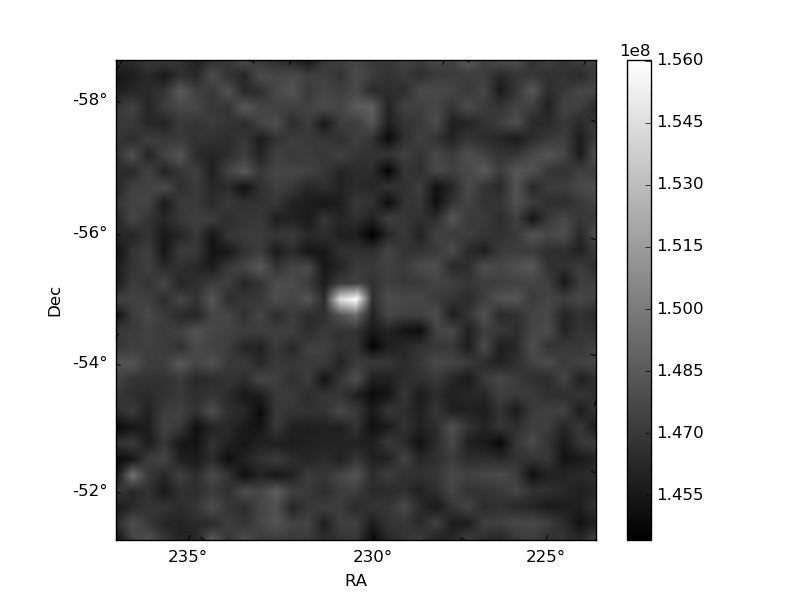
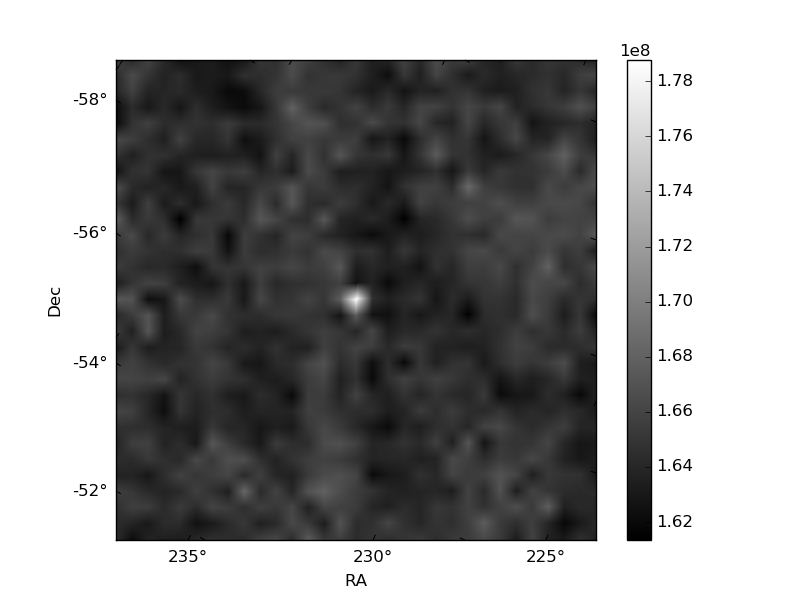
Histogram calculated using DETX and DETY for each event in the final _common_clean file
| Quadrant A | 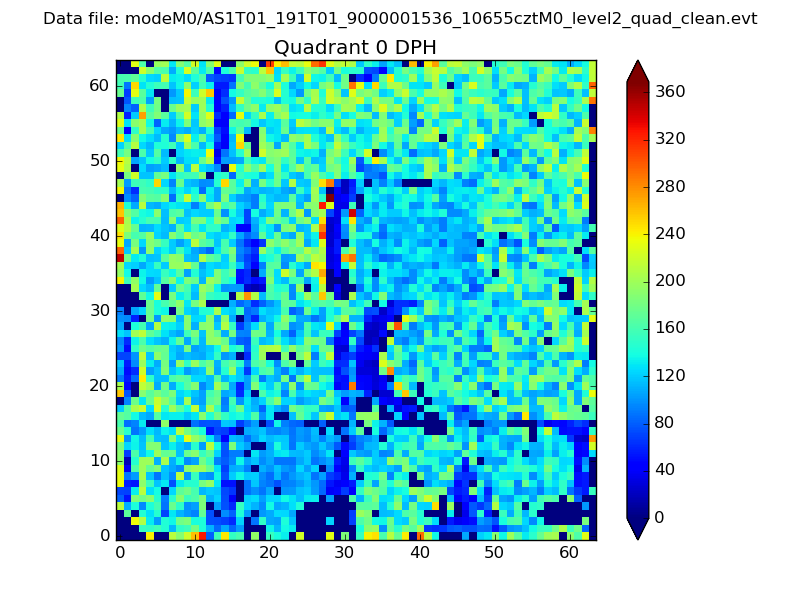 |
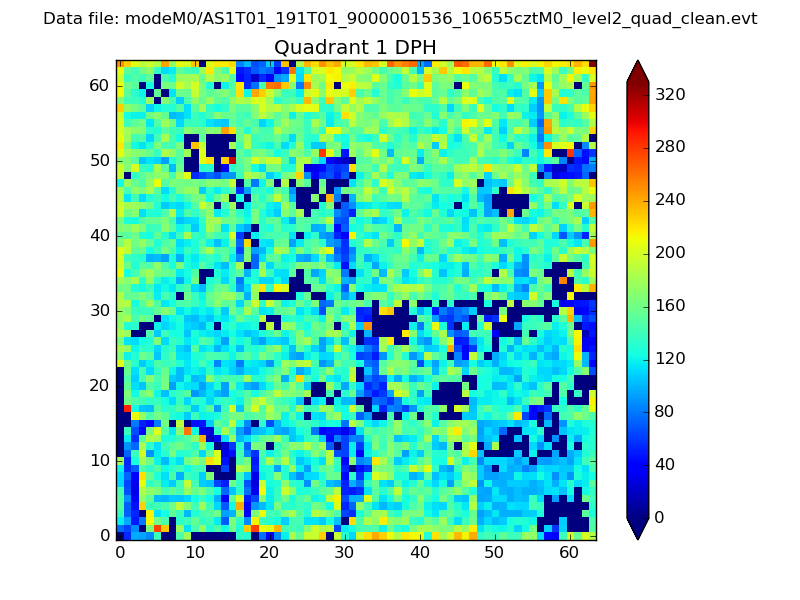 |
Quadrant B |
|---|---|---|---|
| Quadrant D | 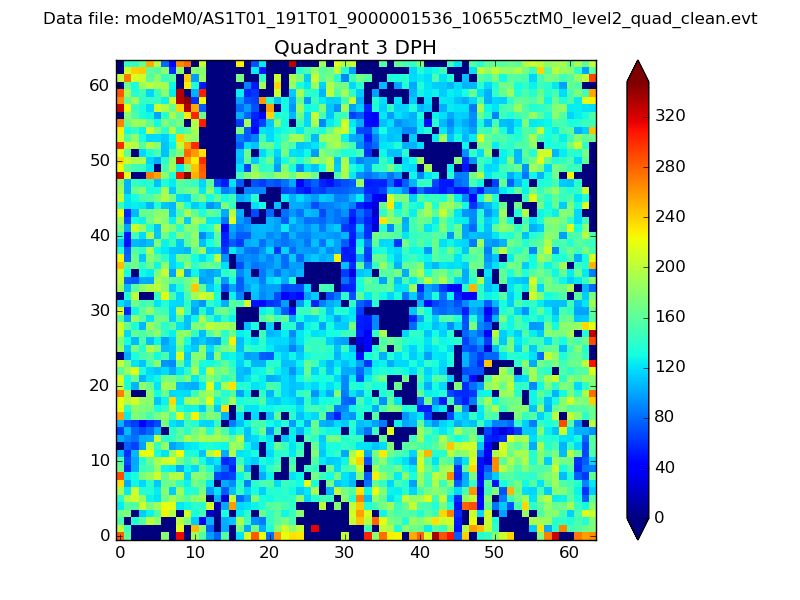 |
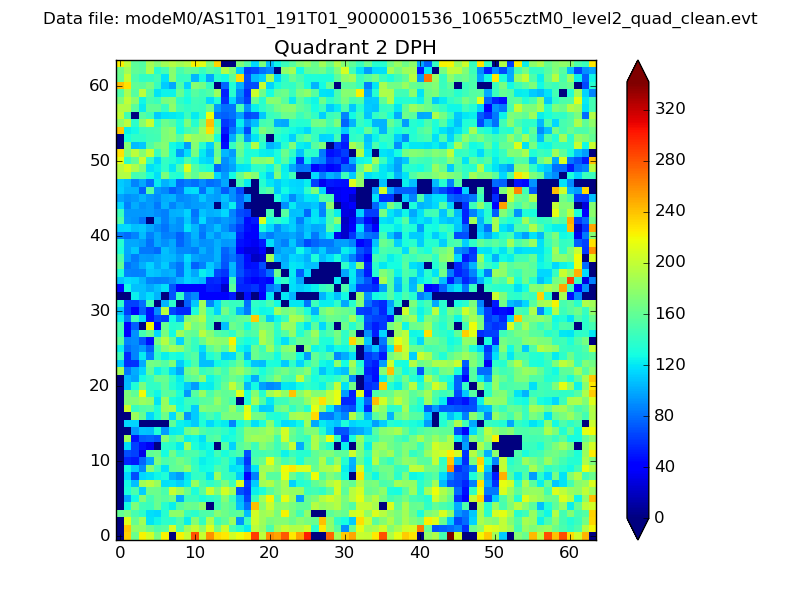 |
Quadrant C |
| Plot type | Count rate plots | Images |
|---|---|---|
| Comparison with Poisson distribution Blue bars denote a histogram of data divided into 1 sec bins. Red curve is a Poisson curve with rate = median count rate of data. |
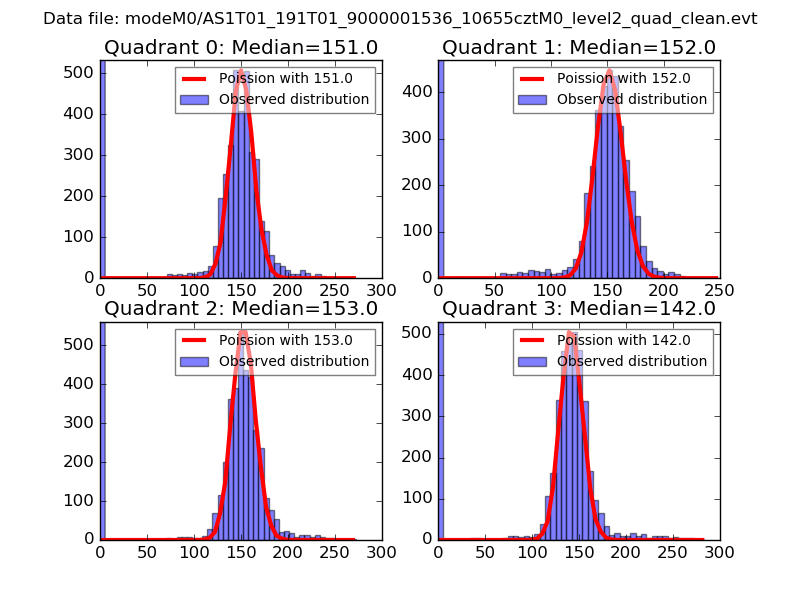 |
 |
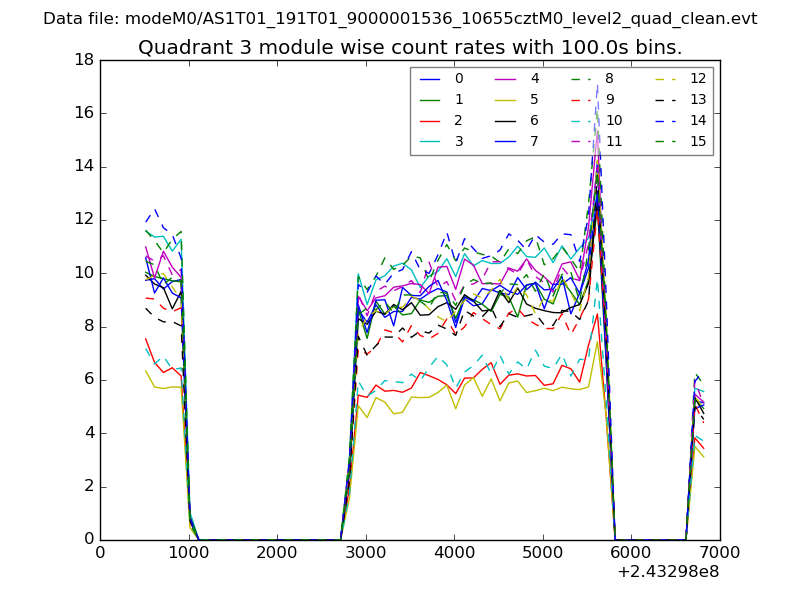
| Quadrant-wise count rates Data is divided into 100 sec bins |
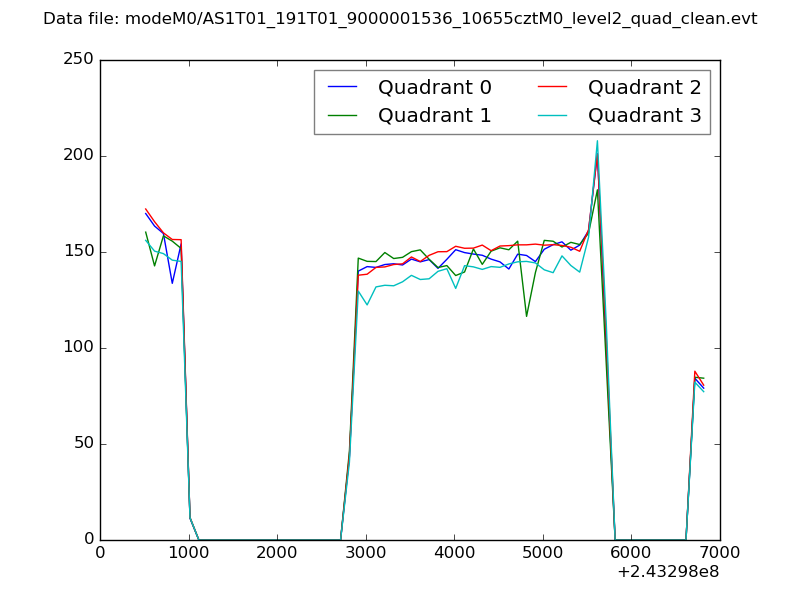 |
|
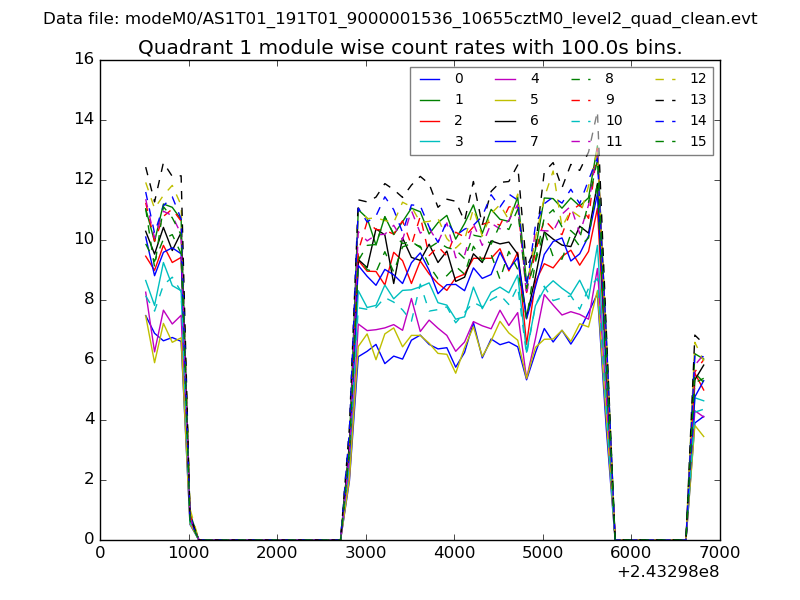
| Module-wise count rates for Quadrant A Data is divided into 100 sec bins |
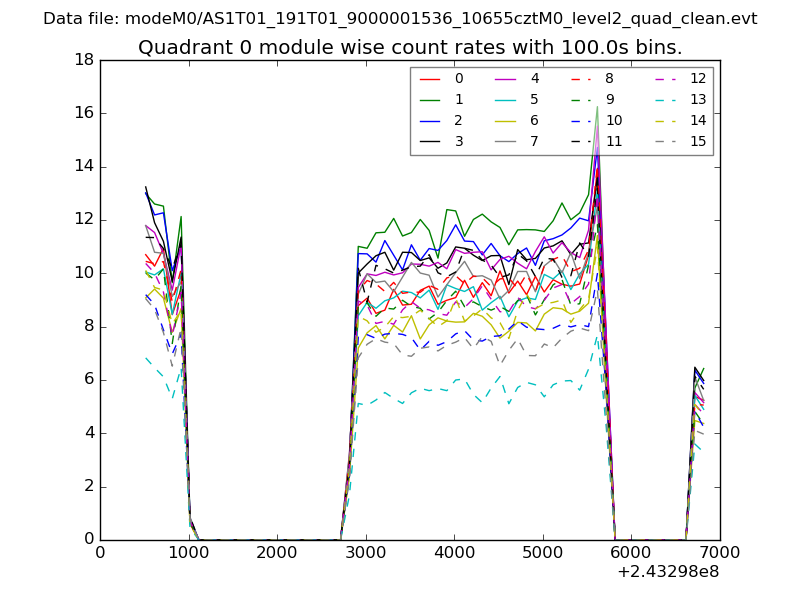 |
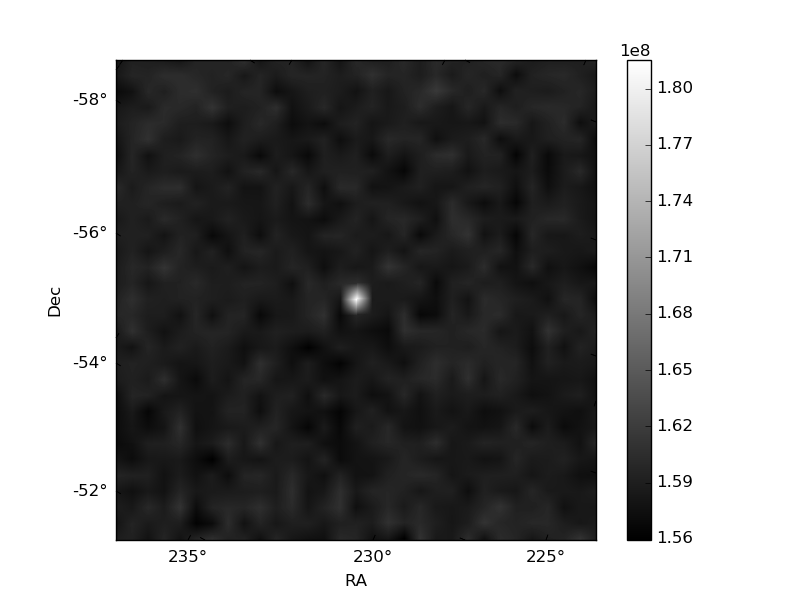 |
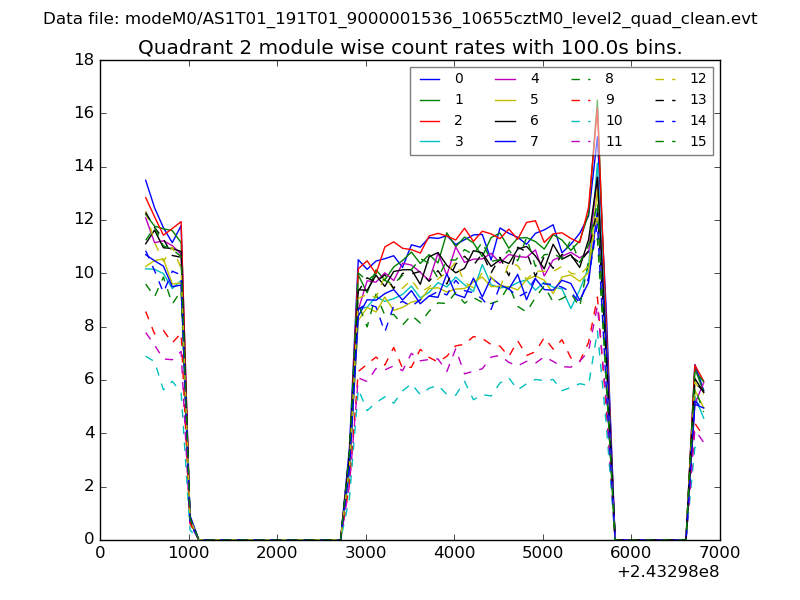
| Module-wise count rates for Quadrant B Data is divided into 100 sec bins |
 |
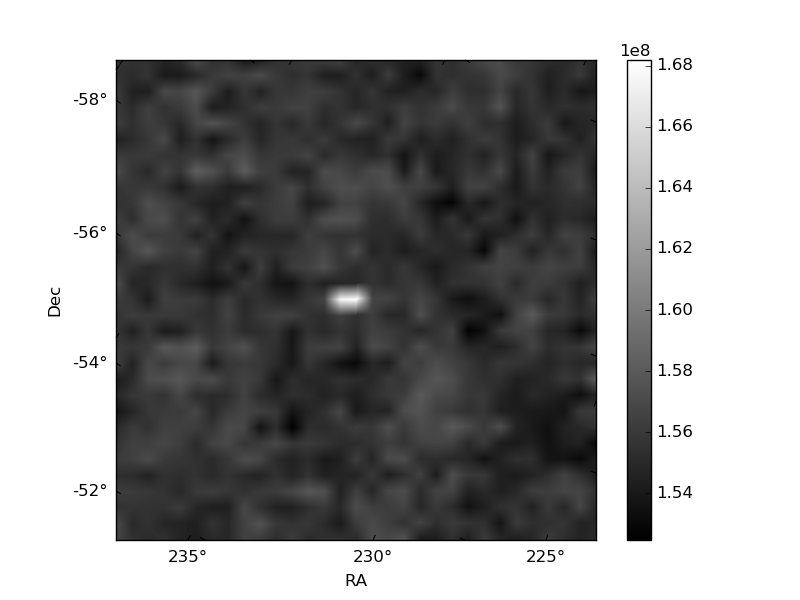 |
| Module-wise count rates for Quadrant C Data is divided into 100 sec bins |
 |
 |
| Module-wise count rates for Quadrant D Data is divided into 100 sec bins |
 |
 |
| Parameter | Plot |
|---|---|
| CZT HV Monitor | 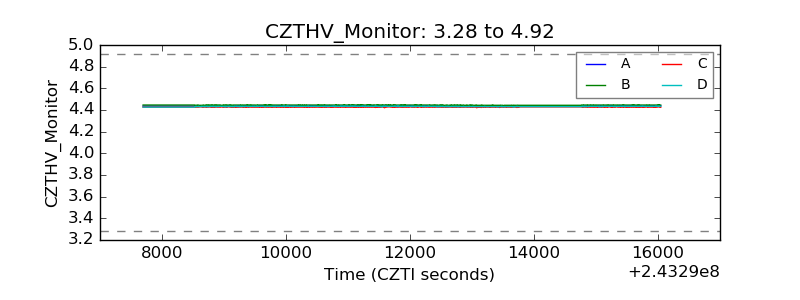 |
| D_VDD | 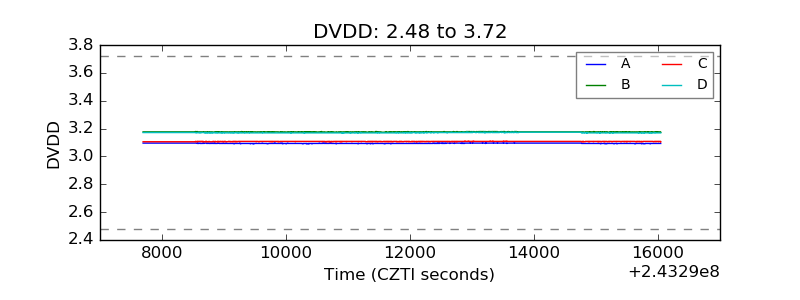 |
| Temperature 1 | 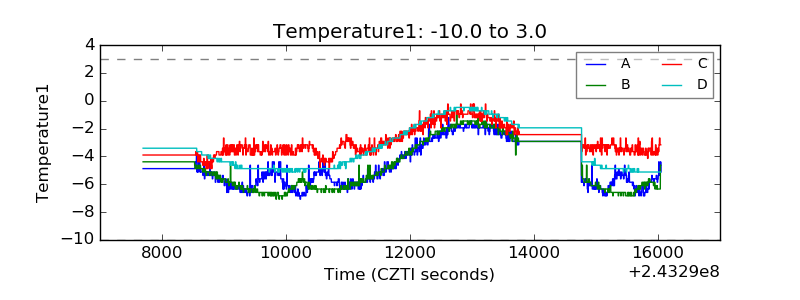 |
| Veto HV Monitor | 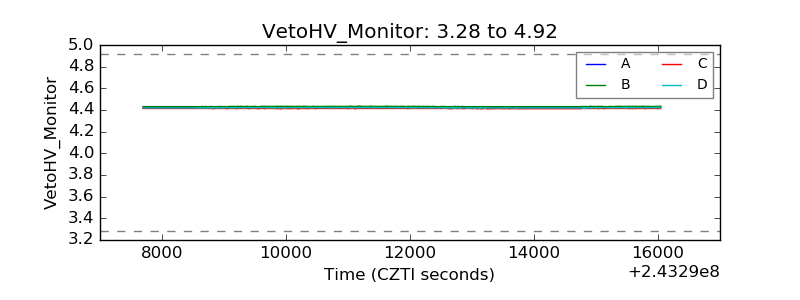 |
| Veto LLD | 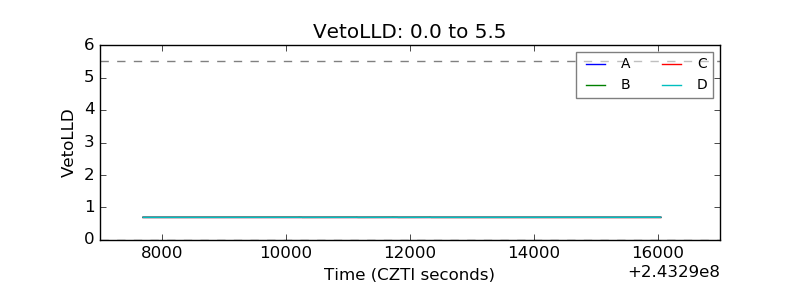 |
| Alpha Counter |  |
| _CPM_Rate | 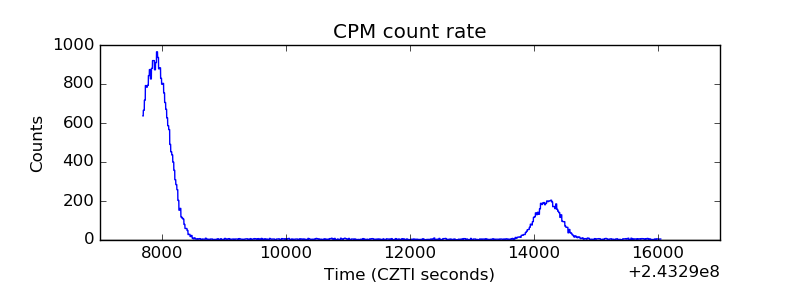 |
| CZT Counter | 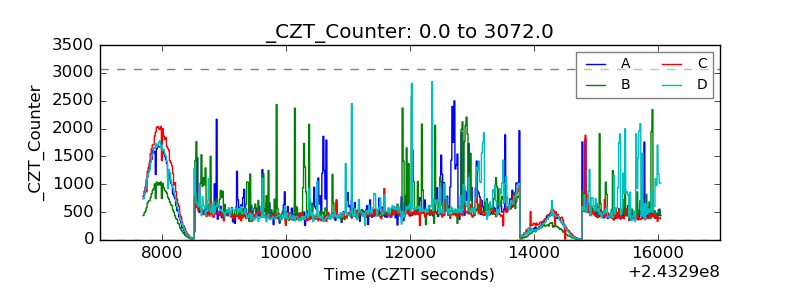 |
| +2.5 Volts monitor |  |
| +5 Volts monitor |  |
| _ROLL_ROT | 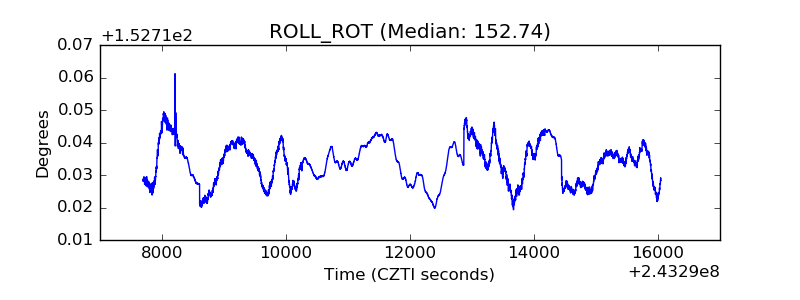 |
| _Roll_DEC | 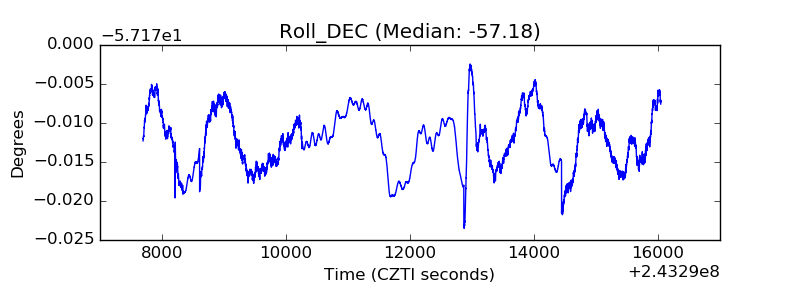 |
| _Roll_RA |  |
| Veto Counter | 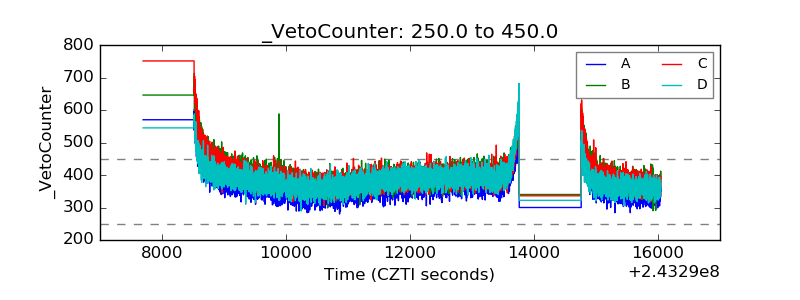 |