| Param | Original file | Final file |
|---|---|---|
| Filename | modeM0/AS1T01_191T01_9000001536_10657cztM0_level2.evt | modeM0/AS1T01_191T01_9000001536_10657cztM0_level2_quad_clean.evt |
| Size (bytes) | 385,914,240 | 65,033,280 |
| Size | 368.0 MB | 62.0 MB |
| Events in quadrant A | 3,036,757 | 410,246 |
| Events in quadrant B | 2,861,247 | 419,701 |
| Events in quadrant C | 2,269,787 | 426,418 |
| Events in quadrant D | 3,208,808 | 391,918 |
| Mode SS | |||
|---|---|---|---|
| Quadrant | BADHDUFLAG | Total packets | Discarded packets |
| A | 0 | 98 | 12 |
| B | 0 | 98 | 2 |
| C | 0 | 98 | 4 |
| D | 0 | 98 | 0 |
| Mode M0 | |||
|---|---|---|---|
| Quadrant | BADHDUFLAG | Total packets | Discarded packets |
| A | 0 | 13142 | 1199 |
| B | 0 | 12203 | 694 |
| C | 0 | 10536 | 656 |
| D | 0 | 13405 | 891 |
| Quadrant | Total seconds | Saturated seconds | Saturation percentage |
|---|---|---|---|
| A | 4511 | 179 | 3.968078% |
| B | 4578 | 181 | 3.953692% |
| C | 4586 | 49 | 1.068469% |
| D | 4537 | 127 | 2.799207% |
Noise dominated data is calculated using 1-second bins in cleaned event files. If a bin has >2000 counts, and if more than 50% of those come from <1% of pixels, then it is considered to be noise-dominated and hence unusable.
| Quadrant | # 1 sec bins | Bins with >0 counts | Bins with >2000 counts | High rate bins dominated by noise | Noise dominated (total time) | Noise dominated (detector-on time) | Marked lightcurve |
|---|---|---|---|---|---|---|---|
| A | 4872 | 4747 | 112 | 112 | 2.30% | 2.36% | 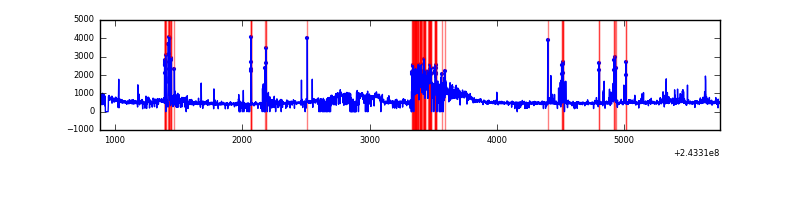 |
| B | 4872 | 4812 | 93 | 93 | 1.91% | 1.93% | 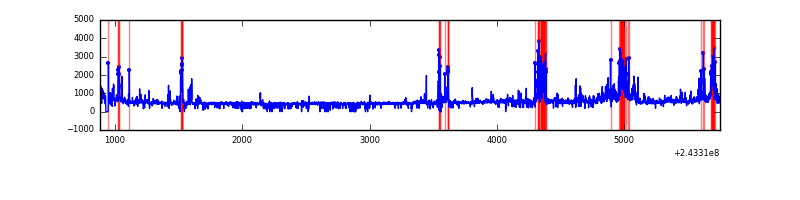 |
| C | 4871 | 4795 | 22 | 22 | 0.45% | 0.46% | 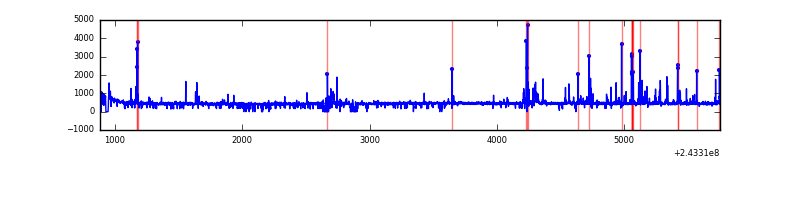 |
| D | 4872 | 4786 | 100 | 100 | 2.05% | 2.09% | 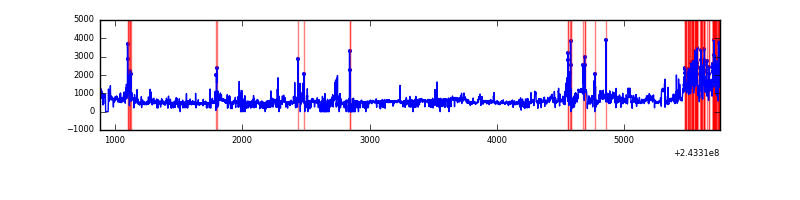 |
Top three noisy pixels from each quadrant. If the there are fewer than three noisy pixels in the level2.evt file, extra rows are filled as -1
| Pixel properties | Quadrant properties | ||||||
|---|---|---|---|---|---|---|---|
| Quadrant | DetID | PixID | Counts | Sigma | Mean | Median | Sigma |
| A | 15 | 239 | 771468 | 6971.84 | 522 | 513 | 110.6 |
| A | 15 | 223 | 100623 | 905.31 | 522 | 513 | 110.6 |
| A | 4 | 2 | 98576 | 886.8 | 522 | 513 | 110.6 |
| B | 4 | 239 | 479304 | 4654.54 | 531 | 521 | 102.9 |
| B | 10 | 245 | 132941 | 1287.34 | 531 | 521 | 102.9 |
| B | 15 | 204 | 110946 | 1073.51 | 531 | 521 | 102.9 |
| C | 4 | 254 | 228418 | 1866.91 | 519 | 525 | 122.1 |
| C | 14 | 234 | 9509 | 73.6 | 519 | 525 | 122.1 |
| C | 4 | 175 | 6670 | 50.34 | 519 | 525 | 122.1 |
| D | 1 | 20 | 523957 | 4173.11 | 507 | 492 | 125.4 |
| D | 12 | 233 | 305538 | 2431.85 | 507 | 492 | 125.4 |
| D | 14 | 34 | 200132 | 1591.55 | 507 | 492 | 125.4 |
Histogram calculated using DETX and DETY for each event in the final _common_clean file
| Quadrant A | 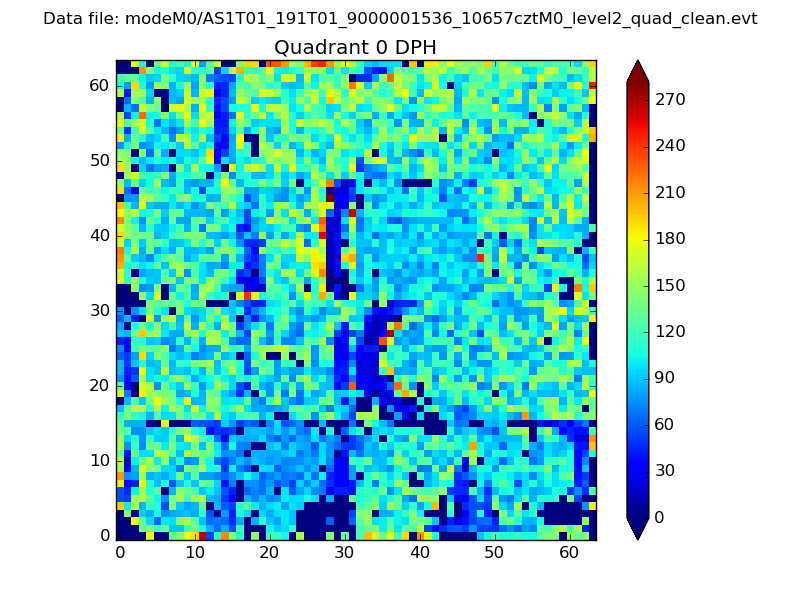 |
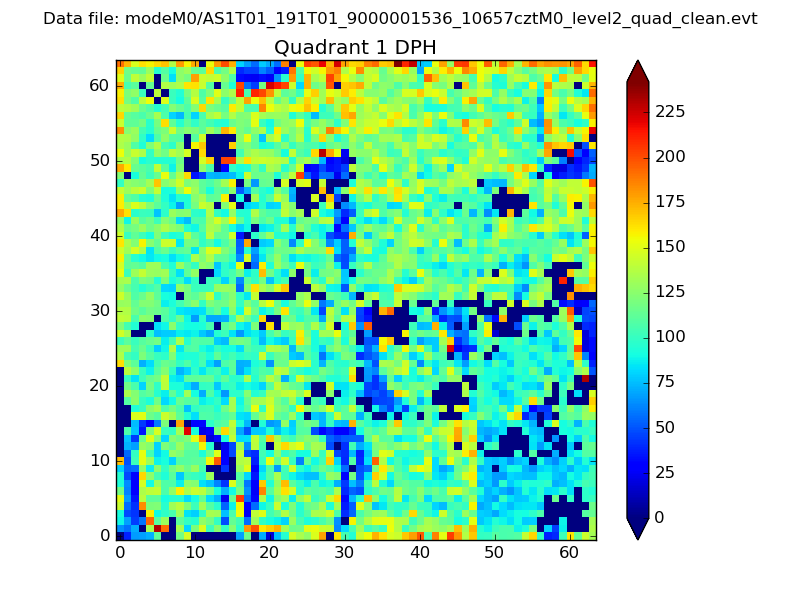 |
Quadrant B |
|---|---|---|---|
| Quadrant D | 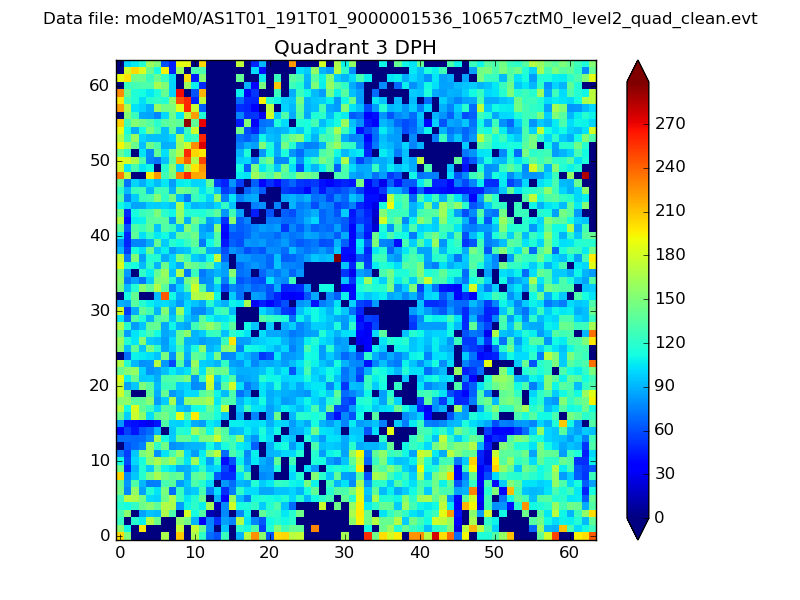 |
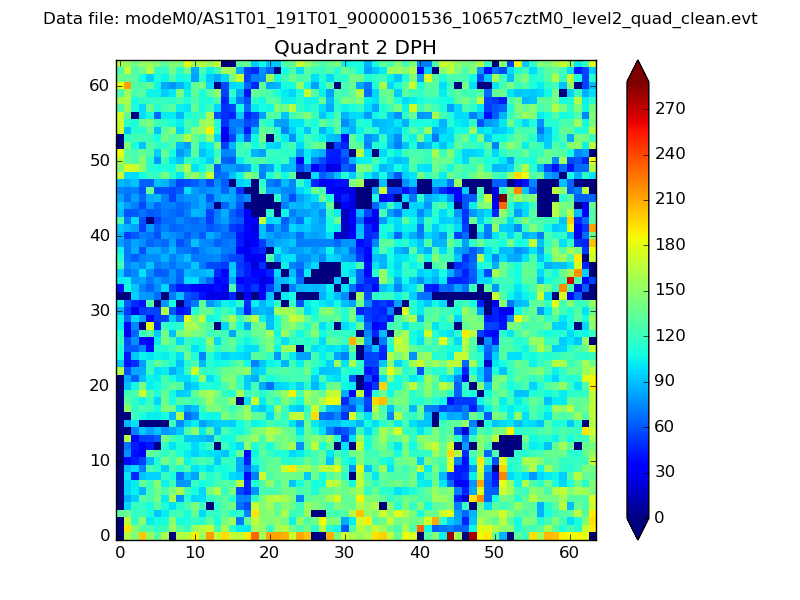 |
Quadrant C |
| Plot type | Count rate plots | Images |
|---|---|---|
| Comparison with Poisson distribution Blue bars denote a histogram of data divided into 1 sec bins. Red curve is a Poisson curve with rate = median count rate of data. |
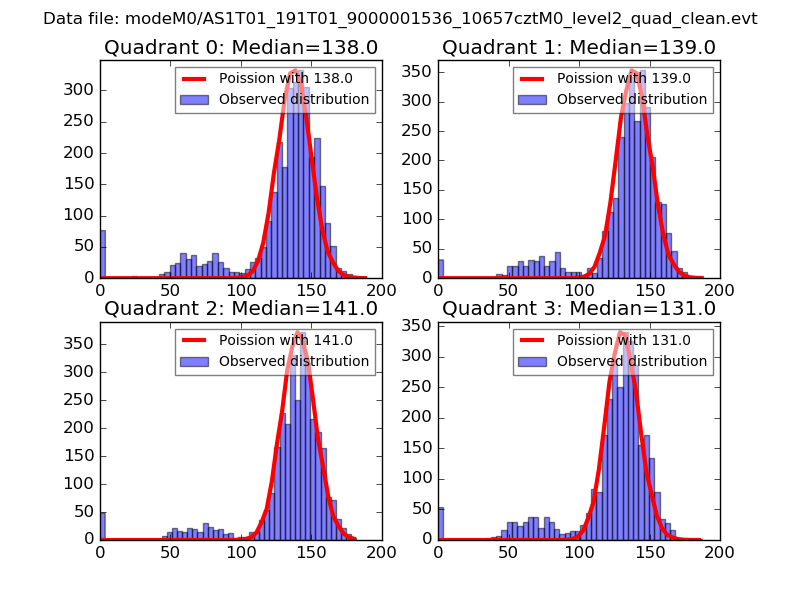 |
 |
| Quadrant-wise count rates Data is divided into 100 sec bins |
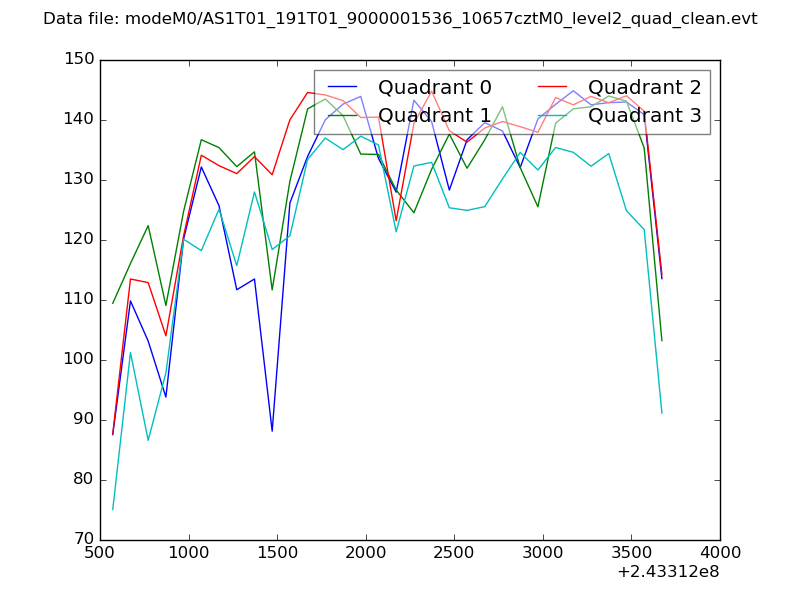 |
|
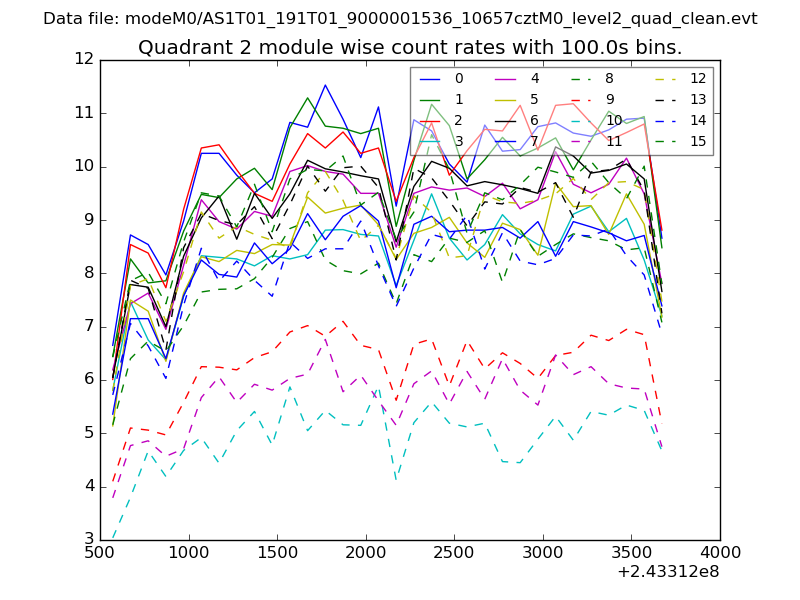
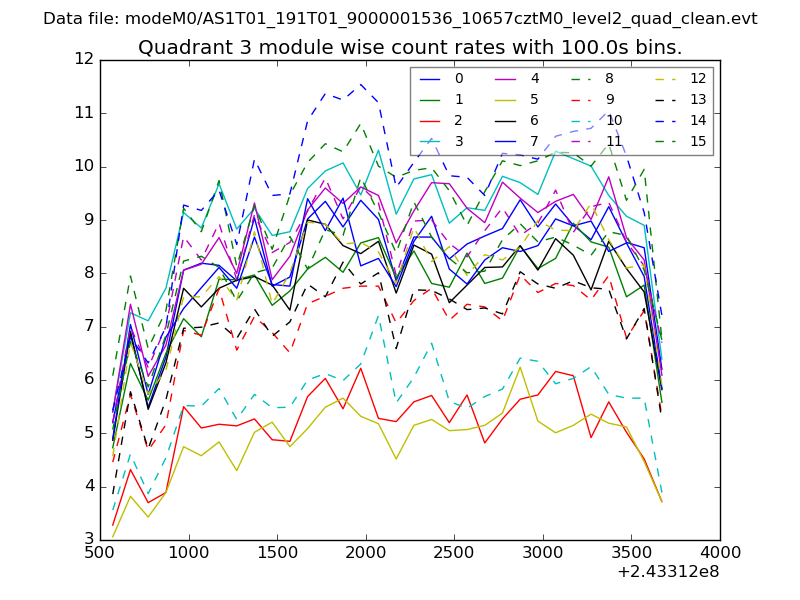
| Module-wise count rates for Quadrant A Data is divided into 100 sec bins |
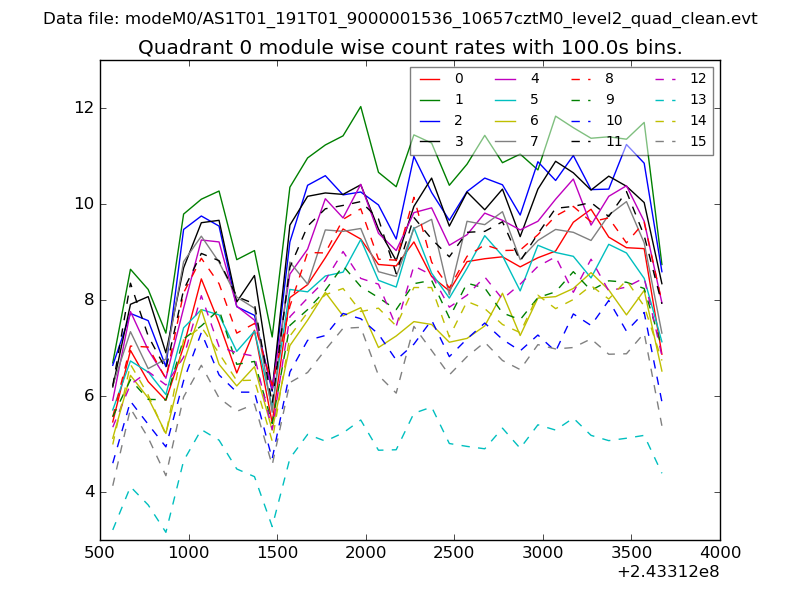 |
 |
| Module-wise count rates for Quadrant B Data is divided into 100 sec bins |
 |
 |
| Module-wise count rates for Quadrant C Data is divided into 100 sec bins |
 |
 |
| Module-wise count rates for Quadrant D Data is divided into 100 sec bins |
 |
 |
| Parameter | Plot |
|---|---|
| CZT HV Monitor | 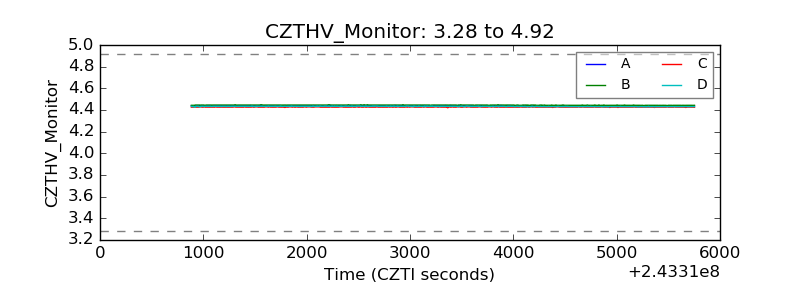 |
| D_VDD | 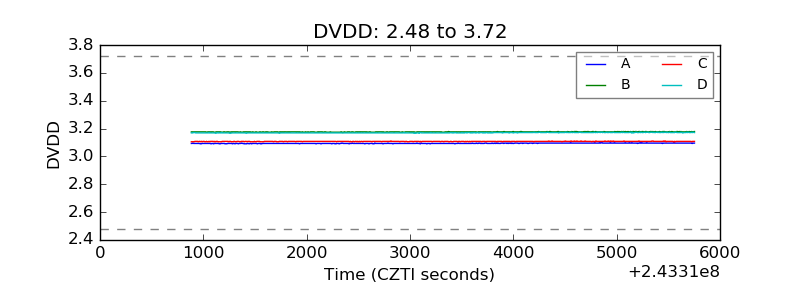 |
| Temperature 1 | 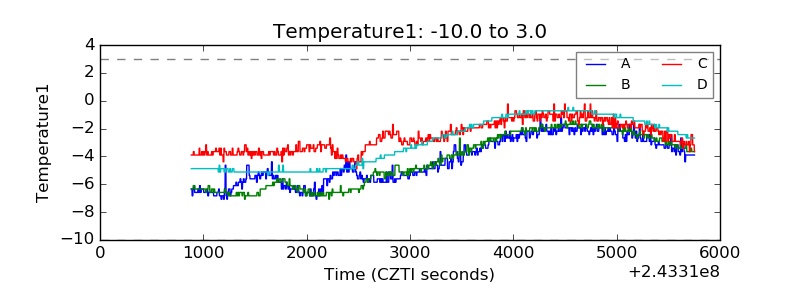 |
| Veto HV Monitor | 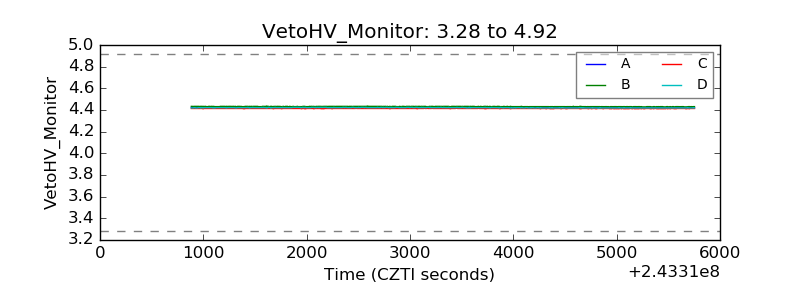 |
| Veto LLD |  |
| Alpha Counter | 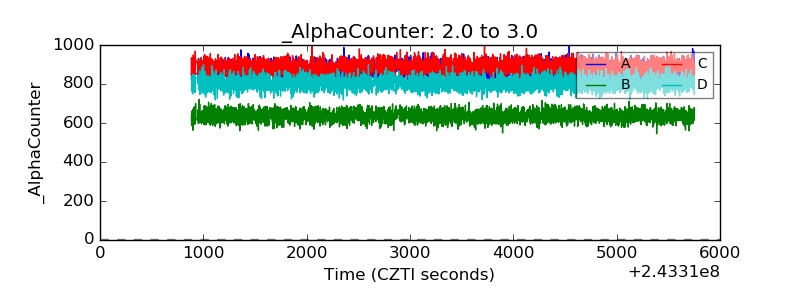 |
| _CPM_Rate | 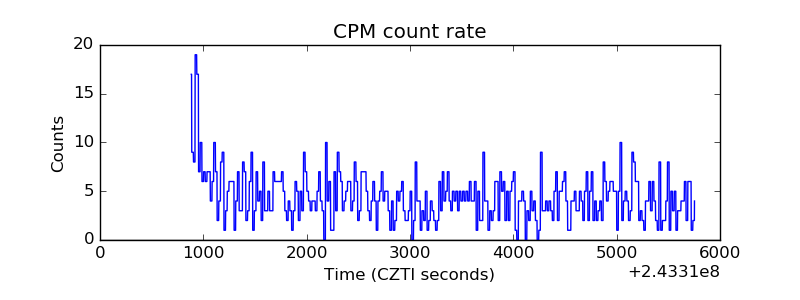 |
| CZT Counter | 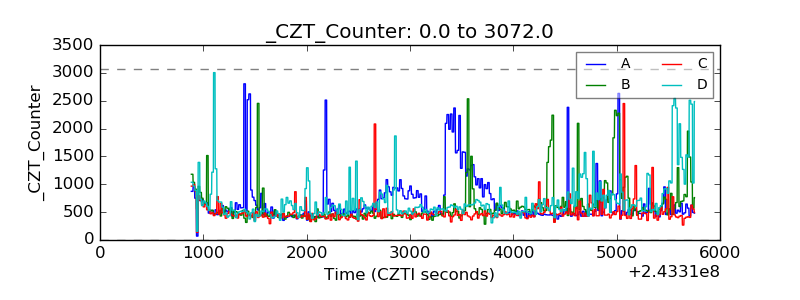 |
| +2.5 Volts monitor |  |
| +5 Volts monitor | 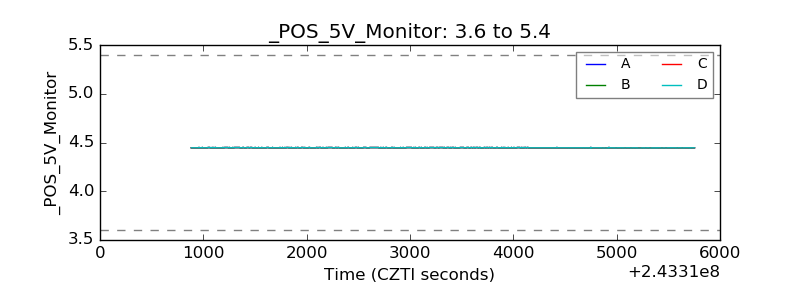 |
| _ROLL_ROT | 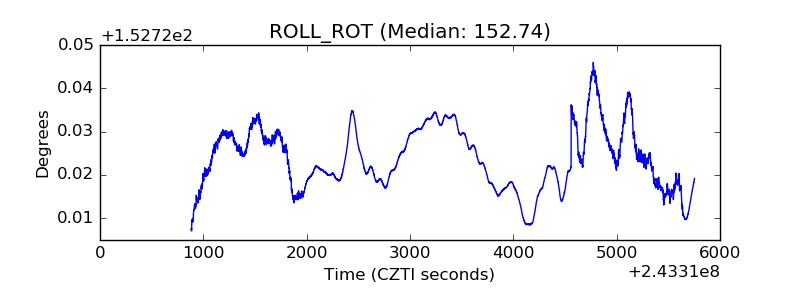 |
| _Roll_DEC | 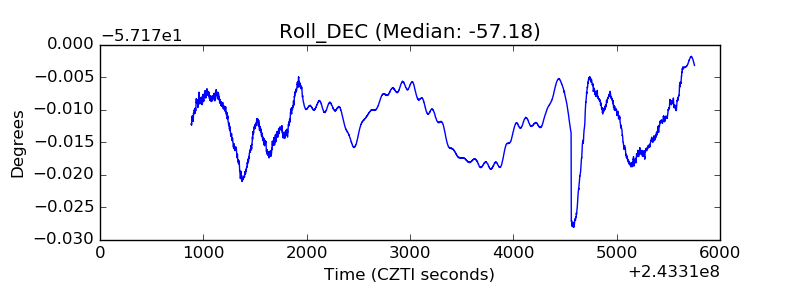 |
| _Roll_RA |  |
| Veto Counter | 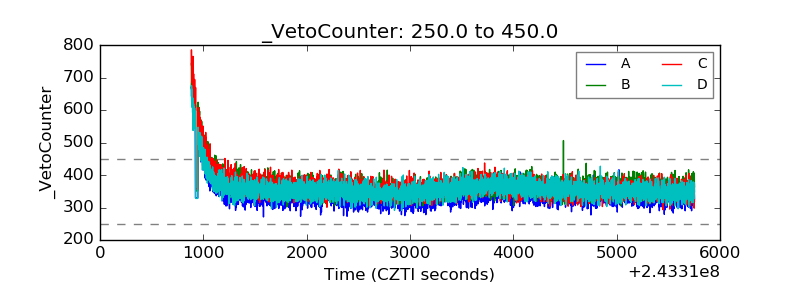 |