| Param | Original file | Final file |
|---|---|---|
| Filename | modeM0/AS1A03_097T01_9000001540cztM0_level2.fits | modeM0/AS1A03_097T01_9000001540cztM0_level2_quad_clean.evt |
| Size (bytes) | 1,759,138,560 | 1,637,893,440 |
| Size | 1.6 GB | 1.5 GB |
| Events in quadrant A | 10,303,190 | 9,209,358 |
| Events in quadrant B | 10,214,300 | 9,595,454 |
| Events in quadrant C | 10,662,982 | 9,507,294 |
| Events in quadrant D | 8,884,086 | 8,095,097 |
| Mode M9 | |||
|---|---|---|---|
| Quadrant | BADHDUFLAG | Total packets | Discarded packets |
| A | 0 | 317 | 0 |
| B | 0 | 317 | 0 |
| C | 0 | 317 | 0 |
| D | 0 | 317 | 0 |
| Mode M0 | |||
|---|---|---|---|
| Quadrant | BADHDUFLAG | Total packets | Discarded packets |
| A | 0 | 488437 | 0 |
| B | 0 | 518798 | 0 |
| C | 0 | 406757 | 0 |
| D | 0 | 572628 | 0 |
| Mode SS | |||
|---|---|---|---|
| Quadrant | BADHDUFLAG | Total packets | Discarded packets |
| A | 0 | 3920 | 0 |
| B | 0 | 3920 | 0 |
| C | 0 | 3920 | 0 |
| D | 0 | 3918 | 0 |
| Quadrant | Total seconds | Saturated seconds | Saturation percentage |
|---|---|---|---|
| A | 192635 | 13871 | 7.200664% |
| B | 192640 | 11816 | 6.133721% |
| C | 192647 | 2399 | 1.245283% |
| D | 192645 | 12095 | 6.278388% |
Noise dominated data is calculated using 1-second bins in cleaned event files. If a bin has >2000 counts, and if more than 50% of those come from <1% of pixels, then it is considered to be noise-dominated and hence unusable.
| Quadrant | # 1 sec bins | Bins with >0 counts | Bins with >2000 counts | High rate bins dominated by noise | Noise dominated (total time) | Noise dominated (detector-on time) | Marked lightcurve |
|---|---|---|---|---|---|---|---|
| A | 223795 | 191653 | 0 | 0 | 0.00% | 0.00% | 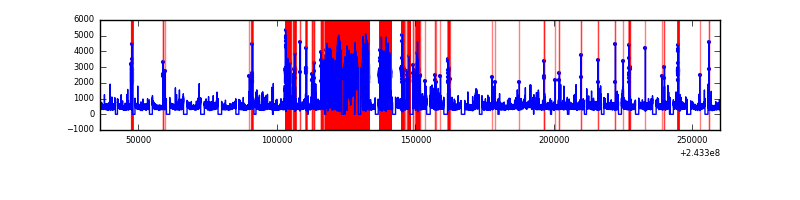 |
| B | 223796 | 192609 | 0 | 0 | 0.00% | 0.00% |  |
| C | 223795 | 192622 | 0 | 0 | 0.00% | 0.00% |  |
| D | 223795 | 192570 | 0 | 0 | 0.00% | 0.00% |  |
Top three noisy pixels from each quadrant. If the there are fewer than three noisy pixels in the level2.evt file, extra rows are filled as -1
| Pixel properties | Quadrant properties | ||||||
|---|---|---|---|---|---|---|---|
| Quadrant | DetID | PixID | Counts | Sigma | Mean | Median | Sigma |
| A | 0 | 29 | 9926 | 11.11 | 2682 | 2509 | 667.4 |
| A | 7 | 110 | 8570 | 9.08 | 2682 | 2509 | 667.4 |
| A | 9 | 19 | 7862 | 8.02 | 2682 | 2509 | 667.4 |
| B | 2 | 9 | 8798 | 11.75 | 2695 | 2565 | 530.5 |
| B | 3 | 17 | 6920 | 8.21 | 2695 | 2565 | 530.5 |
| B | 12 | 226 | 6811 | 8.0 | 2695 | 2565 | 530.5 |
| C | 1 | 80 | 8140 | 7.57 | 2817 | 2617 | 729.4 |
| C | 1 | 81 | 7981 | 7.35 | 2817 | 2617 | 729.4 |
| C | 12 | 241 | 7367 | 6.51 | 2817 | 2617 | 729.4 |
| D | 3 | 14 | 6469 | 6.17 | 2537 | 2299 | 676.1 |
| D | 6 | 231 | 6427 | 6.1 | 2537 | 2299 | 676.1 |
| D | 10 | 189 | 6322 | 5.95 | 2537 | 2299 | 676.1 |
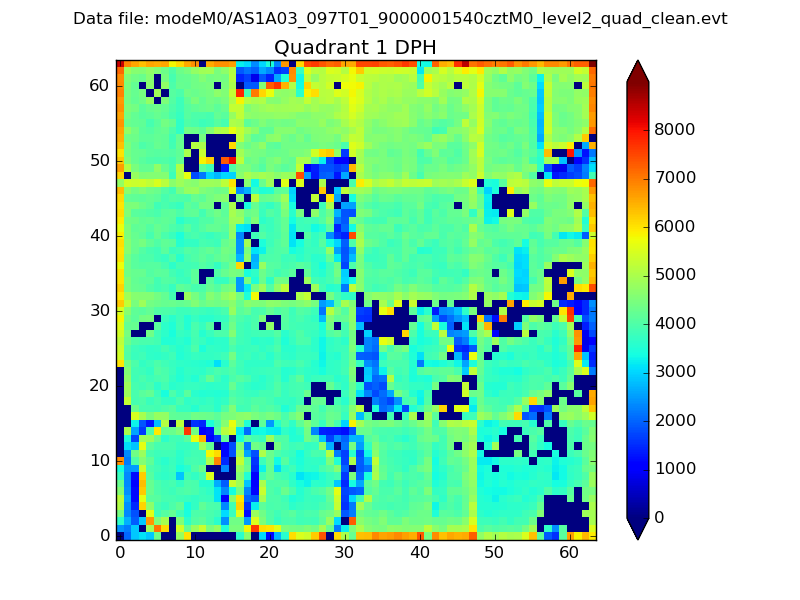
Histogram calculated using DETX and DETY for each event in the final _common_clean file
| Quadrant A |  |
 |
Quadrant B |
|---|---|---|---|
| Quadrant D |  |
 |
Quadrant C |
| Plot type | Count rate plots | Images |
|---|---|---|
| Comparison with Poisson distribution Blue bars denote a histogram of data divided into 1 sec bins. Red curve is a Poisson curve with rate = median count rate of data. |
 |
 |
| Quadrant-wise count rates Data is divided into 100 sec bins |
 |
|
| Module-wise count rates for Quadrant A Data is divided into 100 sec bins |
 |
 |
| Module-wise count rates for Quadrant B Data is divided into 100 sec bins |
 |
 |
| Module-wise count rates for Quadrant C Data is divided into 100 sec bins |
 |
 |
| Module-wise count rates for Quadrant D Data is divided into 100 sec bins |
 |
 |
| Parameter | Plot |
|---|---|
| CZT HV Monitor |  |
| D_VDD |  |
| Temperature 1 |  |
| Veto HV Monitor | 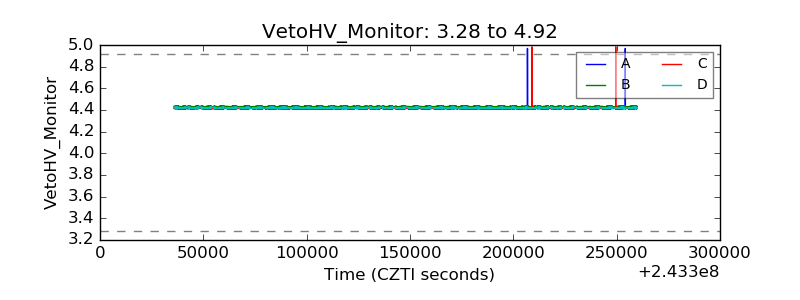 |
| Veto LLD |  |
| Alpha Counter |  |
| _CPM_Rate |  |
| CZT Counter |  |
| +2.5 Volts monitor |  |
| +5 Volts monitor |  |
| _ROLL_ROT | 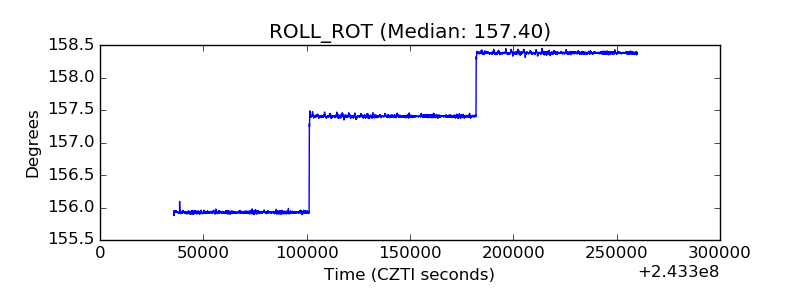 |
| _Roll_DEC |  |
| _Roll_RA |  |
| Veto Counter | 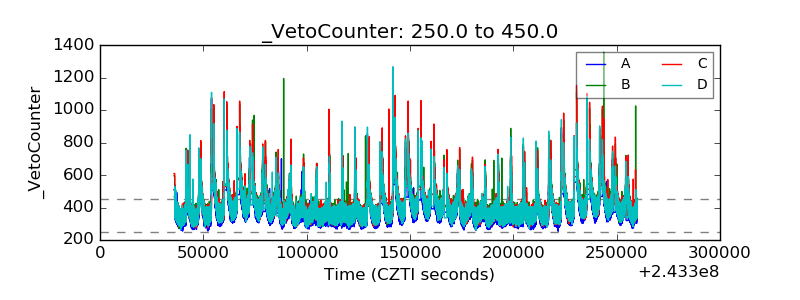 |