| Param | Original file | Final file |
|---|---|---|
| Filename | modeM0/AS1A03_097T01_9000001540_10661cztM0_level2.evt | modeM0/AS1A03_097T01_9000001540_10661cztM0_level2_quad_clean.evt |
| Size (bytes) | 560,157,120 | 88,208,640 |
| Size | 534.2 MB | 84.1 MB |
| Events in quadrant A | 3,319,600 | 555,592 |
| Events in quadrant B | 4,592,000 | 551,191 |
| Events in quadrant C | 3,448,525 | 551,535 |
| Events in quadrant D | 5,119,393 | 514,715 |
| Mode M9 | |||
|---|---|---|---|
| Quadrant | BADHDUFLAG | Total packets | Discarded packets |
| A | 0 | 12 | 0 |
| B | 0 | 12 | 0 |
| C | 0 | 12 | 0 |
| D | 0 | 12 | 0 |
| Mode M0 | |||
|---|---|---|---|
| Quadrant | BADHDUFLAG | Total packets | Discarded packets |
| A | 0 | 14624 | 3 |
| B | 0 | 18159 | 2 |
| C | 0 | 15137 | 2 |
| D | 0 | 19878 | 2 |
| Mode SS | |||
|---|---|---|---|
| Quadrant | BADHDUFLAG | Total packets | Discarded packets |
| A | 0 | 144 | 0 |
| B | 0 | 144 | 0 |
| C | 0 | 144 | 0 |
| D | 0 | 144 | 0 |
| Quadrant | Total seconds | Saturated seconds | Saturation percentage |
|---|---|---|---|
| A | 7156 | 76 | 1.062046% |
| B | 7156 | 291 | 4.066518% |
| C | 7156 | 68 | 0.950252% |
| D | 7156 | 301 | 4.206260% |
Noise dominated data is calculated using 1-second bins in cleaned event files. If a bin has >2000 counts, and if more than 50% of those come from <1% of pixels, then it is considered to be noise-dominated and hence unusable.
| Quadrant | # 1 sec bins | Bins with >0 counts | Bins with >2000 counts | High rate bins dominated by noise | Noise dominated (total time) | Noise dominated (detector-on time) | Marked lightcurve |
|---|---|---|---|---|---|---|---|
| A | 7916 | 7156 | 0 | 0 | 0.00% | 0.00% | 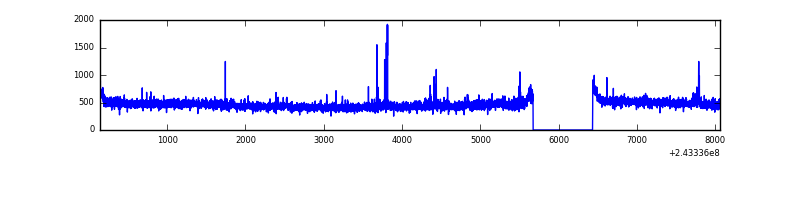 |
| B | 7916 | 7157 | 147 | 147 | 1.86% | 2.05% | 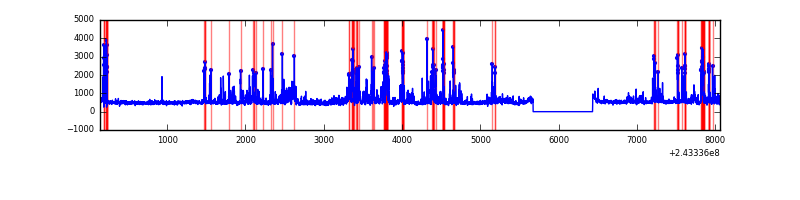 |
| C | 7916 | 7157 | 16 | 16 | 0.20% | 0.22% | 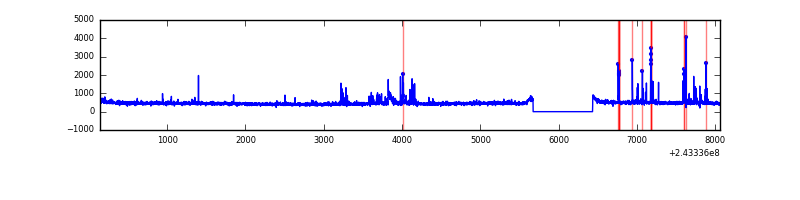 |
| D | 7916 | 7156 | 245 | 245 | 3.09% | 3.42% | 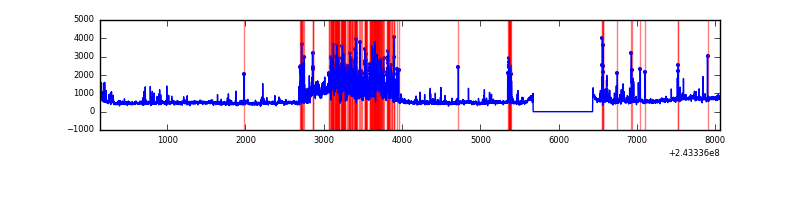 |
Top three noisy pixels from each quadrant. If the there are fewer than three noisy pixels in the level2.evt file, extra rows are filled as -1
| Pixel properties | Quadrant properties | ||||||
|---|---|---|---|---|---|---|---|
| Quadrant | DetID | PixID | Counts | Sigma | Mean | Median | Sigma |
| A | 4 | 2 | 44246 | 252.53 | 841 | 821 | 172.0 |
| A | 1 | 162 | 13454 | 73.46 | 841 | 821 | 172.0 |
| A | 11 | 29 | 7988 | 41.68 | 841 | 821 | 172.0 |
| B | 4 | 239 | 867159 | 5400.52 | 833 | 813 | 160.4 |
| B | 4 | 81 | 187639 | 1164.61 | 833 | 813 | 160.4 |
| B | 15 | 204 | 174432 | 1082.28 | 833 | 813 | 160.4 |
| C | 4 | 254 | 230659 | 1206.05 | 815 | 818 | 190.6 |
| C | 4 | 175 | 27291 | 138.91 | 815 | 818 | 190.6 |
| C | 14 | 234 | 14046 | 69.41 | 815 | 818 | 190.6 |
| D | 12 | 233 | 812979 | 4177.09 | 803 | 780 | 194.4 |
| D | 1 | 20 | 548465 | 2816.71 | 803 | 780 | 194.4 |
| D | 8 | 195 | 231577 | 1186.97 | 803 | 780 | 194.4 |
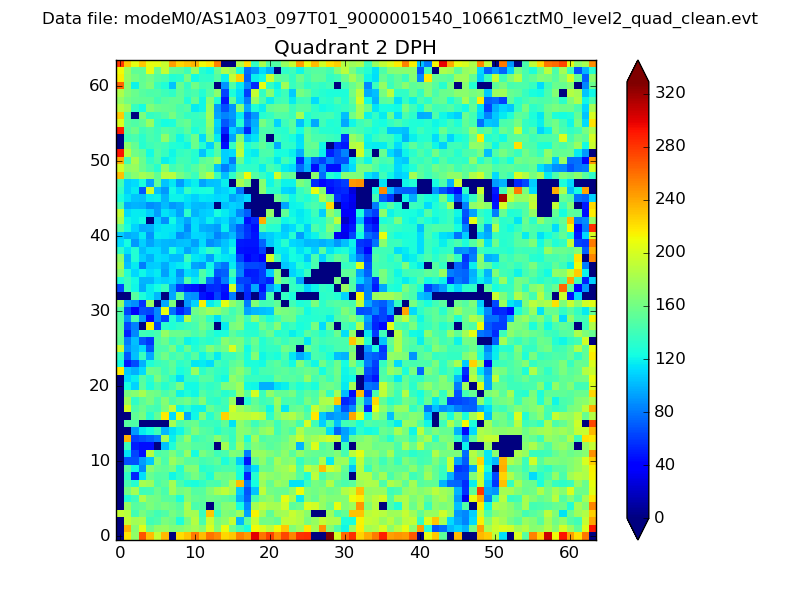
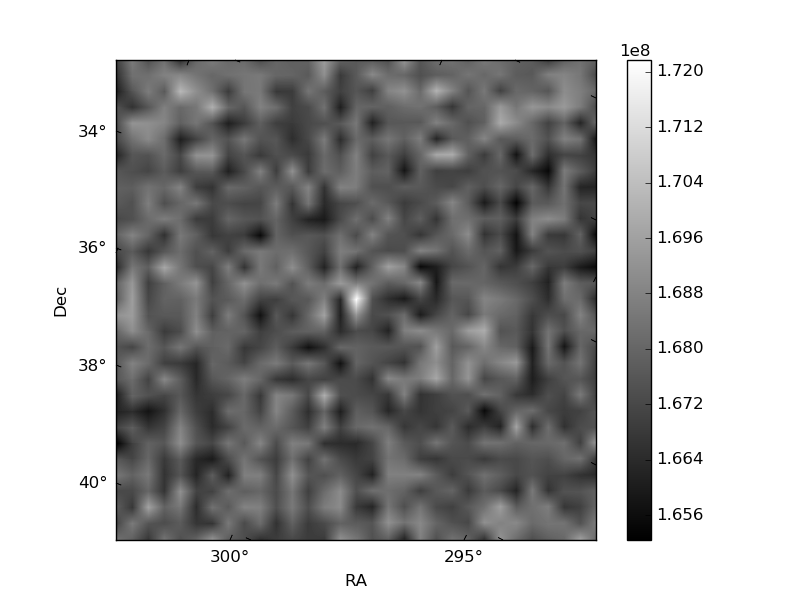
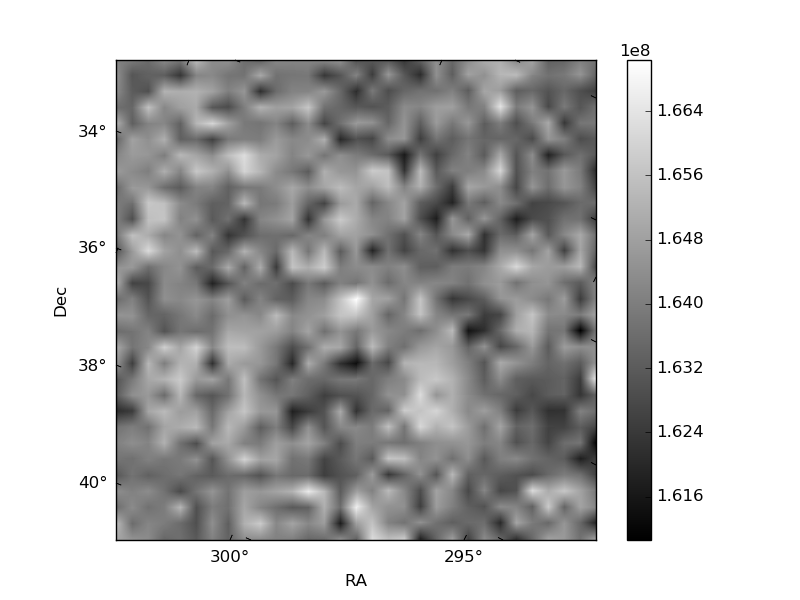
Histogram calculated using DETX and DETY for each event in the final _common_clean file
| Quadrant A | 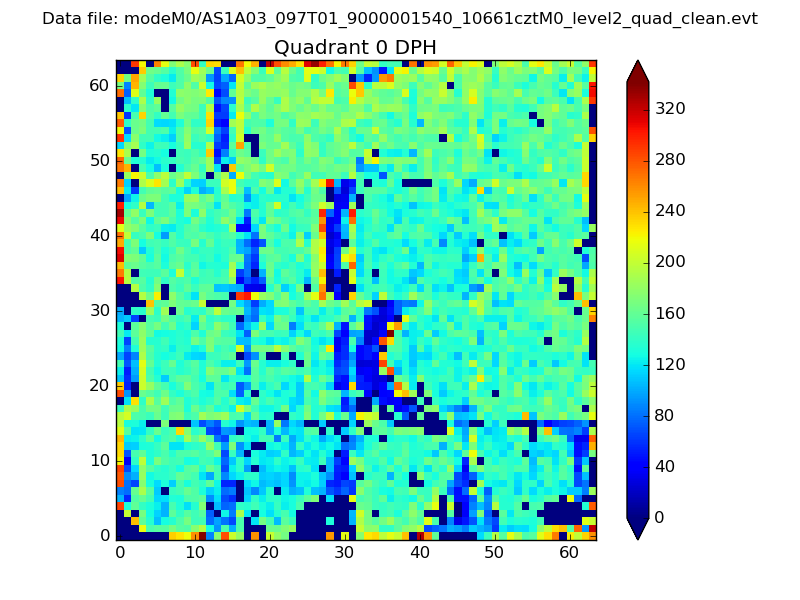 |
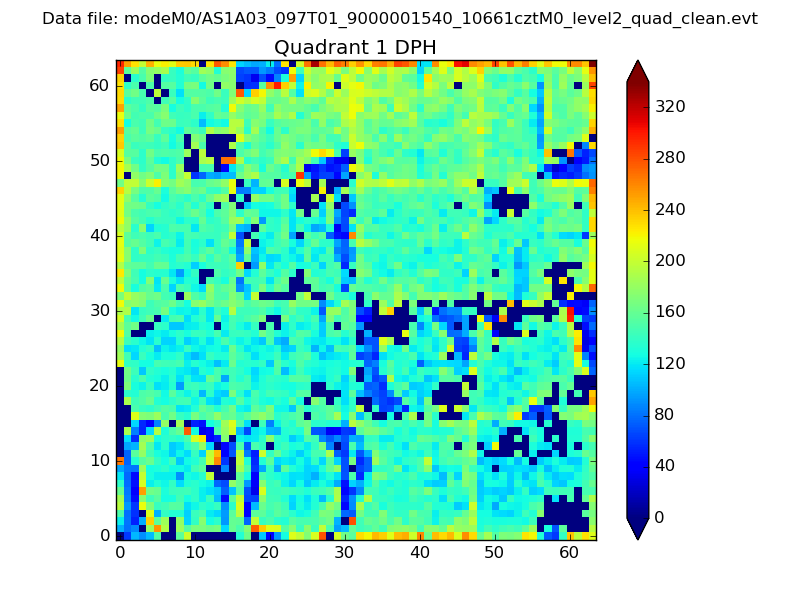 |
Quadrant B |
|---|---|---|---|
| Quadrant D | 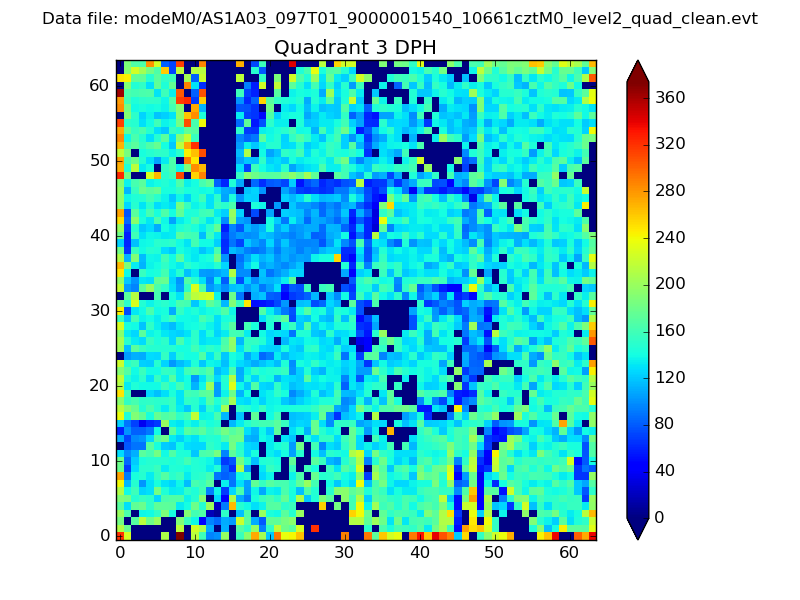 |
 |
Quadrant C |
| Plot type | Count rate plots | Images |
|---|---|---|
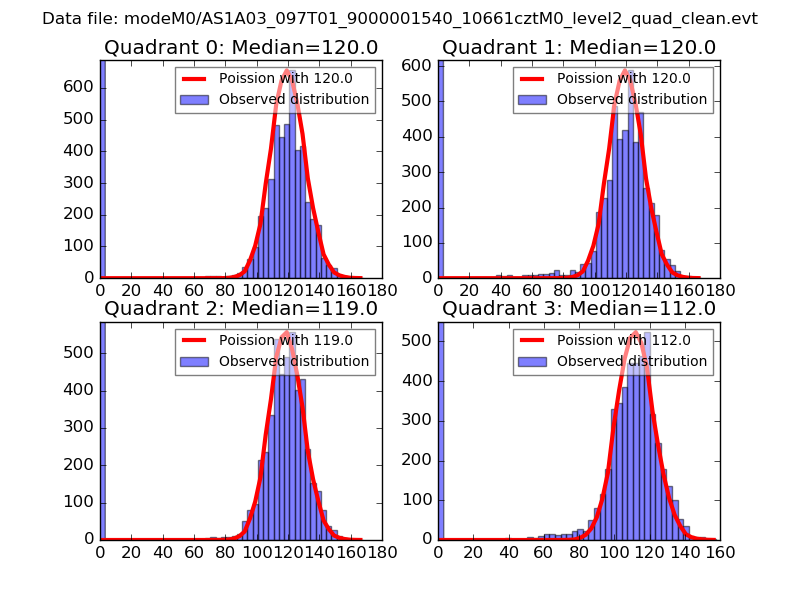
| Comparison with Poisson distribution Blue bars denote a histogram of data divided into 1 sec bins. Red curve is a Poisson curve with rate = median count rate of data. |
 |
 |
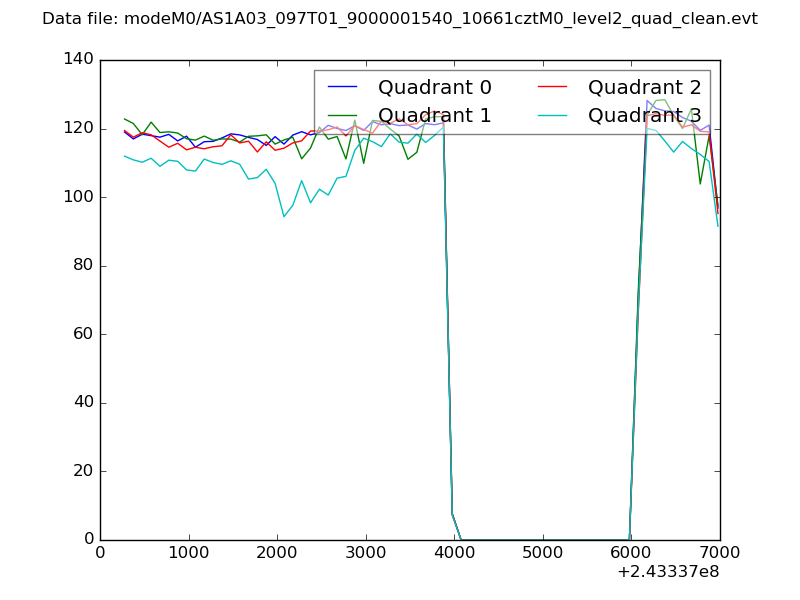
| Quadrant-wise count rates Data is divided into 100 sec bins |
 |
|
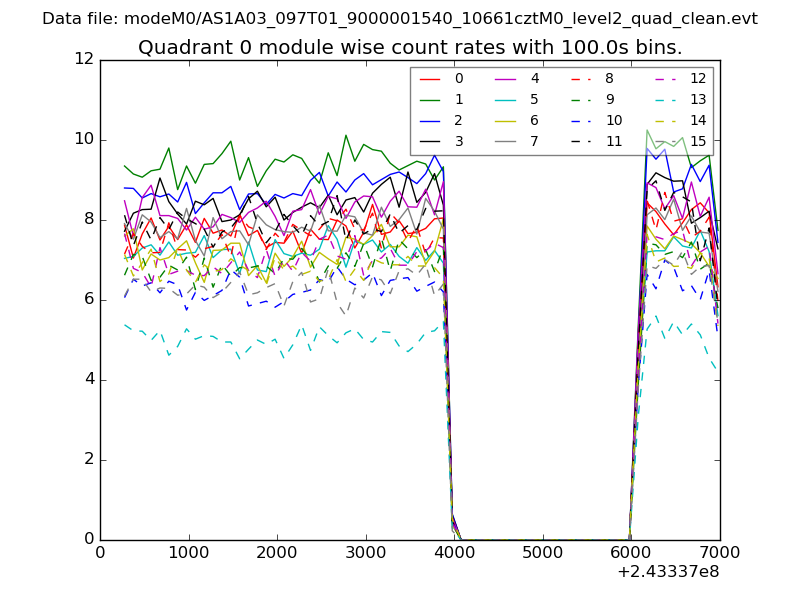
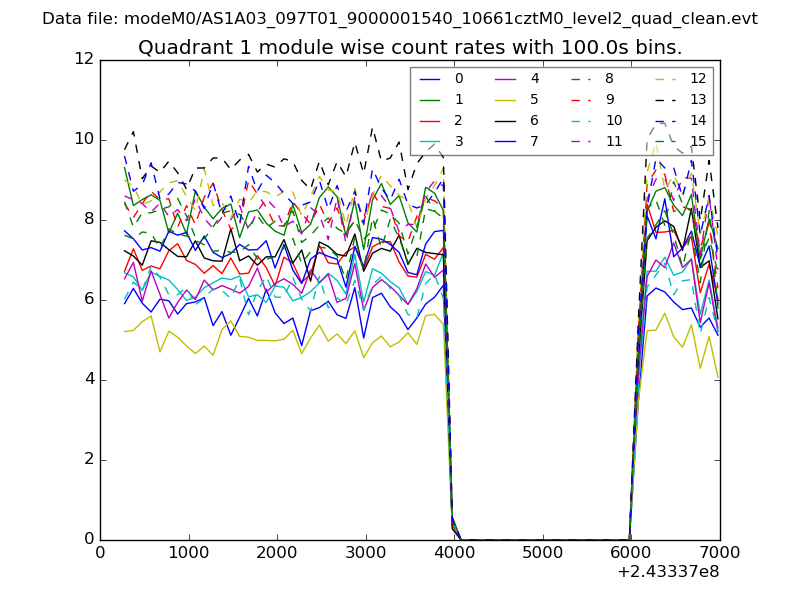
| Module-wise count rates for Quadrant A Data is divided into 100 sec bins |
 |
 |
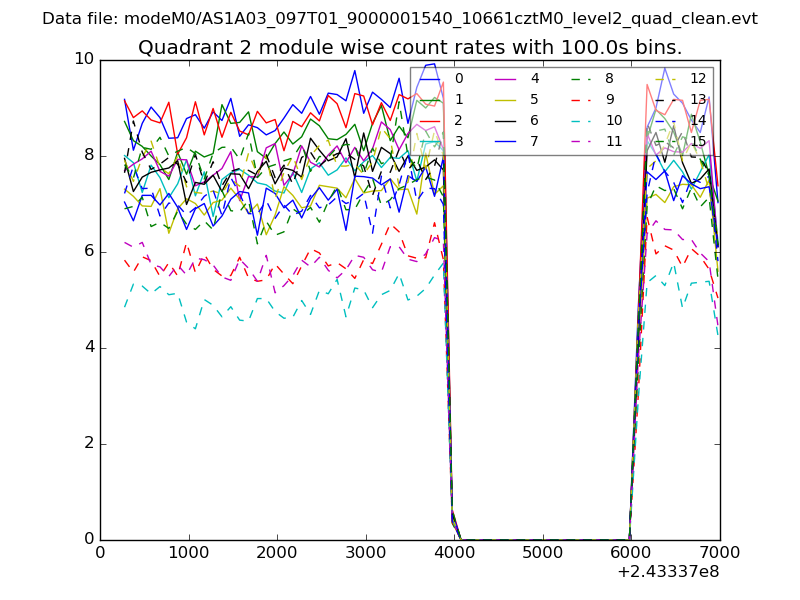
| Module-wise count rates for Quadrant B Data is divided into 100 sec bins |
 |
 |
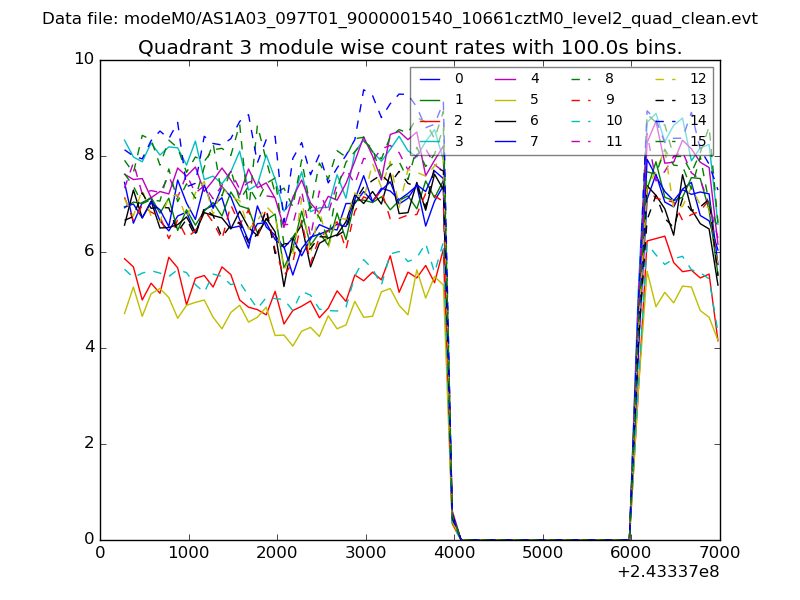
| Module-wise count rates for Quadrant C Data is divided into 100 sec bins |
 |
 |
| Module-wise count rates for Quadrant D Data is divided into 100 sec bins |
 |
 |
| Parameter | Plot |
|---|---|
| CZT HV Monitor | 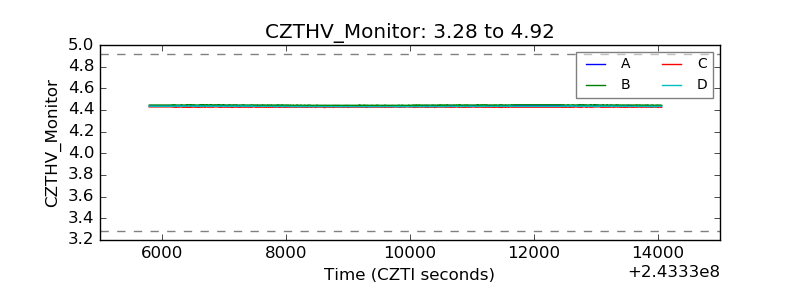 |
| D_VDD | 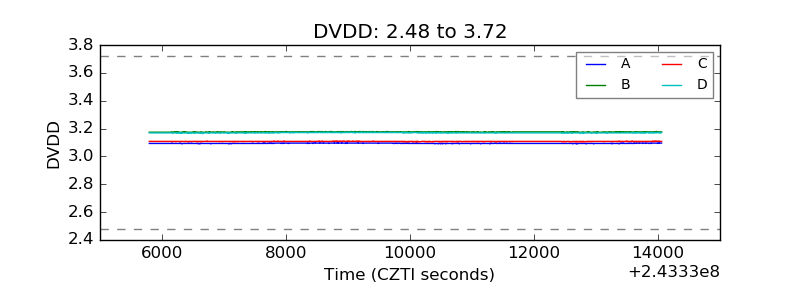 |
| Temperature 1 | 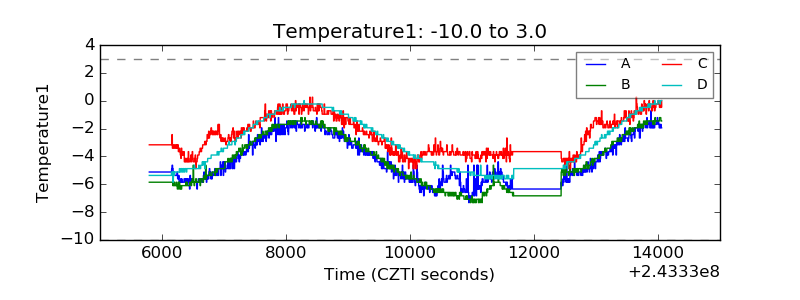 |
| Veto HV Monitor | 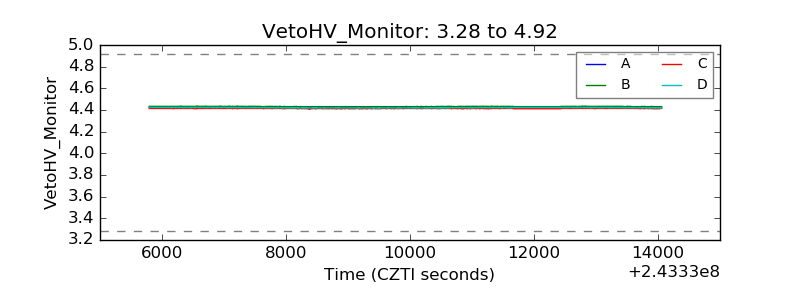 |
| Veto LLD |  |
| Alpha Counter | 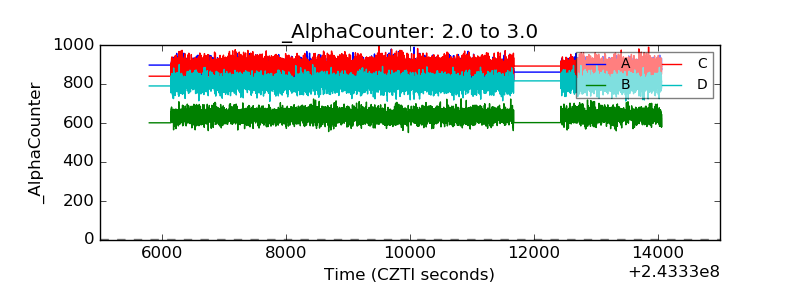 |
| _CPM_Rate | 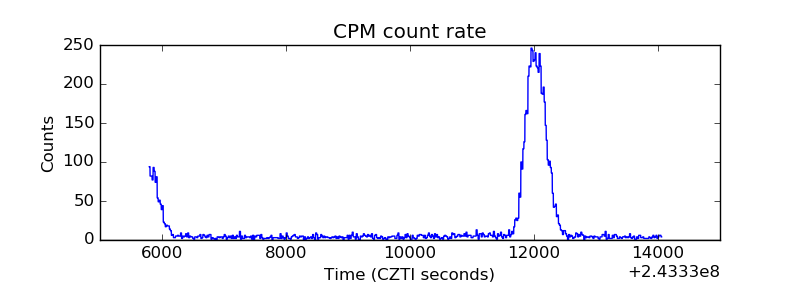 |
| CZT Counter | 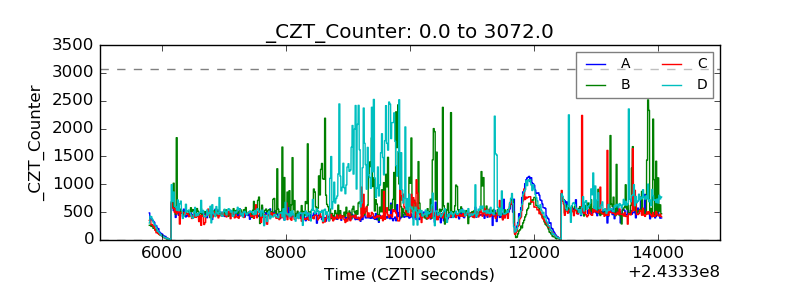 |
| +2.5 Volts monitor |  |
| +5 Volts monitor |  |
| _ROLL_ROT | 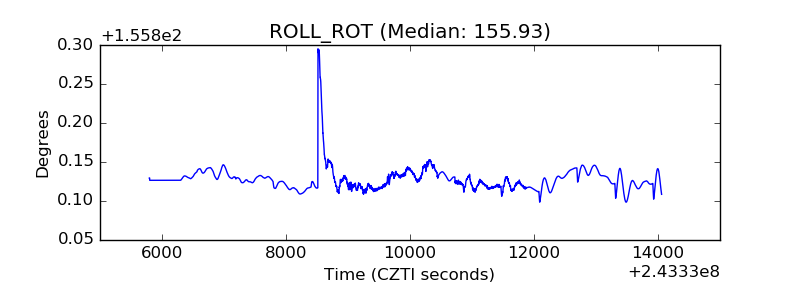 |
| _Roll_DEC |  |
| _Roll_RA | 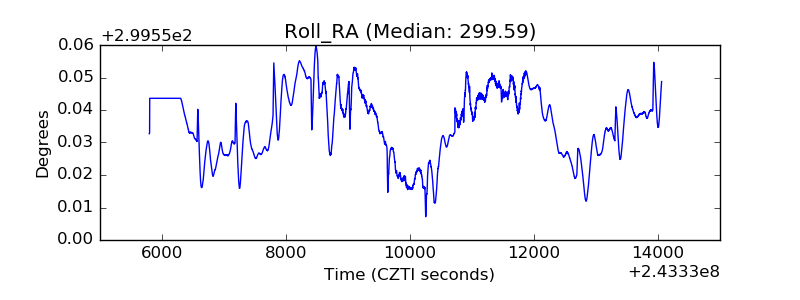 |
| Veto Counter | 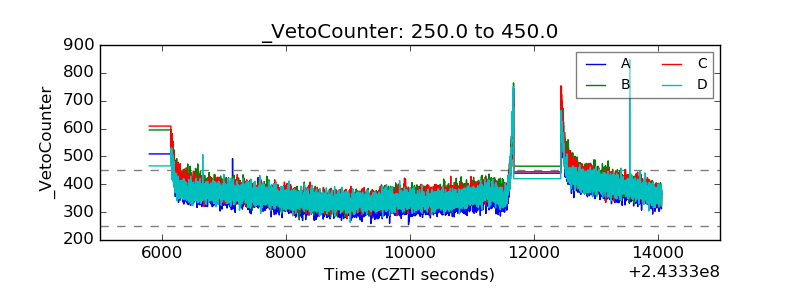 |