| Param | Original file | Final file |
|---|---|---|
| Filename | modeM0/AS1A03_097T01_9000001540_10666cztM0_level2.evt | modeM0/AS1A03_097T01_9000001540_10666cztM0_level2_quad_clean.evt |
| Size (bytes) | 627,624,000 | 90,210,240 |
| Size | 598.5 MB | 86.0 MB |
| Events in quadrant A | 3,003,156 | 614,343 |
| Events in quadrant B | 4,209,279 | 605,477 |
| Events in quadrant C | 3,371,452 | 610,307 |
| Events in quadrant D | 8,010,223 | 474,368 |
| Mode M9 | |||
|---|---|---|---|
| Quadrant | BADHDUFLAG | Total packets | Discarded packets |
| A | 0 | 13 | 0 |
| B | 0 | 13 | 0 |
| C | 0 | 13 | 0 |
| D | 0 | 13 | 0 |
| Mode M0 | |||
|---|---|---|---|
| Quadrant | BADHDUFLAG | Total packets | Discarded packets |
| A | 0 | 12986 | 3 |
| B | 0 | 16541 | 2 |
| C | 0 | 14031 | 2 |
| D | 0 | 27999 | 2 |
| Mode SS | |||
|---|---|---|---|
| Quadrant | BADHDUFLAG | Total packets | Discarded packets |
| A | 0 | 124 | 0 |
| B | 0 | 124 | 0 |
| C | 0 | 124 | 0 |
| D | 0 | 124 | 0 |
| Quadrant | Total seconds | Saturated seconds | Saturation percentage |
|---|---|---|---|
| A | 6110 | 49 | 0.801964% |
| B | 6110 | 307 | 5.024550% |
| C | 6110 | 84 | 1.374795% |
| D | 6110 | 1619 | 26.497545% |
Noise dominated data is calculated using 1-second bins in cleaned event files. If a bin has >2000 counts, and if more than 50% of those come from <1% of pixels, then it is considered to be noise-dominated and hence unusable.
| Quadrant | # 1 sec bins | Bins with >0 counts | Bins with >2000 counts | High rate bins dominated by noise | Noise dominated (total time) | Noise dominated (detector-on time) | Marked lightcurve |
|---|---|---|---|---|---|---|---|
| A | 7405 | 6111 | 0 | 0 | 0.00% | 0.00% | 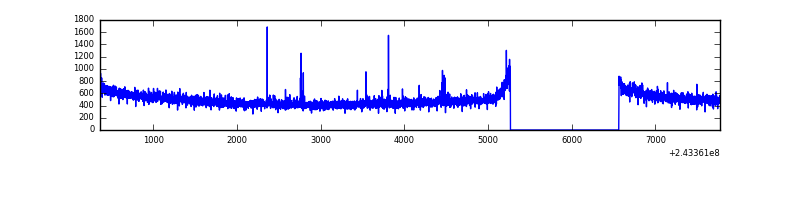 |
| B | 7405 | 6111 | 184 | 184 | 2.48% | 3.01% | 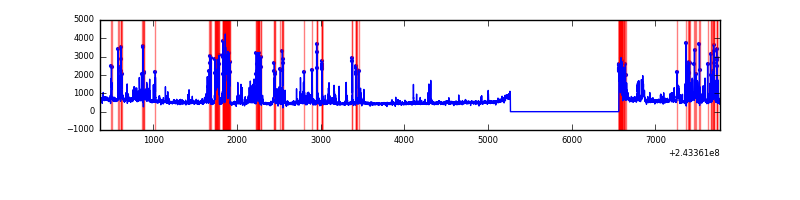 |
| C | 7405 | 6111 | 50 | 50 | 0.68% | 0.82% | 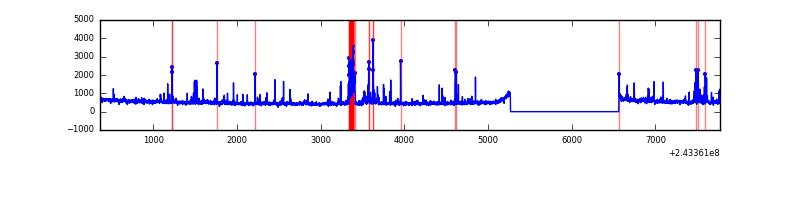 |
| D | 7405 | 6111 | 1641 | 1641 | 22.16% | 26.85% | 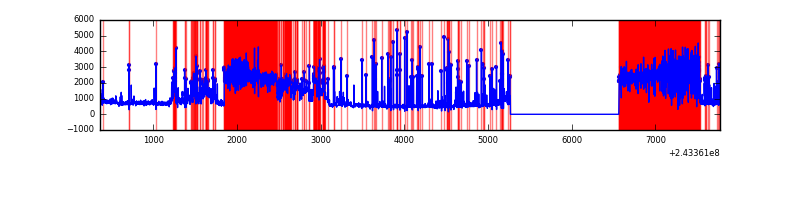 |
Top three noisy pixels from each quadrant. If the there are fewer than three noisy pixels in the level2.evt file, extra rows are filled as -1
| Pixel properties | Quadrant properties | ||||||
|---|---|---|---|---|---|---|---|
| Quadrant | DetID | PixID | Counts | Sigma | Mean | Median | Sigma |
| A | 1 | 162 | 22932 | 144.98 | 764 | 749 | 153.0 |
| A | 4 | 2 | 22132 | 139.75 | 764 | 749 | 153.0 |
| A | 0 | 226 | 7082 | 41.39 | 764 | 749 | 153.0 |
| B | 4 | 239 | 1148811 | 8191.58 | 756 | 740 | 140.2 |
| B | 15 | 204 | 39746 | 278.31 | 756 | 740 | 140.2 |
| B | 0 | 214 | 34478 | 240.72 | 756 | 740 | 140.2 |
| C | 4 | 254 | 384434 | 2242.41 | 747 | 752 | 171.1 |
| C | 4 | 175 | 49228 | 283.32 | 747 | 752 | 171.1 |
| C | 14 | 234 | 14583 | 80.83 | 747 | 752 | 171.1 |
| D | 1 | 20 | 3797125 | 23867.34 | 667 | 650 | 159.1 |
| D | 8 | 195 | 619132 | 3888.22 | 667 | 650 | 159.1 |
| D | 10 | 199 | 602843 | 3785.81 | 667 | 650 | 159.1 |
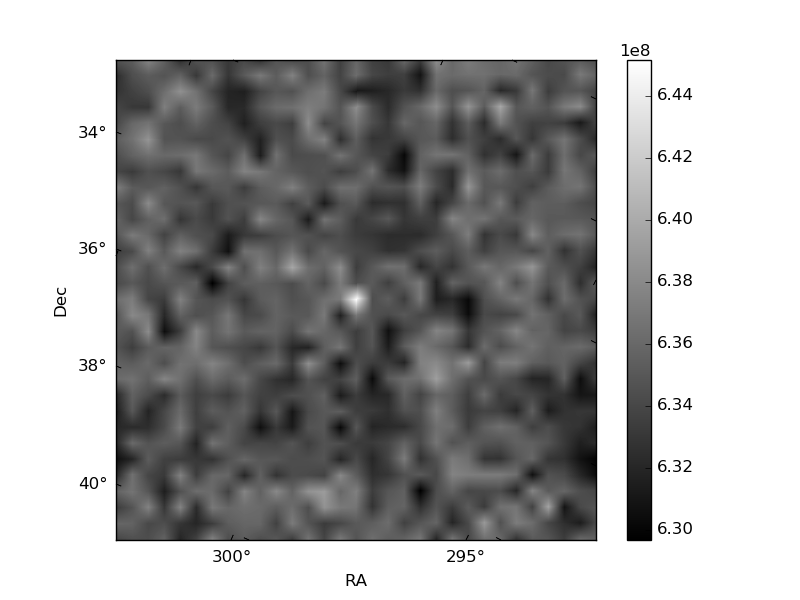
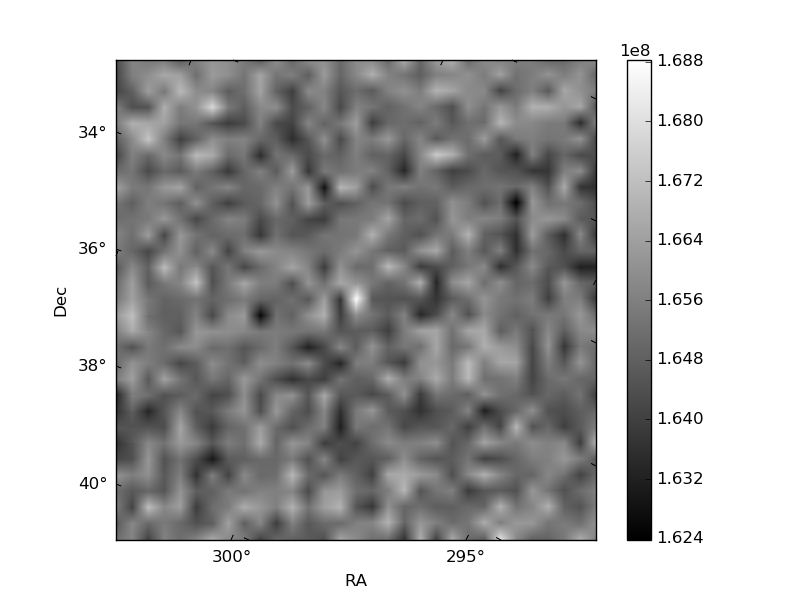
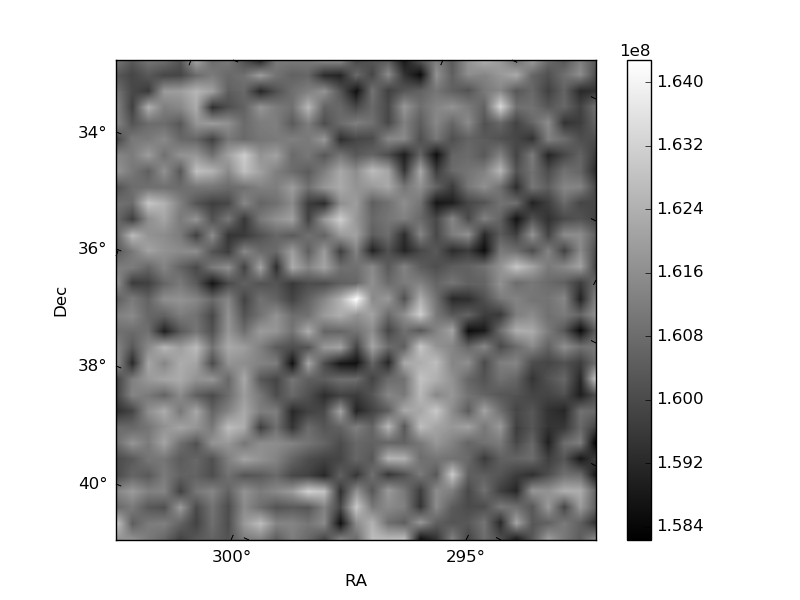
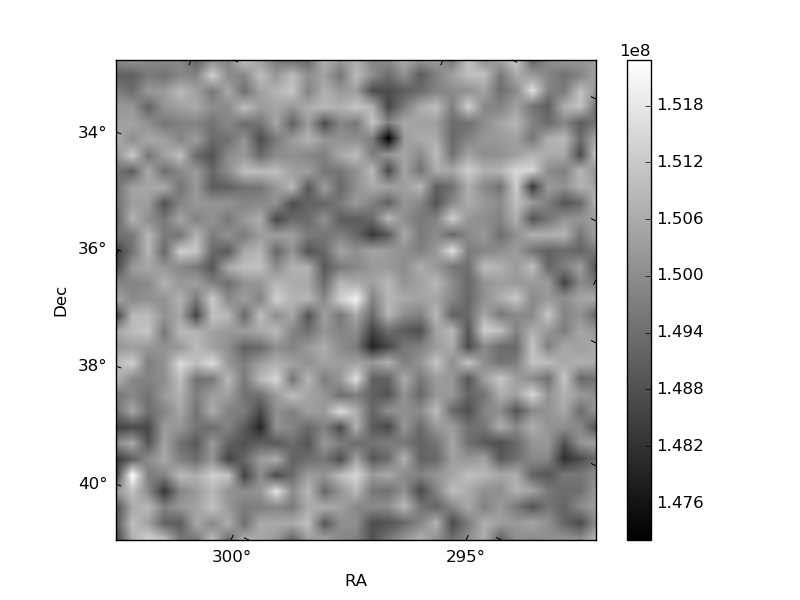
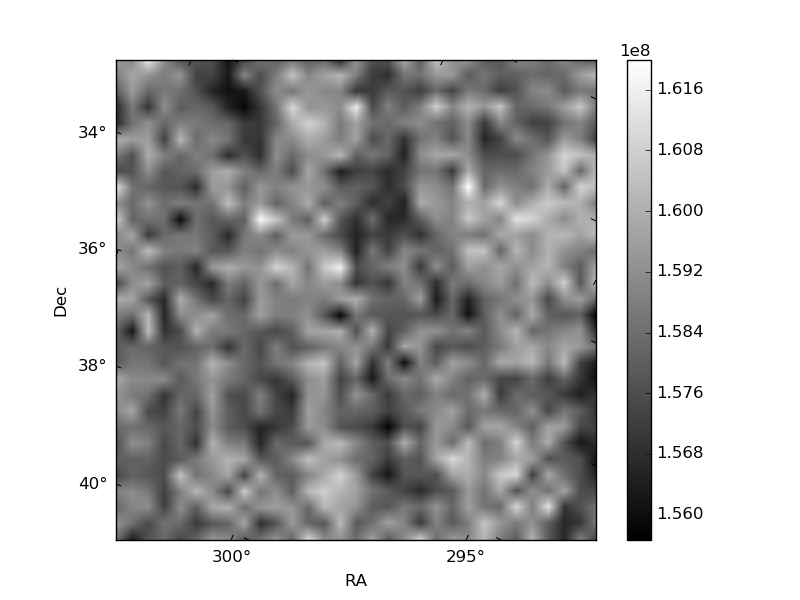
Histogram calculated using DETX and DETY for each event in the final _common_clean file
| Quadrant A | 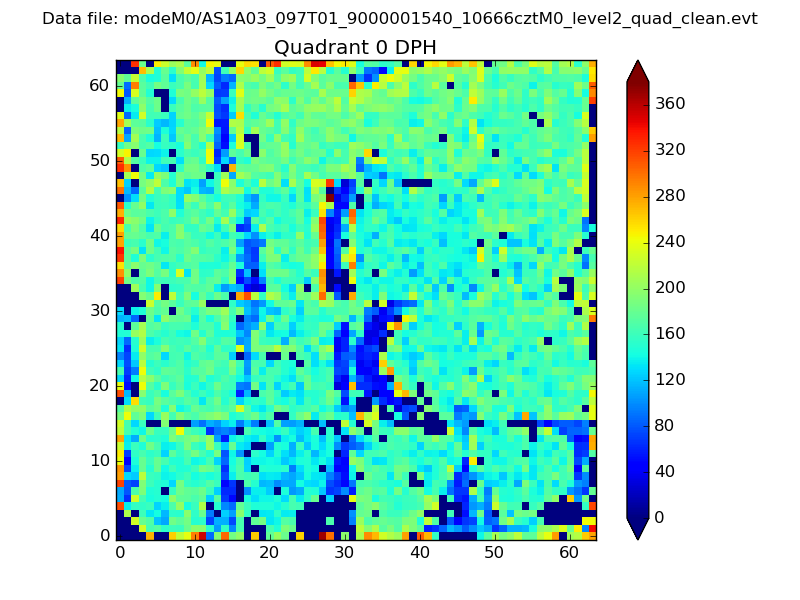 |
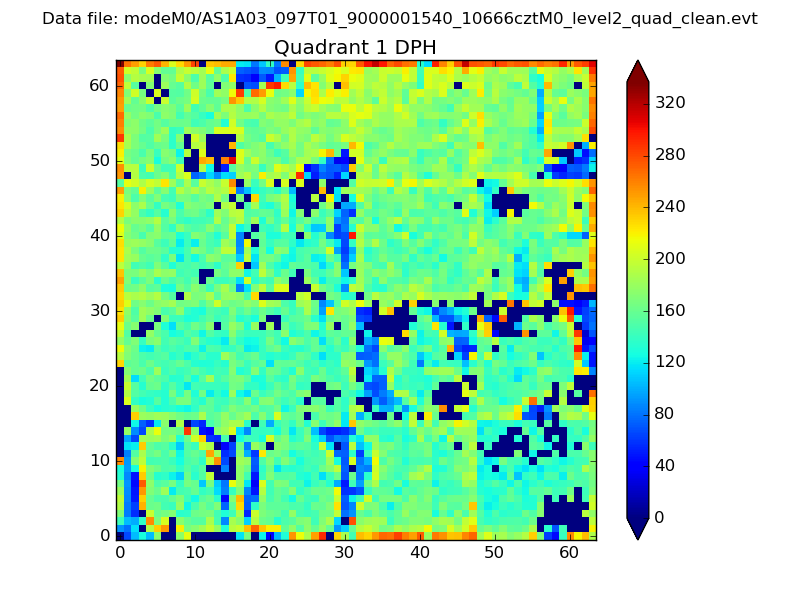 |
Quadrant B |
|---|---|---|---|
| Quadrant D |  |
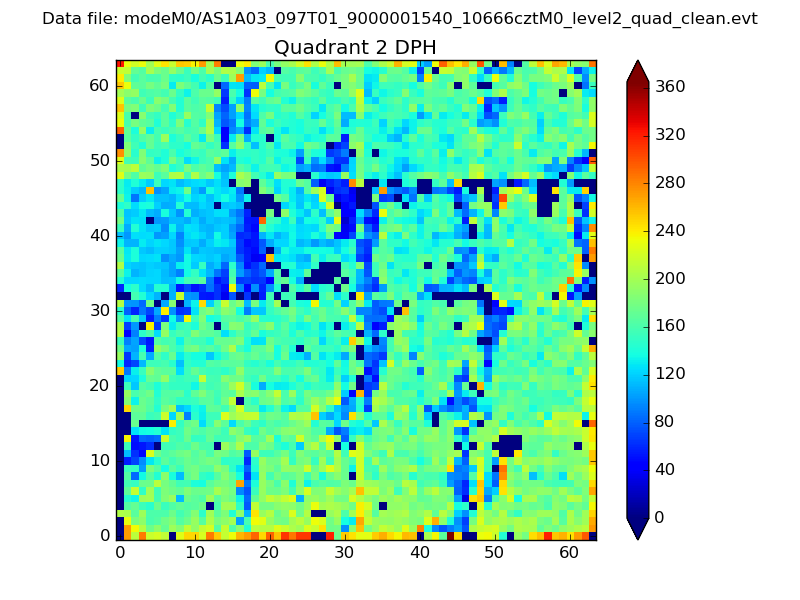 |
Quadrant C |
| Plot type | Count rate plots | Images |
|---|---|---|
| Comparison with Poisson distribution Blue bars denote a histogram of data divided into 1 sec bins. Red curve is a Poisson curve with rate = median count rate of data. |
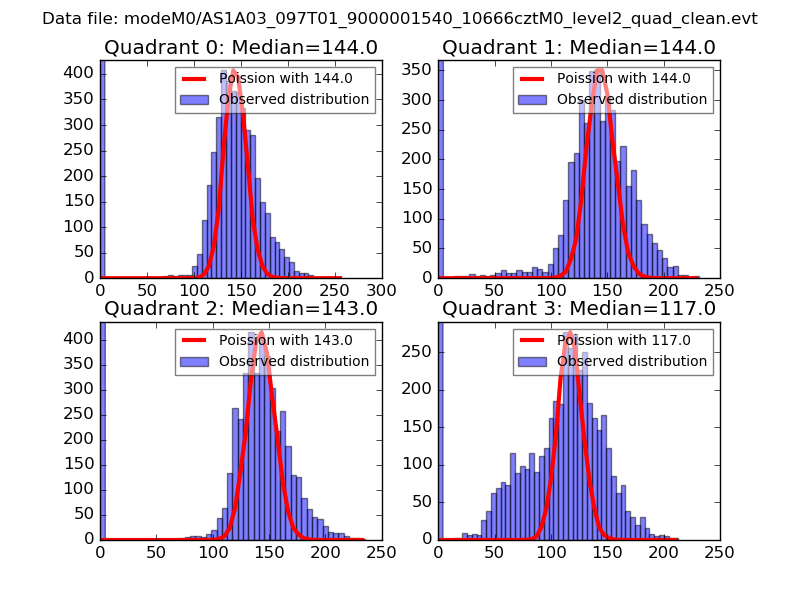 |
 |
| Quadrant-wise count rates Data is divided into 100 sec bins |
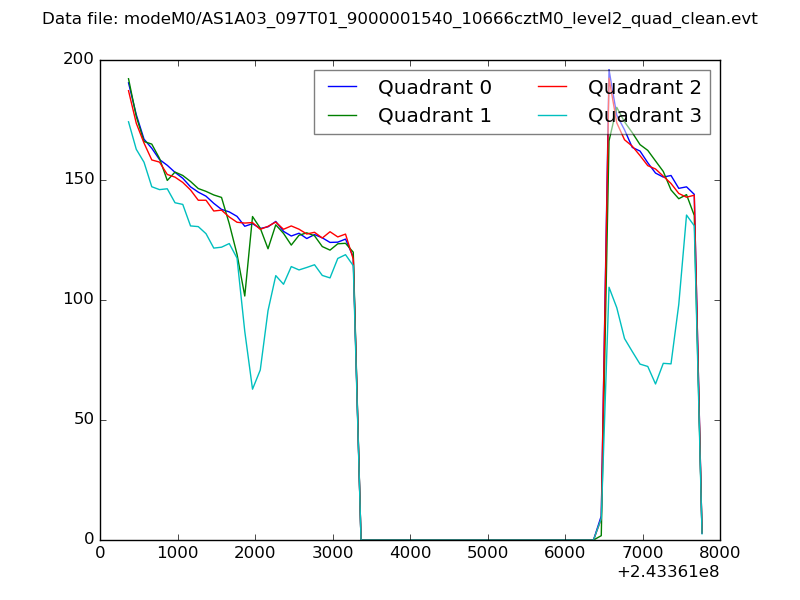 |
|
| Module-wise count rates for Quadrant A Data is divided into 100 sec bins |
 |
 |
| Module-wise count rates for Quadrant B Data is divided into 100 sec bins |
 |
 |
| Module-wise count rates for Quadrant C Data is divided into 100 sec bins |
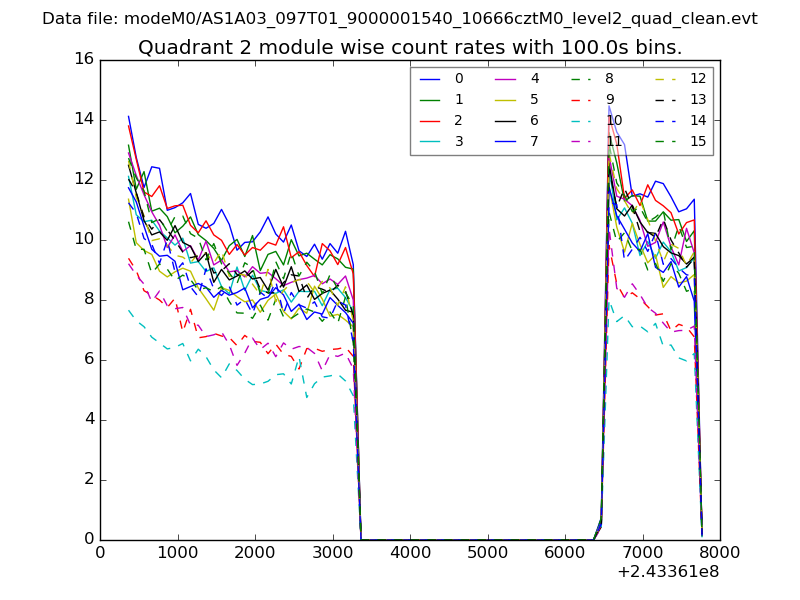 |
 |
| Module-wise count rates for Quadrant D Data is divided into 100 sec bins |
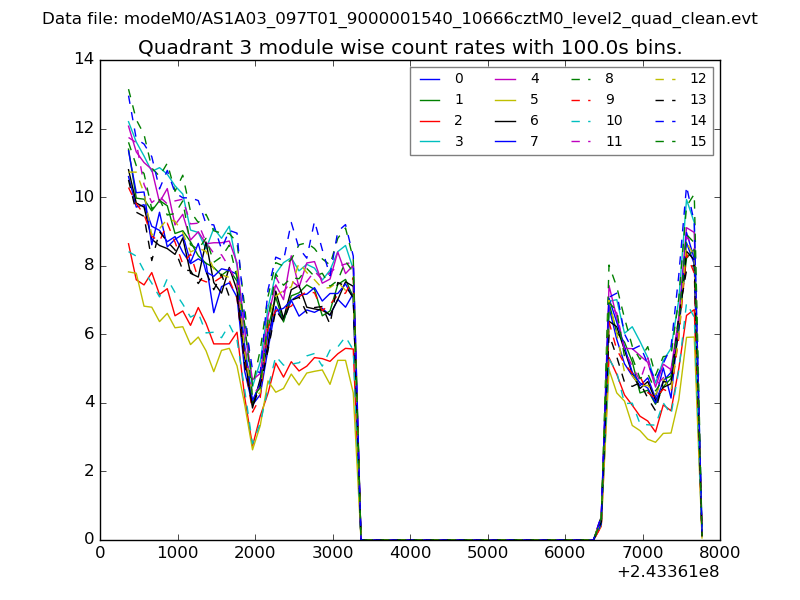 |
 |
| Parameter | Plot |
|---|---|
| CZT HV Monitor | 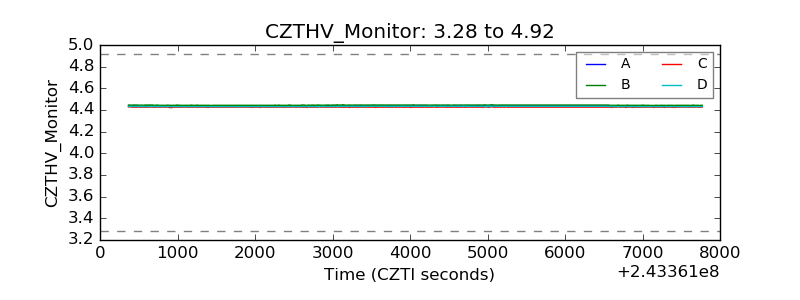 |
| D_VDD | 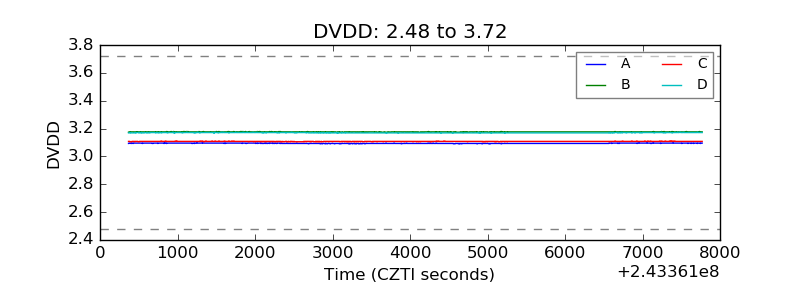 |
| Temperature 1 | 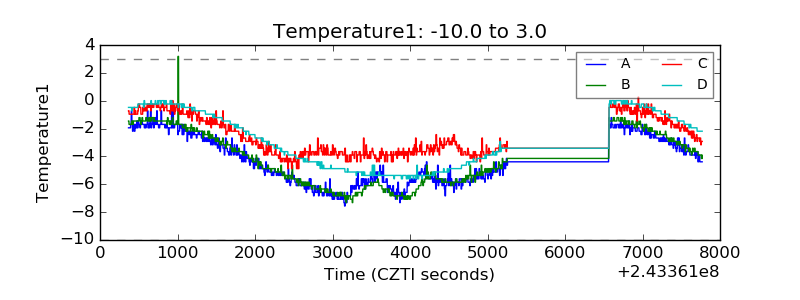 |
| Veto HV Monitor | 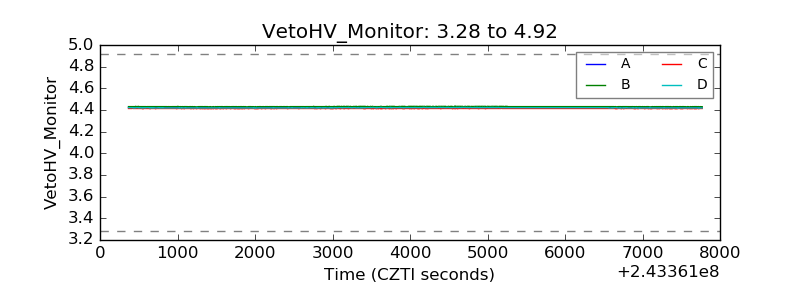 |
| Veto LLD | 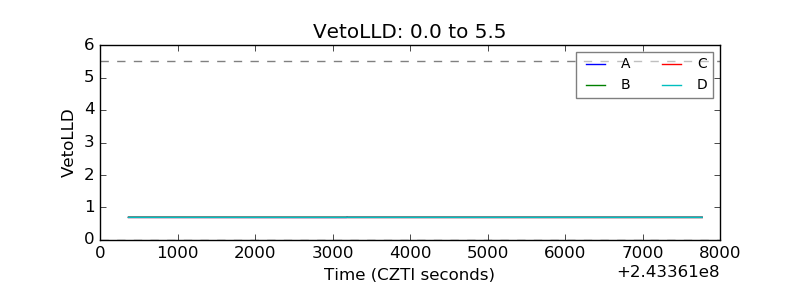 |
| Alpha Counter | 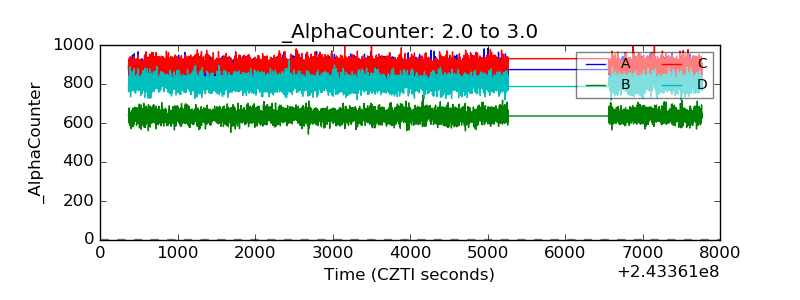 |
| _CPM_Rate | 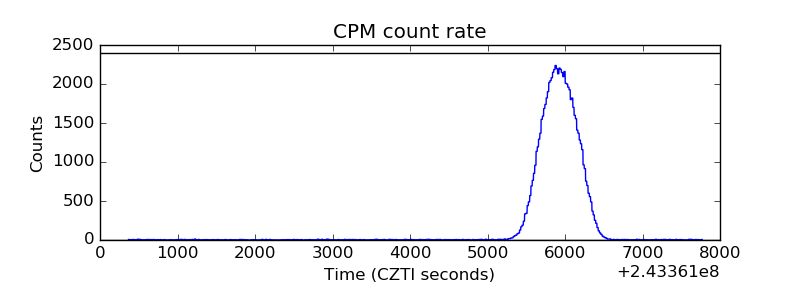 |
| CZT Counter | 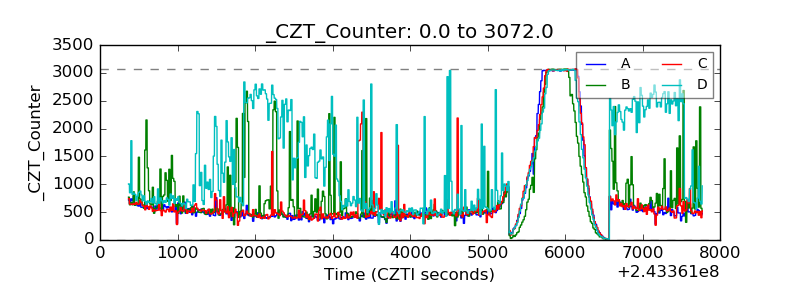 |
| +2.5 Volts monitor |  |
| +5 Volts monitor | 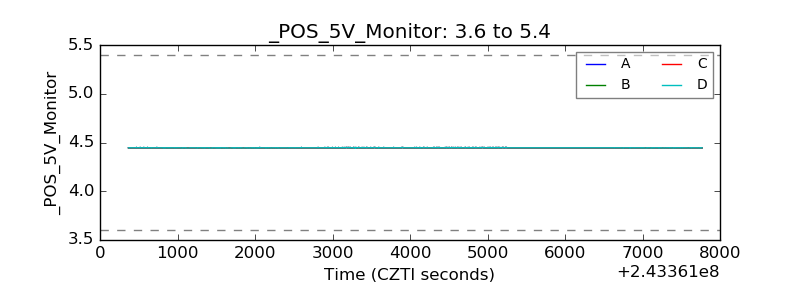 |
| _ROLL_ROT | 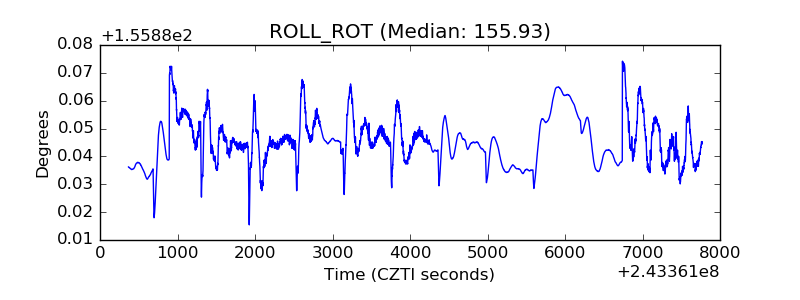 |
| _Roll_DEC | 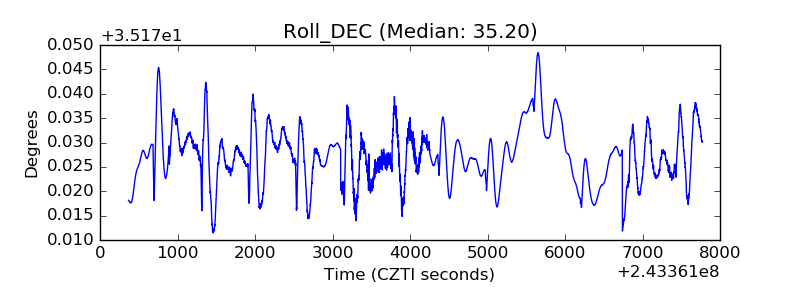 |
| _Roll_RA |  |
| Veto Counter | 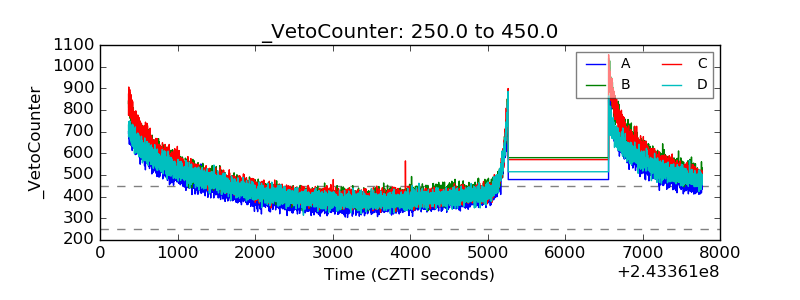 |