| Param | Original file | Final file |
|---|---|---|
| Filename | modeM0/AS1A03_097T01_9000001540_10668cztM0_level2.evt | modeM0/AS1A03_097T01_9000001540_10668cztM0_level2_quad_clean.evt |
| Size (bytes) | 502,401,600 | 81,008,640 |
| Size | 479.1 MB | 77.3 MB |
| Events in quadrant A | 2,795,555 | 526,274 |
| Events in quadrant B | 4,049,660 | 516,564 |
| Events in quadrant C | 3,128,296 | 523,658 |
| Events in quadrant D | 4,841,051 | 473,638 |
| Mode M9 | |||
|---|---|---|---|
| Quadrant | BADHDUFLAG | Total packets | Discarded packets |
| A | 0 | 13 | 0 |
| B | 0 | 13 | 0 |
| C | 0 | 13 | 0 |
| D | 0 | 13 | 0 |
| Mode M0 | |||
|---|---|---|---|
| Quadrant | BADHDUFLAG | Total packets | Discarded packets |
| A | 0 | 12273 | 2 |
| B | 0 | 15914 | 1 |
| C | 0 | 13301 | 1 |
| D | 0 | 18430 | 1 |
| Mode SS | |||
|---|---|---|---|
| Quadrant | BADHDUFLAG | Total packets | Discarded packets |
| A | 0 | 120 | 0 |
| B | 0 | 120 | 0 |
| C | 0 | 120 | 0 |
| D | 0 | 120 | 0 |
| Quadrant | Total seconds | Saturated seconds | Saturation percentage |
|---|---|---|---|
| A | 5906 | 24 | 0.406366% |
| B | 5906 | 360 | 6.095496% |
| C | 5906 | 81 | 1.371487% |
| D | 5906 | 372 | 6.298679% |
Noise dominated data is calculated using 1-second bins in cleaned event files. If a bin has >2000 counts, and if more than 50% of those come from <1% of pixels, then it is considered to be noise-dominated and hence unusable.
| Quadrant | # 1 sec bins | Bins with >0 counts | Bins with >2000 counts | High rate bins dominated by noise | Noise dominated (total time) | Noise dominated (detector-on time) | Marked lightcurve |
|---|---|---|---|---|---|---|---|
| A | 7211 | 5907 | 0 | 0 | 0.00% | 0.00% | 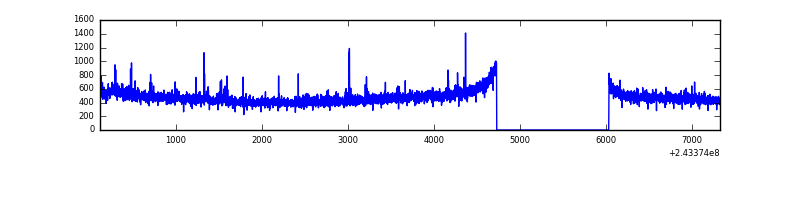 |
| B | 7211 | 5907 | 229 | 229 | 3.18% | 3.88% | 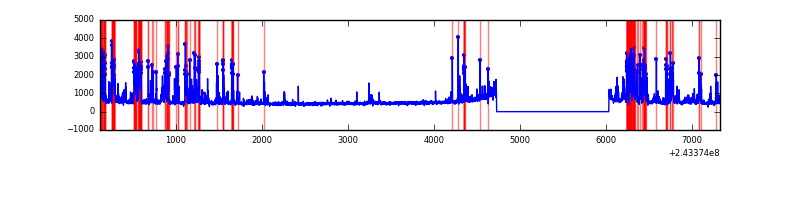 |
| C | 7211 | 5907 | 58 | 58 | 0.80% | 0.98% | 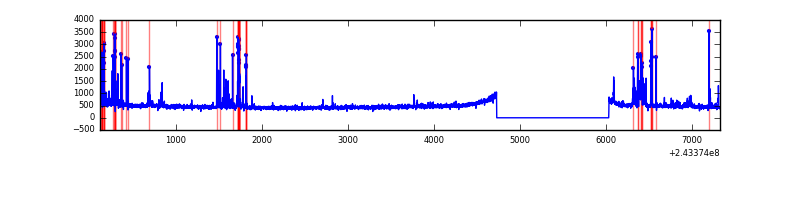 |
| D | 7211 | 5907 | 339 | 339 | 4.70% | 5.74% | 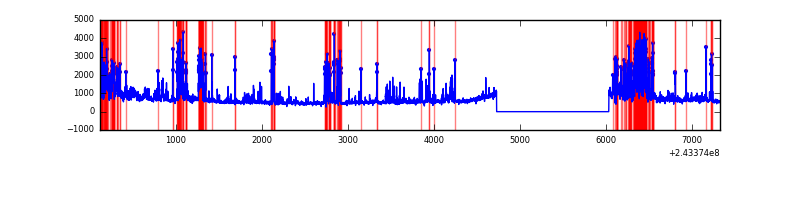 |
Top three noisy pixels from each quadrant. If the there are fewer than three noisy pixels in the level2.evt file, extra rows are filled as -1
| Pixel properties | Quadrant properties | ||||||
|---|---|---|---|---|---|---|---|
| Quadrant | DetID | PixID | Counts | Sigma | Mean | Median | Sigma |
| A | 3 | 1 | 23062 | 155.97 | 708 | 695 | 143.4 |
| A | 4 | 2 | 12173 | 80.04 | 708 | 695 | 143.4 |
| A | 15 | 174 | 9603 | 62.12 | 708 | 695 | 143.4 |
| B | 4 | 239 | 1077772 | 8098.73 | 704 | 688 | 133.0 |
| B | 4 | 81 | 75201 | 560.27 | 704 | 688 | 133.0 |
| B | 0 | 214 | 69111 | 514.48 | 704 | 688 | 133.0 |
| C | 4 | 254 | 370996 | 2310.18 | 694 | 699 | 160.3 |
| C | 4 | 175 | 20008 | 120.46 | 694 | 699 | 160.3 |
| C | 12 | 4 | 16592 | 99.15 | 694 | 699 | 160.3 |
| D | 8 | 195 | 531867 | 3254.7 | 672 | 655 | 163.2 |
| D | 14 | 34 | 452588 | 2768.96 | 672 | 655 | 163.2 |
| D | 4 | 95 | 312608 | 1911.31 | 672 | 655 | 163.2 |
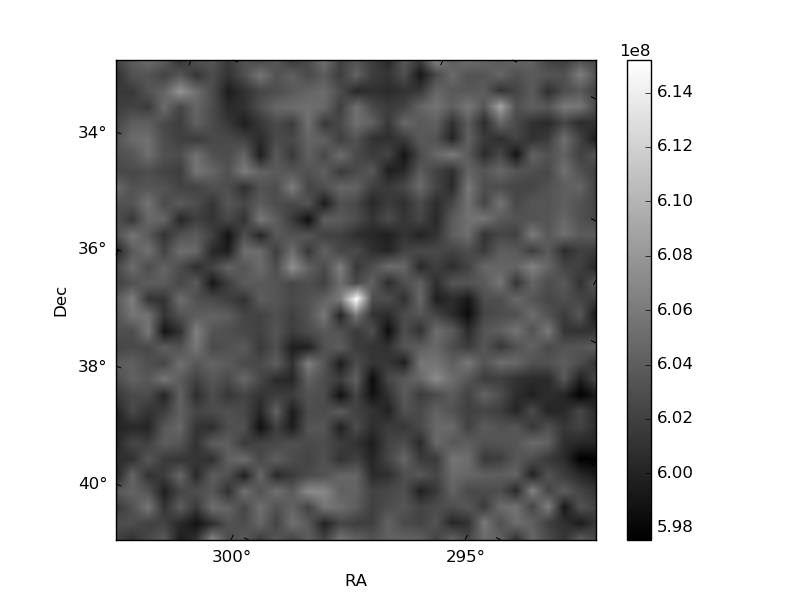
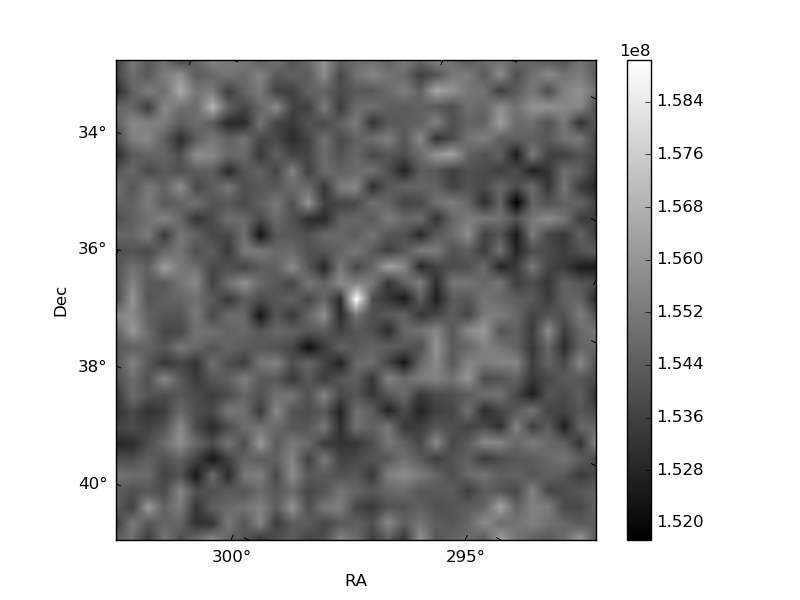
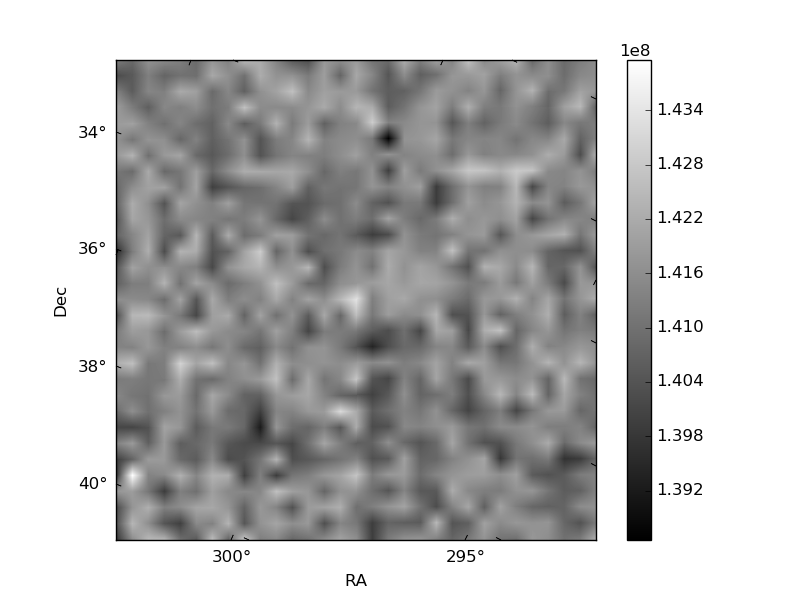
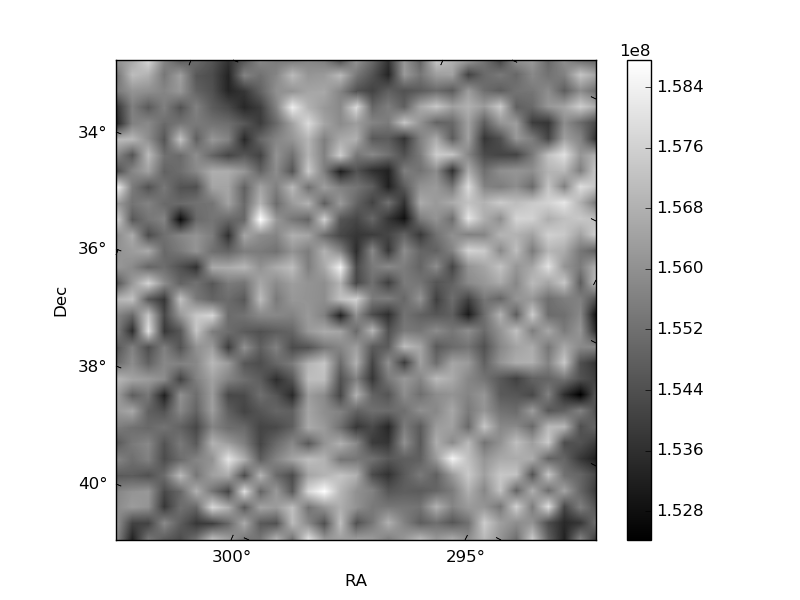
Histogram calculated using DETX and DETY for each event in the final _common_clean file
| Quadrant A | 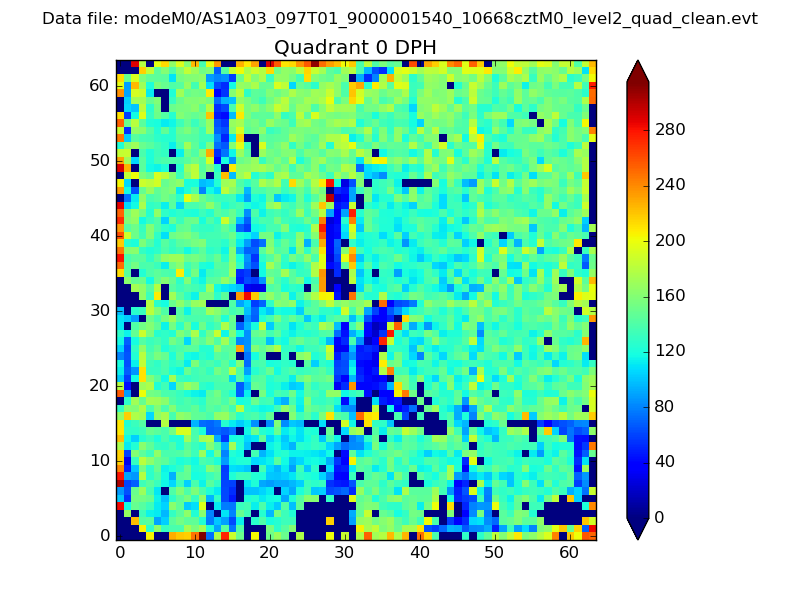 |
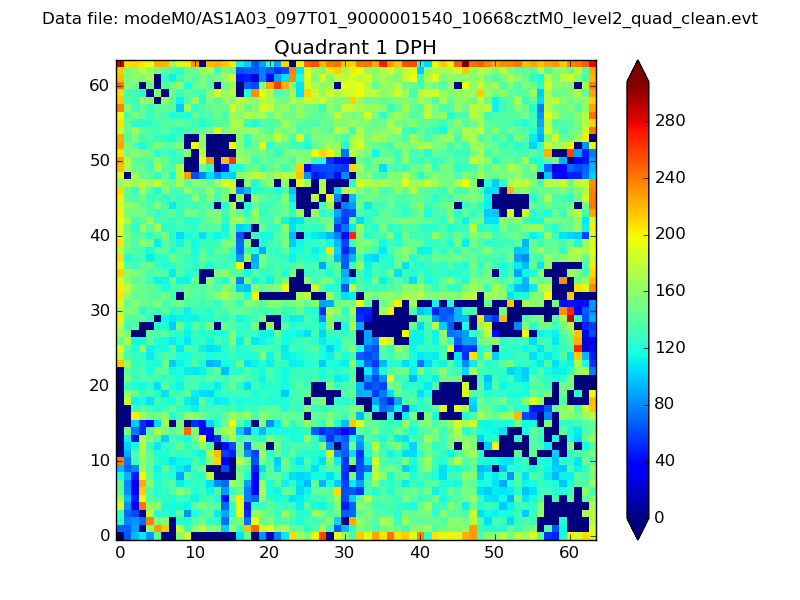 |
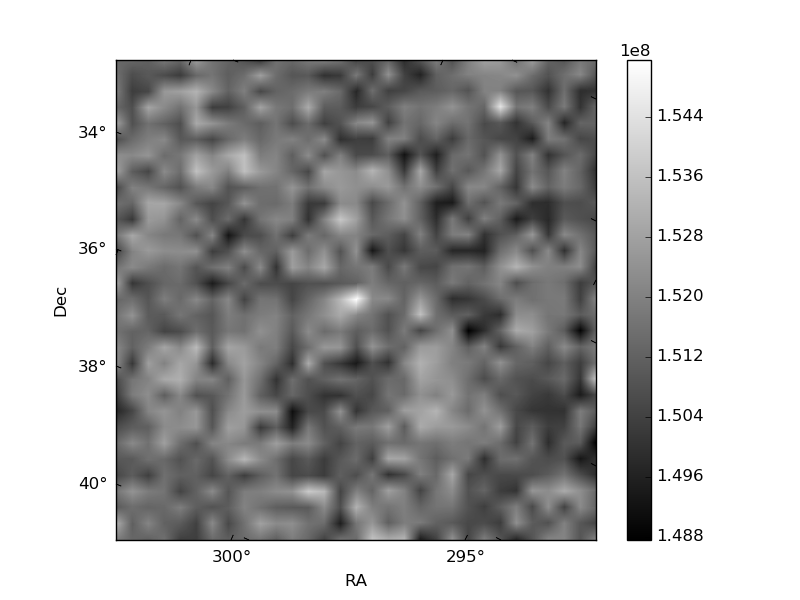
Quadrant B |
|---|---|---|---|
| Quadrant D | 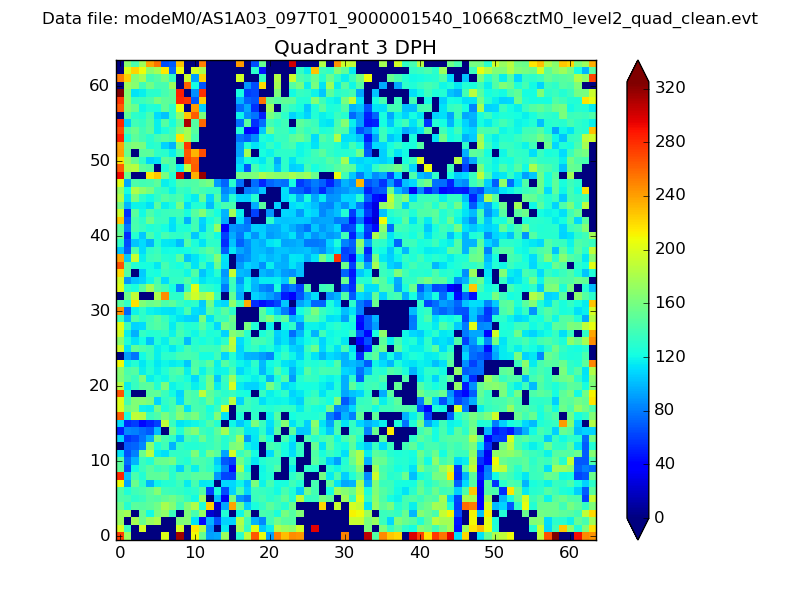 |
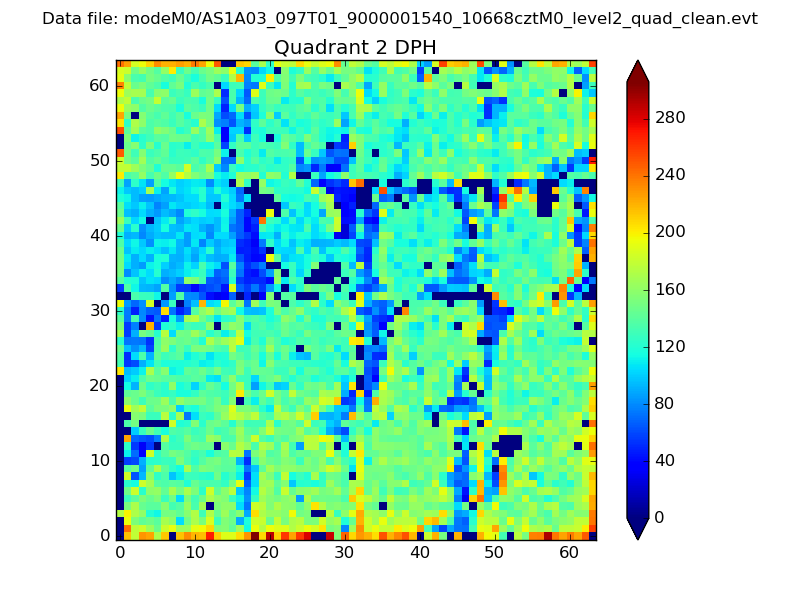 |
Quadrant C |
| Plot type | Count rate plots | Images |
|---|---|---|
| Comparison with Poisson distribution Blue bars denote a histogram of data divided into 1 sec bins. Red curve is a Poisson curve with rate = median count rate of data. |
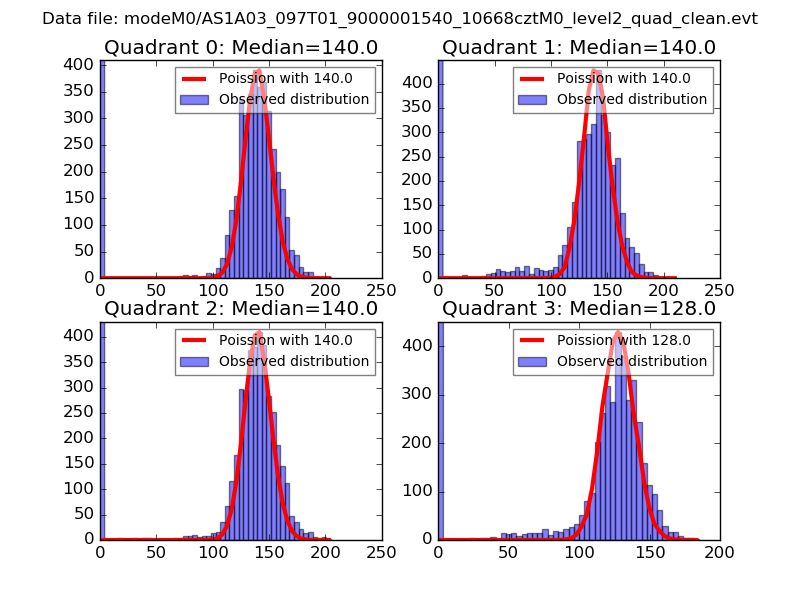 |
 |
| Quadrant-wise count rates Data is divided into 100 sec bins |
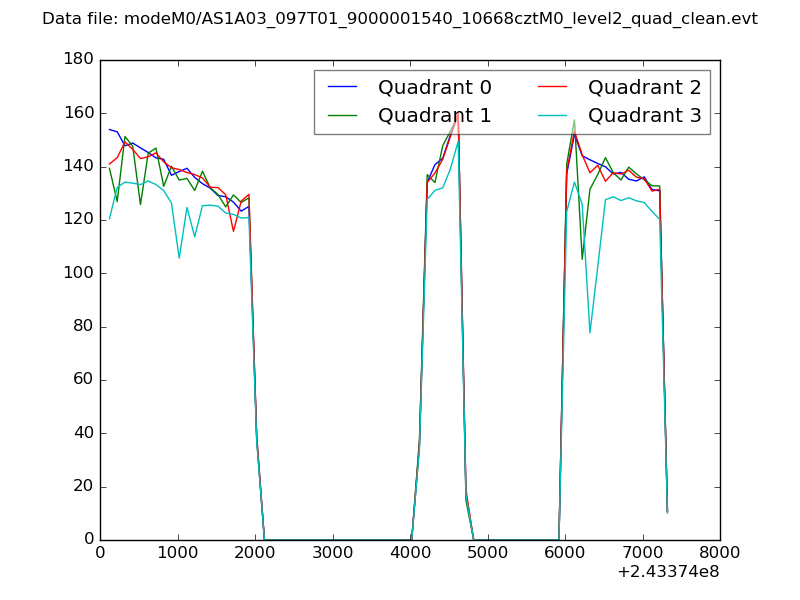 |
|
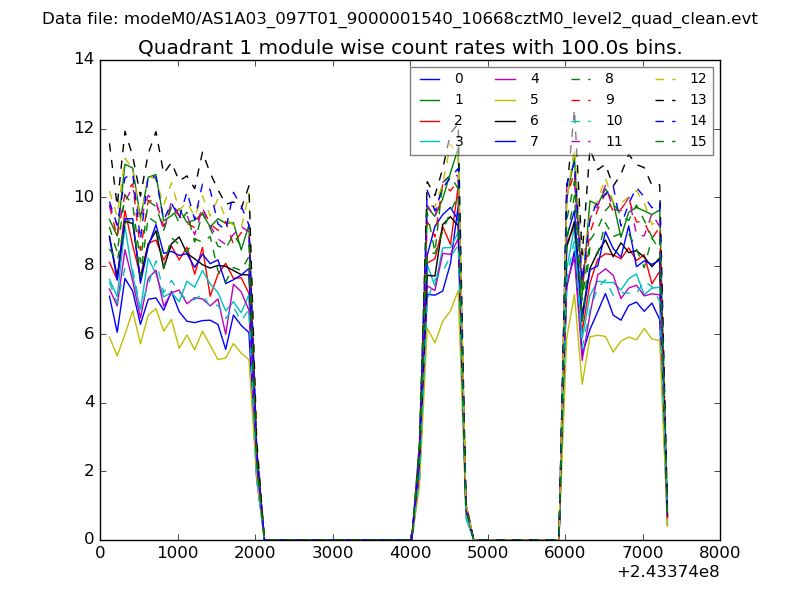
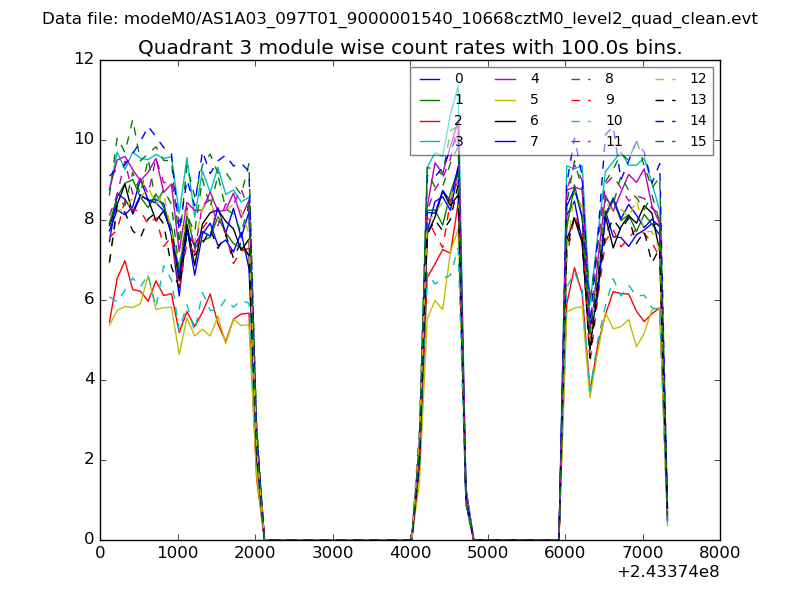
| Module-wise count rates for Quadrant A Data is divided into 100 sec bins |
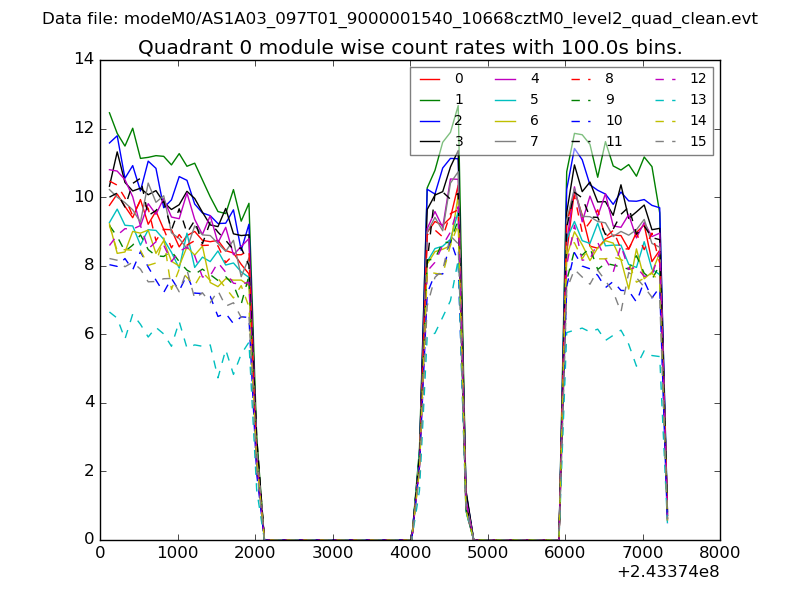 |
 |
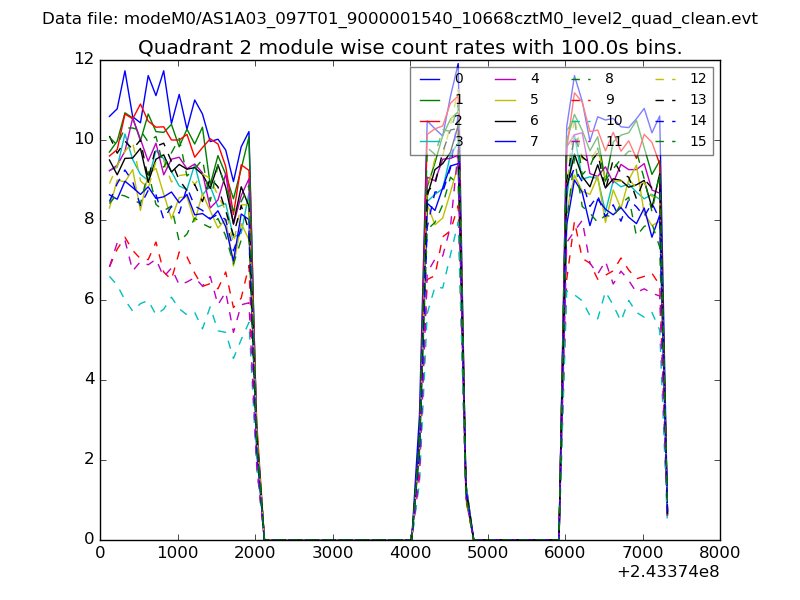
| Module-wise count rates for Quadrant B Data is divided into 100 sec bins |
 |
 |
| Module-wise count rates for Quadrant C Data is divided into 100 sec bins |
 |
 |
| Module-wise count rates for Quadrant D Data is divided into 100 sec bins |
 |
 |
| Parameter | Plot |
|---|---|
| CZT HV Monitor | 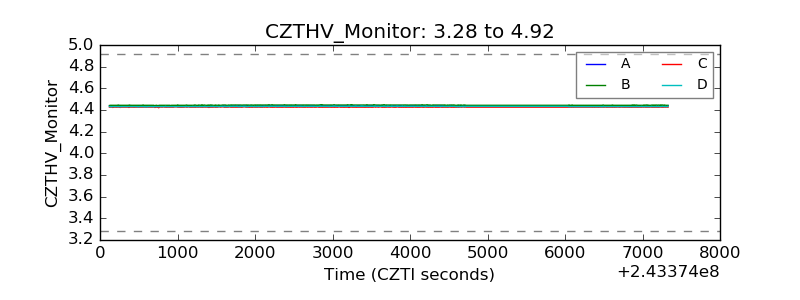 |
| D_VDD | 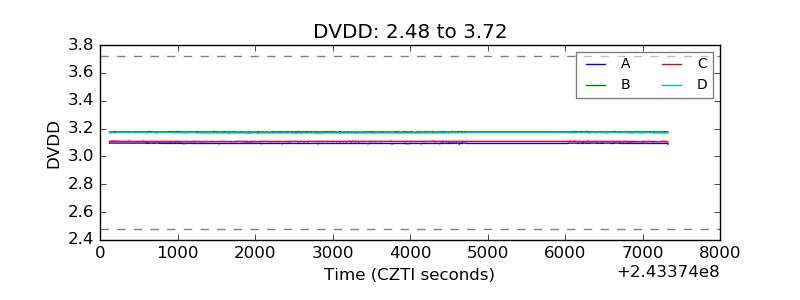 |
| Temperature 1 | 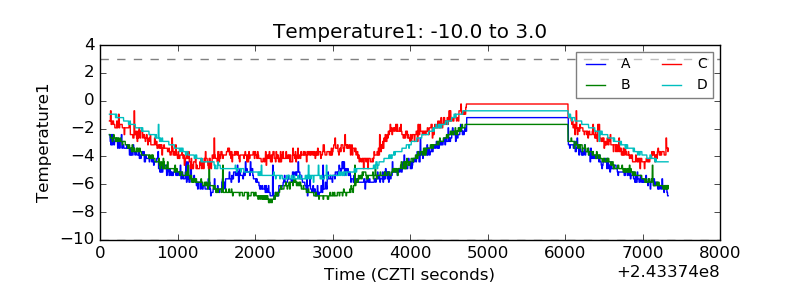 |
| Veto HV Monitor |  |
| Veto LLD | 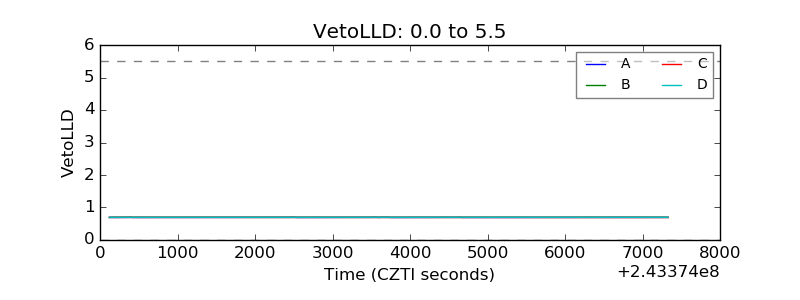 |
| Alpha Counter | 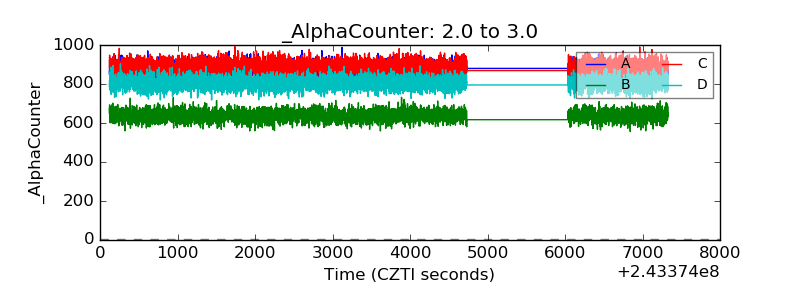 |
| _CPM_Rate |  |
| CZT Counter | 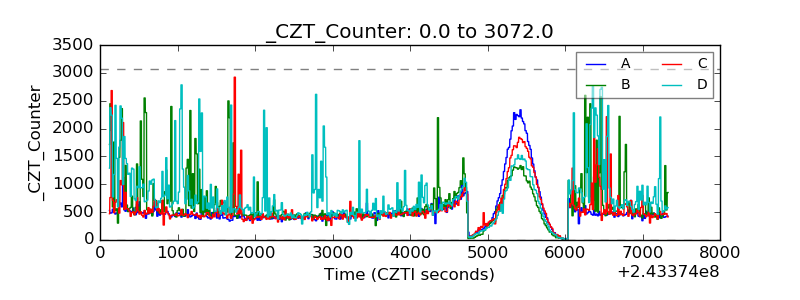 |
| +2.5 Volts monitor | 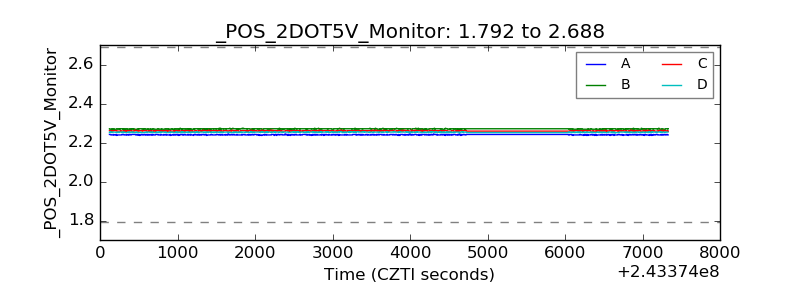 |
| +5 Volts monitor |  |
| _ROLL_ROT | 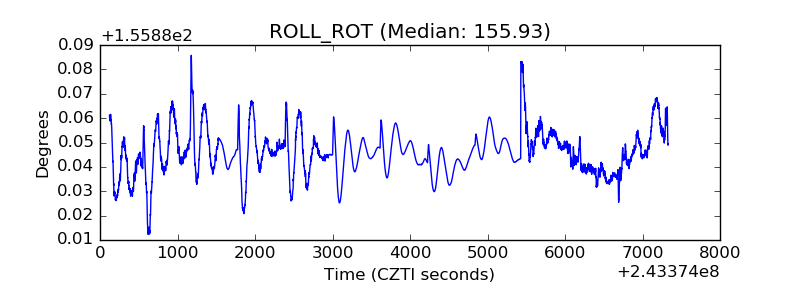 |
| _Roll_DEC | 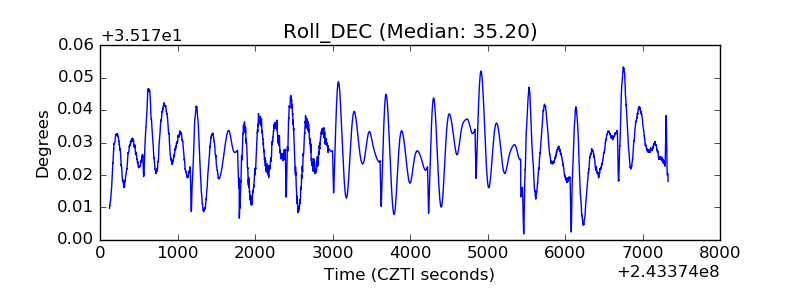 |
| _Roll_RA | 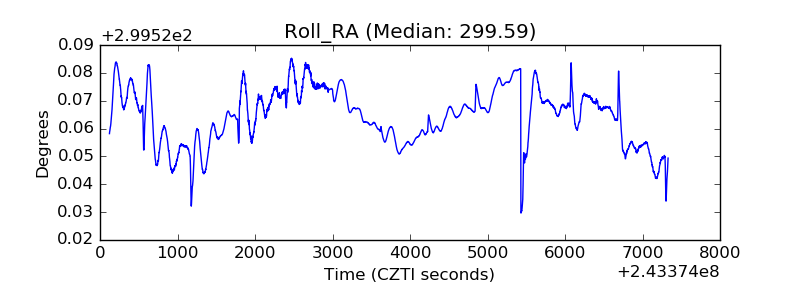 |
| Veto Counter | 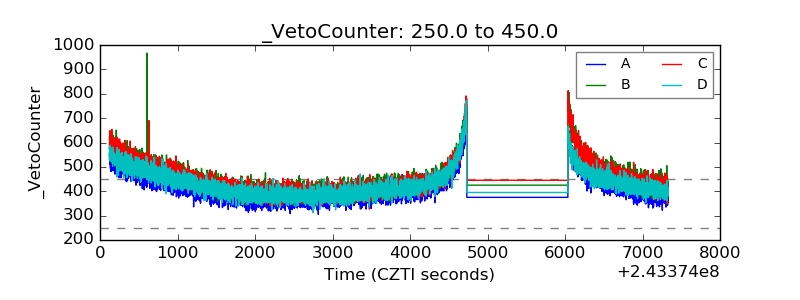 |