| Param | Original file | Final file |
|---|---|---|
| Filename | modeM0/AS1A03_097T01_9000001540_10669cztM0_level2.evt | modeM0/AS1A03_097T01_9000001540_10669cztM0_level2_quad_clean.evt |
| Size (bytes) | 536,016,960 | 90,599,040 |
| Size | 511.2 MB | 86.4 MB |
| Events in quadrant A | 2,985,620 | 584,817 |
| Events in quadrant B | 4,544,240 | 581,557 |
| Events in quadrant C | 3,762,769 | 586,344 |
| Events in quadrant D | 4,499,753 | 537,201 |
| Mode M9 | |||
|---|---|---|---|
| Quadrant | BADHDUFLAG | Total packets | Discarded packets |
| A | 0 | 18 | 0 |
| B | 0 | 18 | 0 |
| C | 0 | 18 | 0 |
| D | 0 | 19 | 0 |
| Mode M0 | |||
|---|---|---|---|
| Quadrant | BADHDUFLAG | Total packets | Discarded packets |
| A | 0 | 13404 | 3 |
| B | 0 | 17898 | 2 |
| C | 0 | 15563 | 2 |
| D | 0 | 17661 | 2 |
| Mode SS | |||
|---|---|---|---|
| Quadrant | BADHDUFLAG | Total packets | Discarded packets |
| A | 0 | 132 | 0 |
| B | 0 | 132 | 0 |
| C | 0 | 132 | 0 |
| D | 0 | 132 | 0 |
| Quadrant | Total seconds | Saturated seconds | Saturation percentage |
|---|---|---|---|
| A | 6503 | 35 | 0.538213% |
| B | 6503 | 322 | 4.951561% |
| C | 6503 | 160 | 2.460403% |
| D | 6503 | 232 | 3.567584% |
Noise dominated data is calculated using 1-second bins in cleaned event files. If a bin has >2000 counts, and if more than 50% of those come from <1% of pixels, then it is considered to be noise-dominated and hence unusable.
| Quadrant | # 1 sec bins | Bins with >0 counts | Bins with >2000 counts | High rate bins dominated by noise | Noise dominated (total time) | Noise dominated (detector-on time) | Marked lightcurve |
|---|---|---|---|---|---|---|---|
| A | 7593 | 6504 | 0 | 0 | 0.00% | 0.00% | 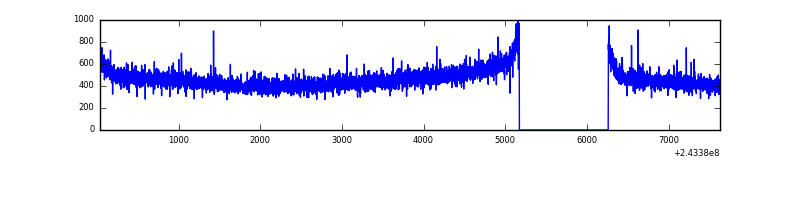 |
| B | 7593 | 6504 | 208 | 208 | 2.74% | 3.20% | 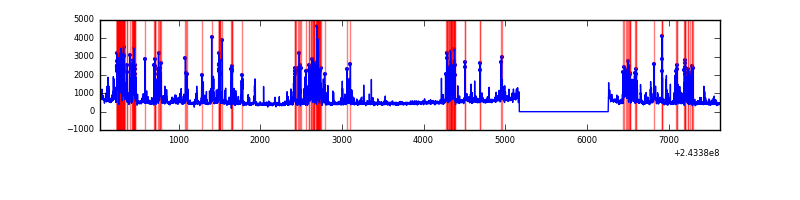 |
| C | 7593 | 6504 | 132 | 132 | 1.74% | 2.03% | 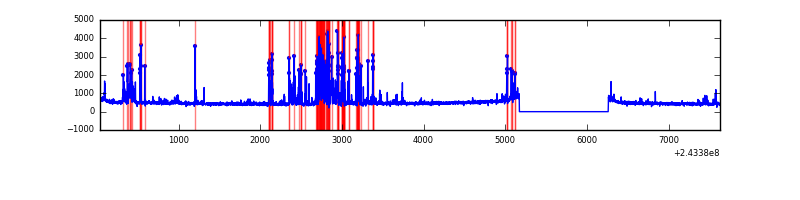 |
| D | 7593 | 6504 | 178 | 178 | 2.34% | 2.74% | 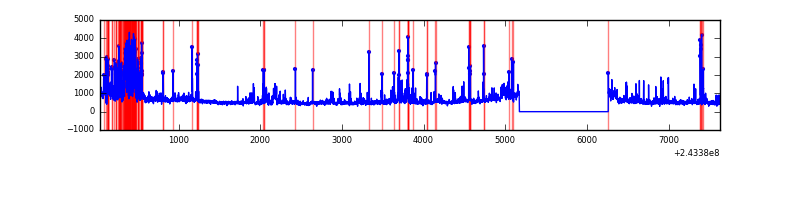 |
Top three noisy pixels from each quadrant. If the there are fewer than three noisy pixels in the level2.evt file, extra rows are filled as -1
| Pixel properties | Quadrant properties | ||||||
|---|---|---|---|---|---|---|---|
| Quadrant | DetID | PixID | Counts | Sigma | Mean | Median | Sigma |
| A | 1 | 162 | 14604 | 88.11 | 769 | 754 | 157.2 |
| A | 0 | 226 | 7049 | 40.05 | 769 | 754 | 157.2 |
| A | 12 | 194 | 6059 | 33.75 | 769 | 754 | 157.2 |
| B | 4 | 239 | 1327532 | 9171.06 | 766 | 748 | 144.7 |
| B | 0 | 214 | 83597 | 572.67 | 766 | 748 | 144.7 |
| B | 15 | 185 | 48420 | 329.52 | 766 | 748 | 144.7 |
| C | 4 | 254 | 806836 | 4683.04 | 749 | 755 | 172.1 |
| C | 4 | 175 | 24832 | 139.88 | 749 | 755 | 172.1 |
| C | 13 | 61 | 5728 | 28.89 | 749 | 755 | 172.1 |
| D | 14 | 34 | 405120 | 2293.41 | 732 | 713 | 176.3 |
| D | 8 | 195 | 362240 | 2050.23 | 732 | 713 | 176.3 |
| D | 2 | 16 | 323701 | 1831.68 | 732 | 713 | 176.3 |
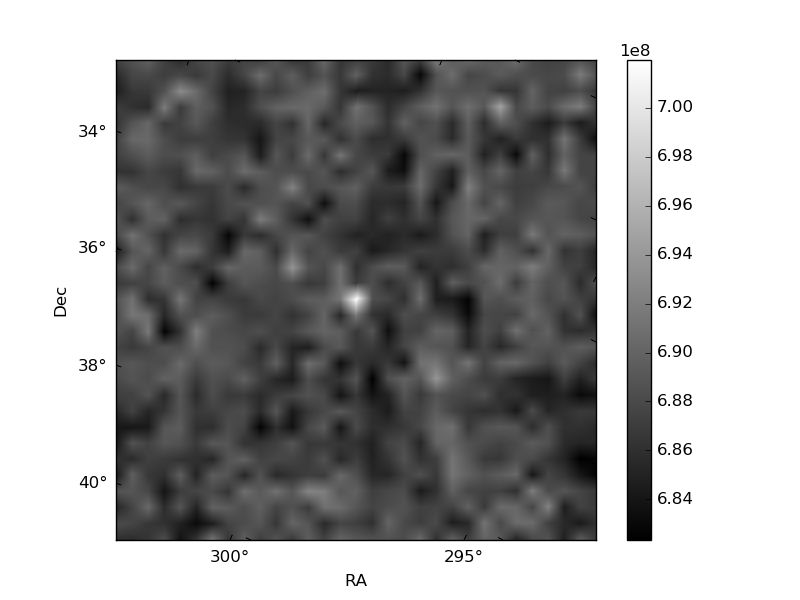
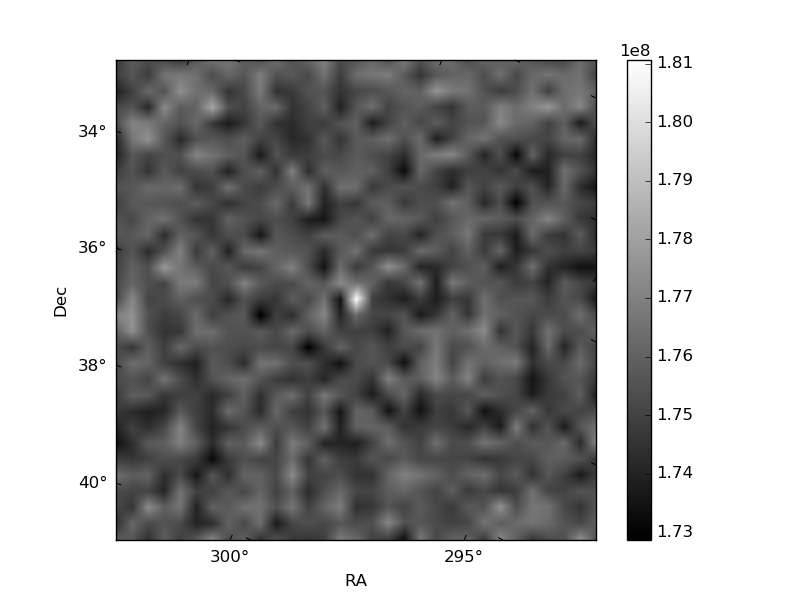
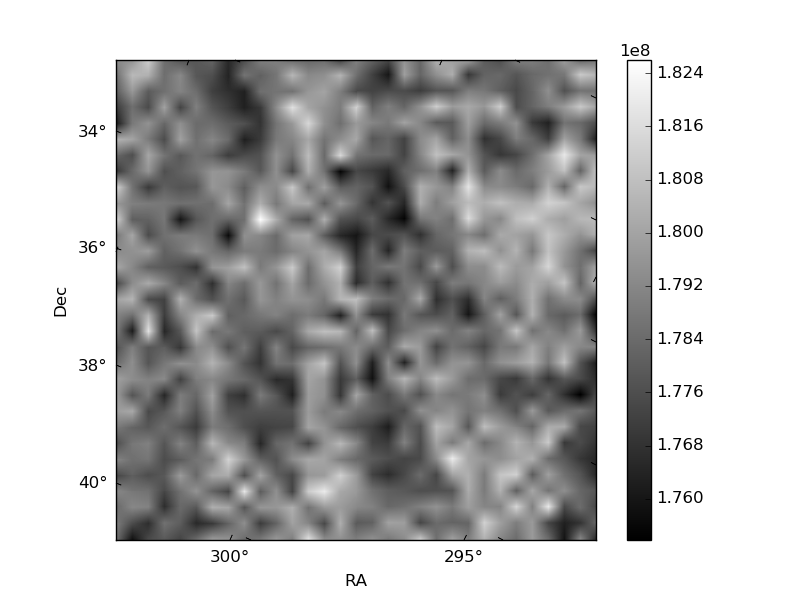
Histogram calculated using DETX and DETY for each event in the final _common_clean file
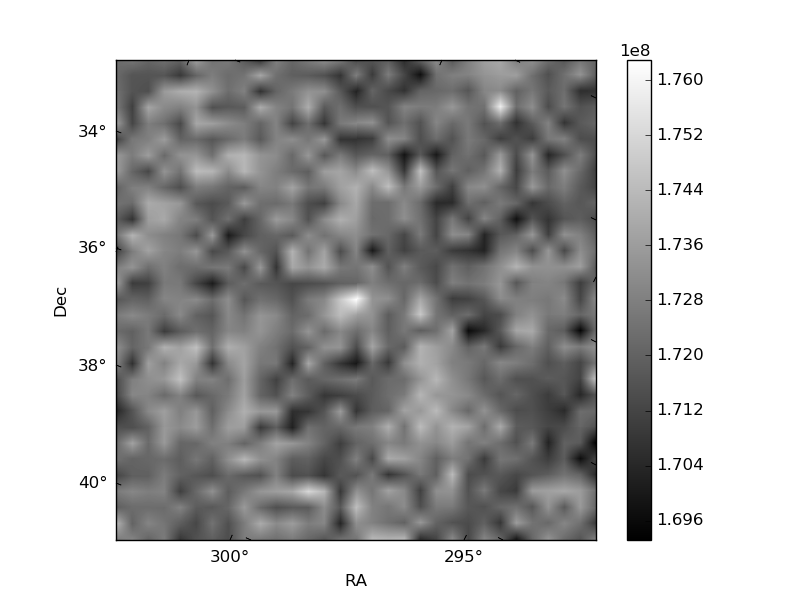
| Quadrant A | 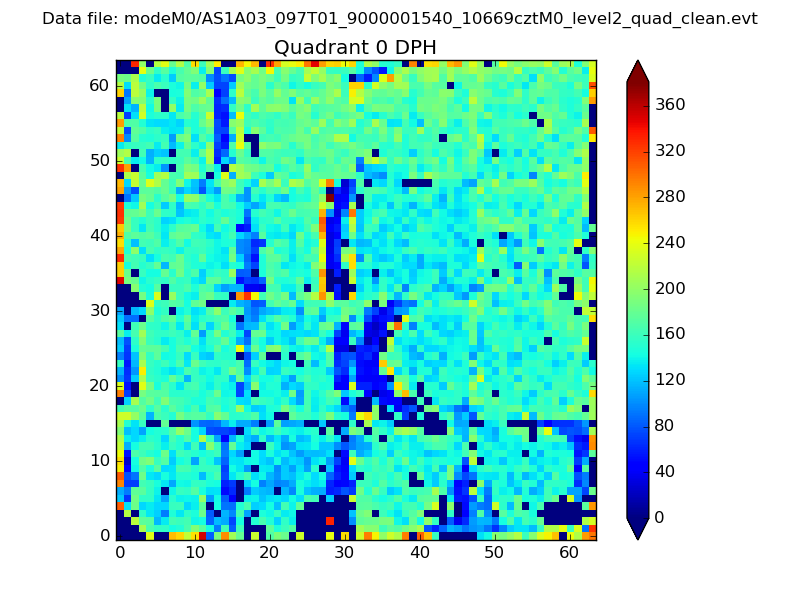 |
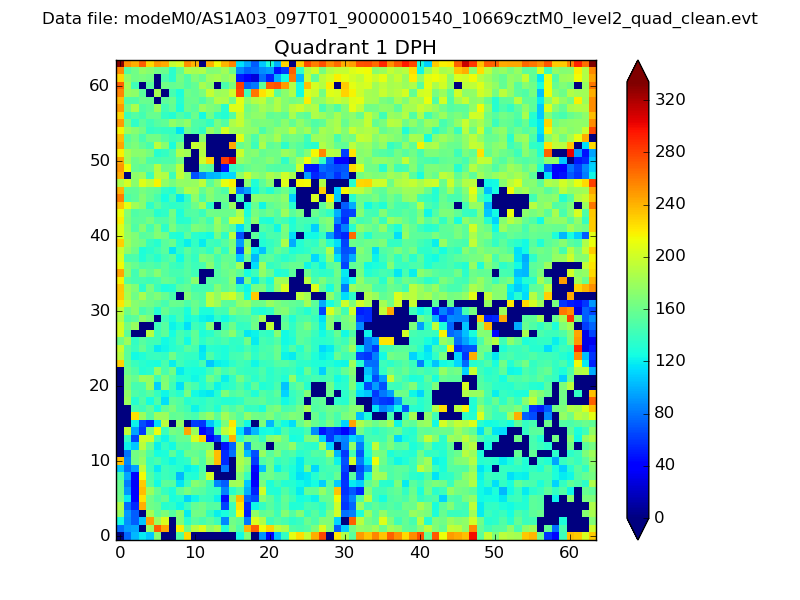 |
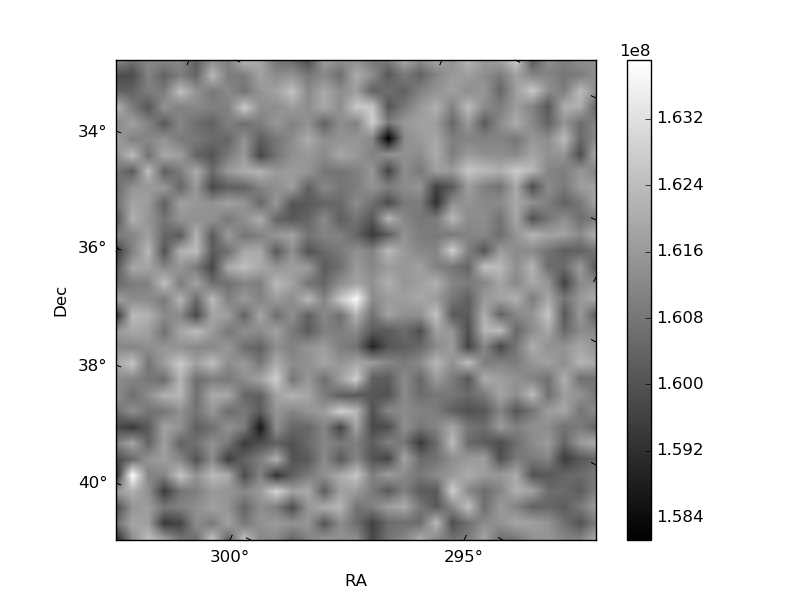
Quadrant B |
|---|---|---|---|
| Quadrant D | 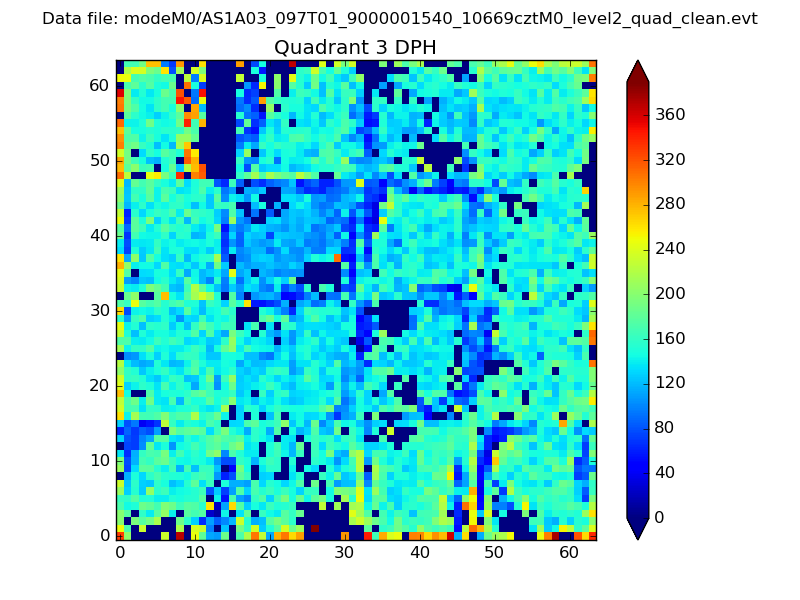 |
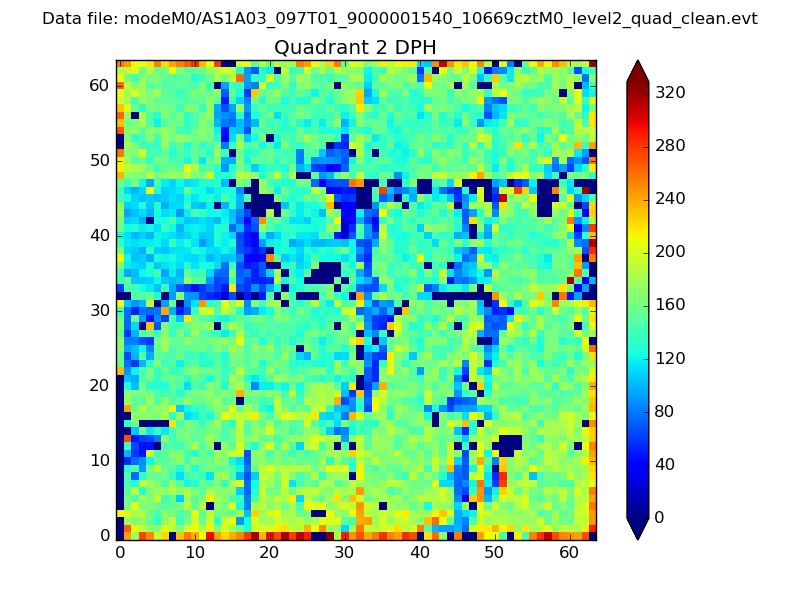 |
Quadrant C |
| Plot type | Count rate plots | Images |
|---|---|---|
| Comparison with Poisson distribution Blue bars denote a histogram of data divided into 1 sec bins. Red curve is a Poisson curve with rate = median count rate of data. |
 |
 |
| Quadrant-wise count rates Data is divided into 100 sec bins |
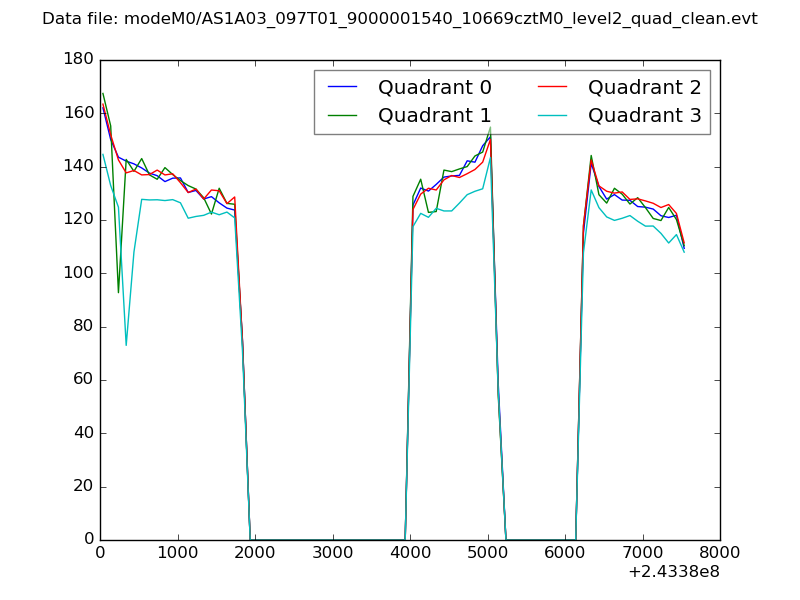 |
|
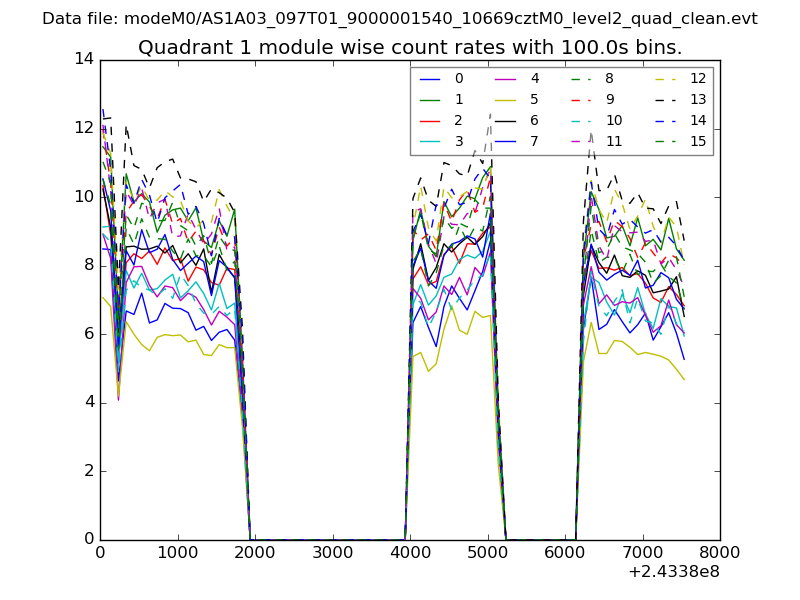
| Module-wise count rates for Quadrant A Data is divided into 100 sec bins |
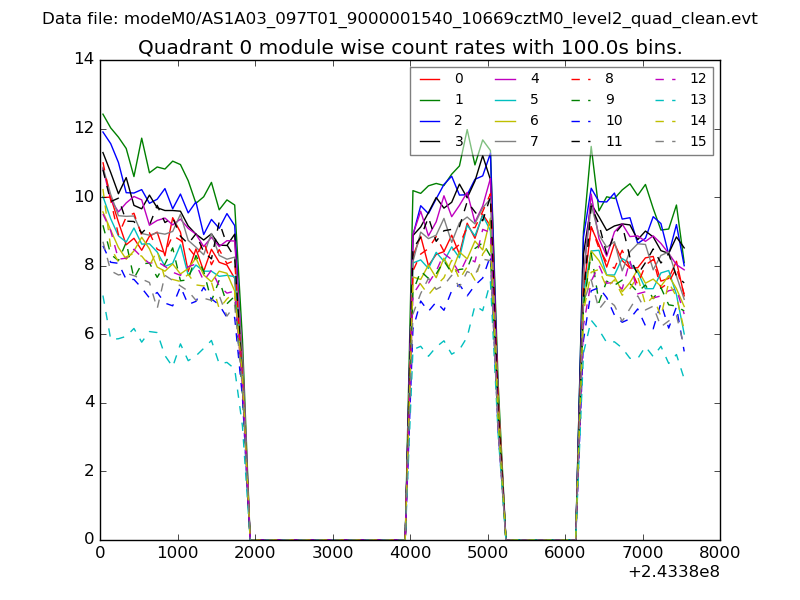 |
 |
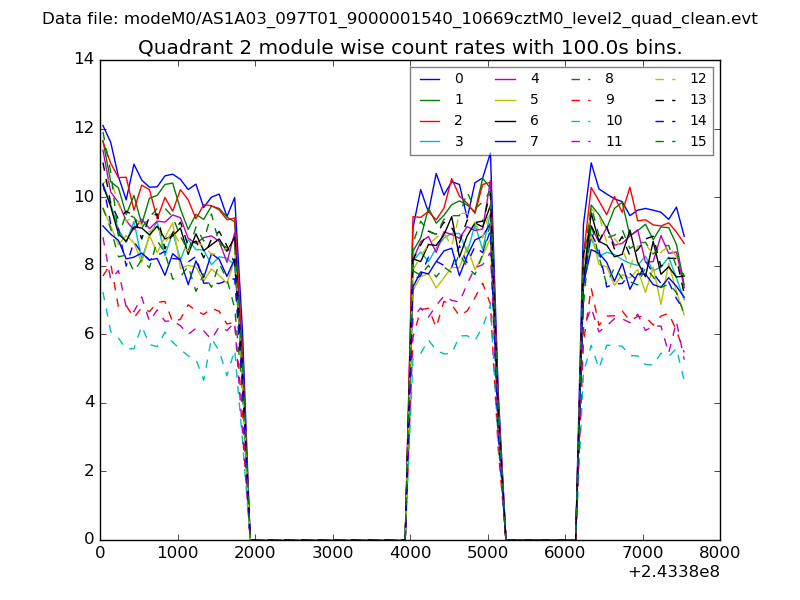
| Module-wise count rates for Quadrant B Data is divided into 100 sec bins |
 |
 |
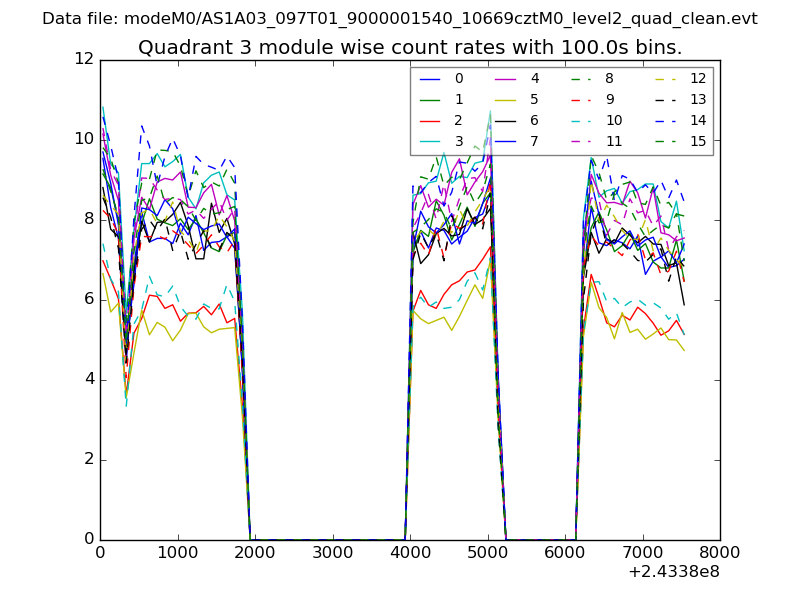
| Module-wise count rates for Quadrant C Data is divided into 100 sec bins |
 |
 |
| Module-wise count rates for Quadrant D Data is divided into 100 sec bins |
 |
 |
| Parameter | Plot |
|---|---|
| CZT HV Monitor |  |
| D_VDD | 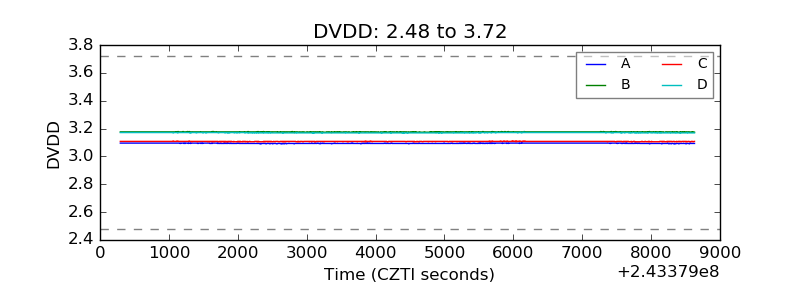 |
| Temperature 1 | 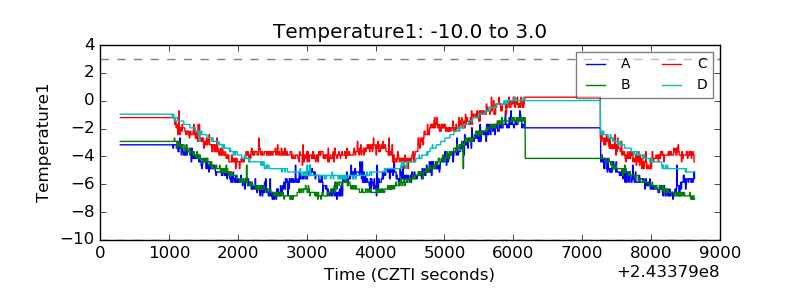 |
| Veto HV Monitor | 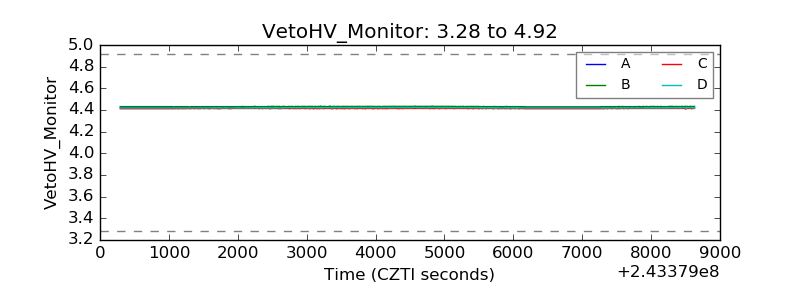 |
| Veto LLD | 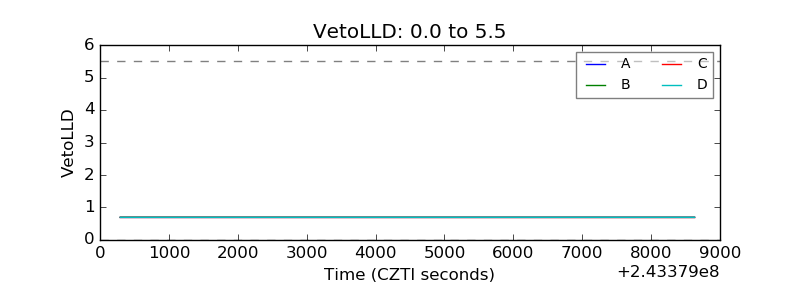 |
| Alpha Counter | 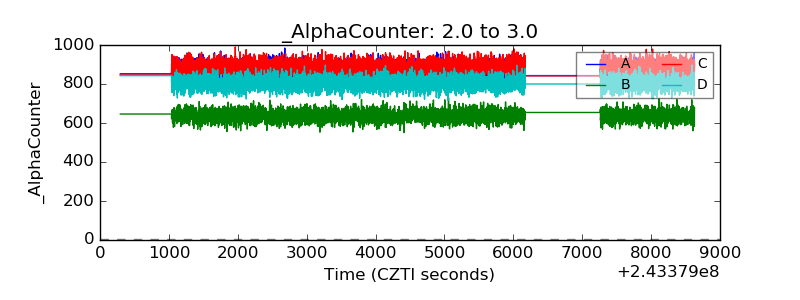 |
| _CPM_Rate | 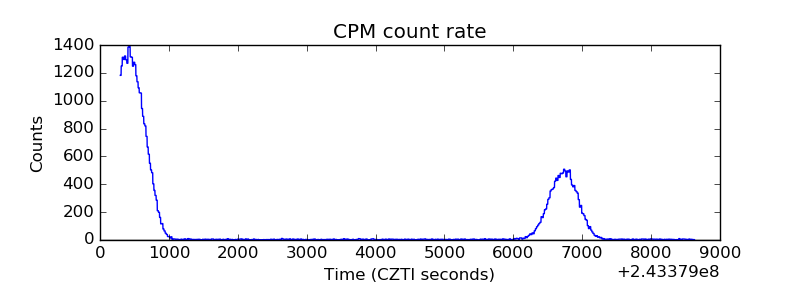 |
| CZT Counter | 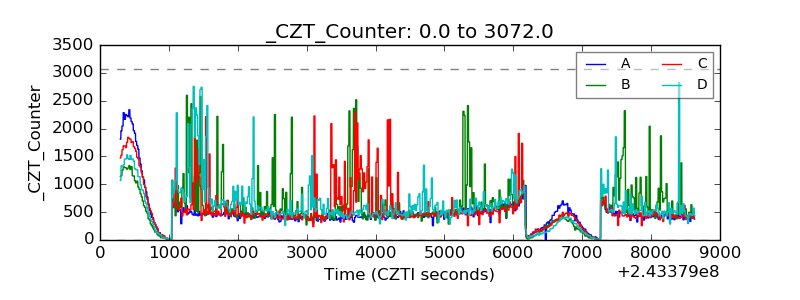 |
| +2.5 Volts monitor |  |
| +5 Volts monitor |  |
| _ROLL_ROT | 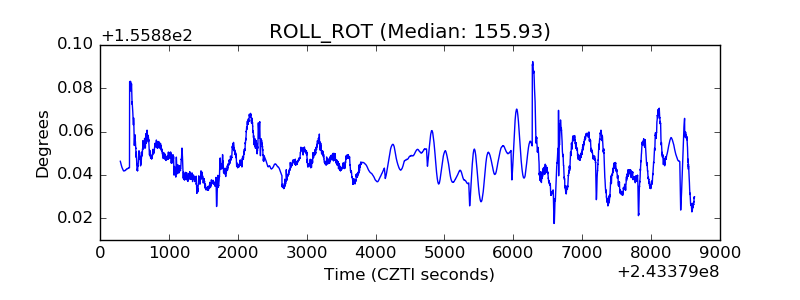 |
| _Roll_DEC | 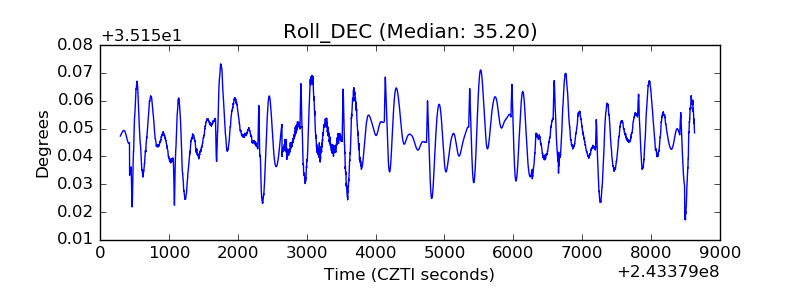 |
| _Roll_RA | 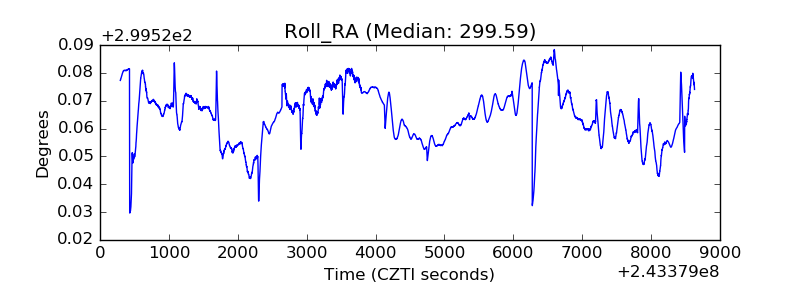 |
| Veto Counter | 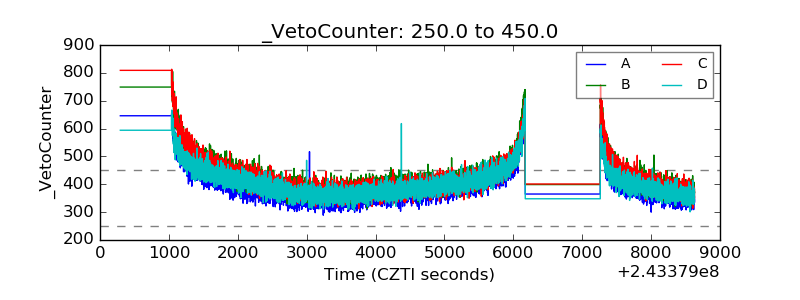 |