| Param | Original file | Final file |
|---|---|---|
| Filename | modeM0/AS1A03_097T01_9000001540_10670cztM0_level2.evt | modeM0/AS1A03_097T01_9000001540_10670cztM0_level2_quad_clean.evt |
| Size (bytes) | 521,043,840 | 90,293,760 |
| Size | 496.9 MB | 86.1 MB |
| Events in quadrant A | 3,252,825 | 571,867 |
| Events in quadrant B | 4,458,150 | 572,076 |
| Events in quadrant C | 3,470,943 | 572,133 |
| Events in quadrant D | 4,133,407 | 540,971 |
| Mode M9 | |||
|---|---|---|---|
| Quadrant | BADHDUFLAG | Total packets | Discarded packets |
| A | 0 | 16 | 0 |
| B | 0 | 16 | 0 |
| C | 0 | 16 | 0 |
| D | 0 | 17 | 0 |
| Mode M0 | |||
|---|---|---|---|
| Quadrant | BADHDUFLAG | Total packets | Discarded packets |
| A | 0 | 14475 | 3 |
| B | 0 | 17930 | 2 |
| C | 0 | 14970 | 2 |
| D | 0 | 16838 | 2 |
| Mode SS | |||
|---|---|---|---|
| Quadrant | BADHDUFLAG | Total packets | Discarded packets |
| A | 0 | 140 | 0 |
| B | 0 | 140 | 0 |
| C | 0 | 140 | 0 |
| D | 0 | 140 | 0 |
| Quadrant | Total seconds | Saturated seconds | Saturation percentage |
|---|---|---|---|
| A | 6845 | 64 | 0.934989% |
| B | 6845 | 298 | 4.353543% |
| C | 6845 | 101 | 1.475530% |
| D | 6845 | 101 | 1.475530% |
Noise dominated data is calculated using 1-second bins in cleaned event files. If a bin has >2000 counts, and if more than 50% of those come from <1% of pixels, then it is considered to be noise-dominated and hence unusable.
| Quadrant | # 1 sec bins | Bins with >0 counts | Bins with >2000 counts | High rate bins dominated by noise | Noise dominated (total time) | Noise dominated (detector-on time) | Marked lightcurve |
|---|---|---|---|---|---|---|---|
| A | 7580 | 6846 | 13 | 13 | 0.17% | 0.19% | 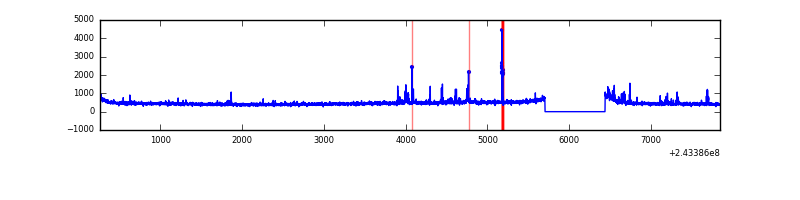 |
| B | 7580 | 6846 | 156 | 156 | 2.06% | 2.28% | 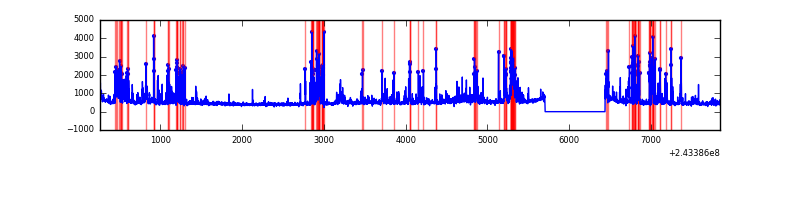 |
| C | 7580 | 6846 | 48 | 48 | 0.63% | 0.70% | 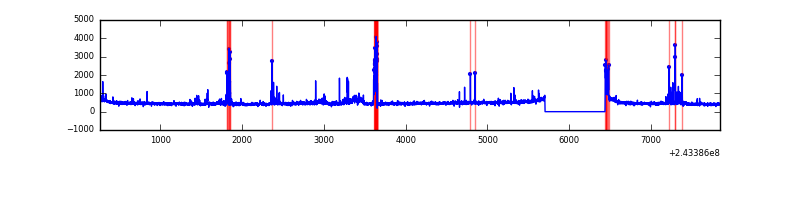 |
| D | 7580 | 6846 | 49 | 49 | 0.65% | 0.72% | 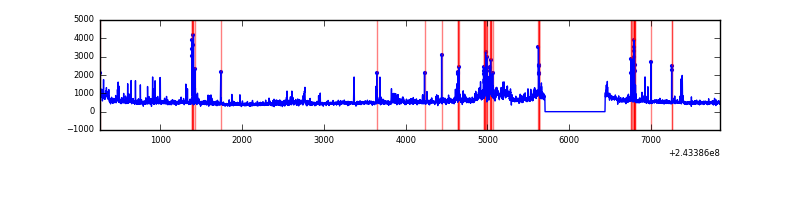 |
Top three noisy pixels from each quadrant. If the there are fewer than three noisy pixels in the level2.evt file, extra rows are filled as -1
| Pixel properties | Quadrant properties | ||||||
|---|---|---|---|---|---|---|---|
| Quadrant | DetID | PixID | Counts | Sigma | Mean | Median | Sigma |
| A | 4 | 2 | 127996 | 782.96 | 794 | 777 | 162.5 |
| A | 15 | 174 | 34309 | 206.37 | 794 | 777 | 162.5 |
| A | 1 | 162 | 14536 | 84.68 | 794 | 777 | 162.5 |
| B | 4 | 239 | 1209220 | 7944.5 | 792 | 772 | 152.1 |
| B | 15 | 185 | 48169 | 311.59 | 792 | 772 | 152.1 |
| B | 0 | 214 | 41224 | 265.94 | 792 | 772 | 152.1 |
| C | 4 | 254 | 420909 | 2328.52 | 773 | 778 | 180.4 |
| C | 4 | 175 | 24448 | 131.19 | 773 | 778 | 180.4 |
| C | 14 | 234 | 8136 | 40.78 | 773 | 778 | 180.4 |
| D | 2 | 16 | 339737 | 1840.06 | 768 | 748 | 184.2 |
| D | 8 | 195 | 331771 | 1796.82 | 768 | 748 | 184.2 |
| D | 10 | 199 | 174389 | 942.54 | 768 | 748 | 184.2 |
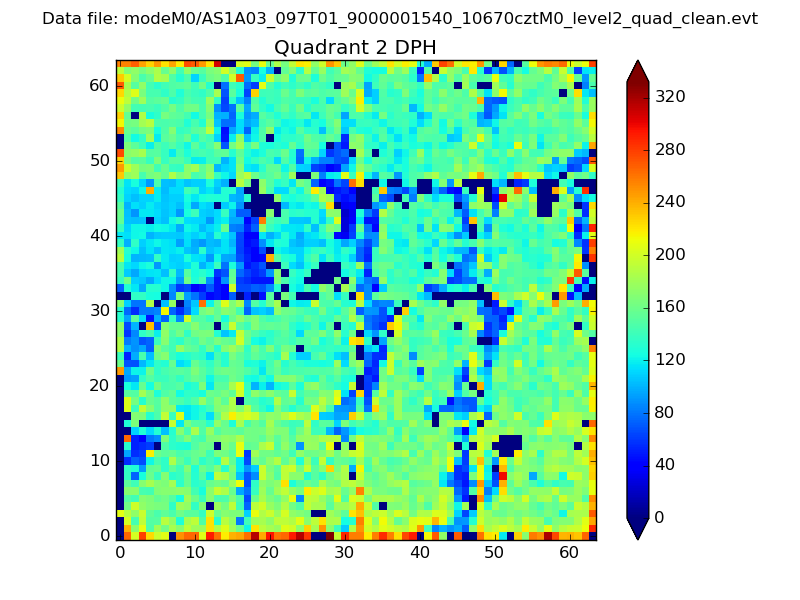
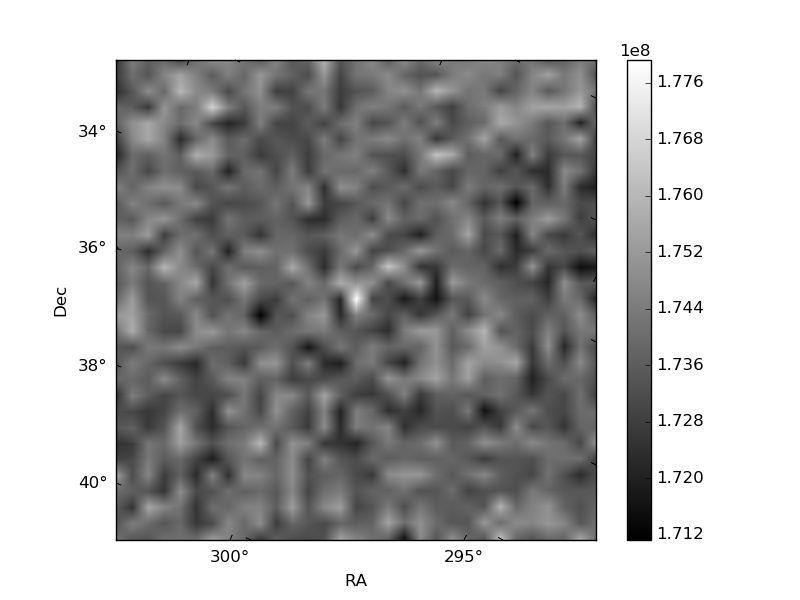
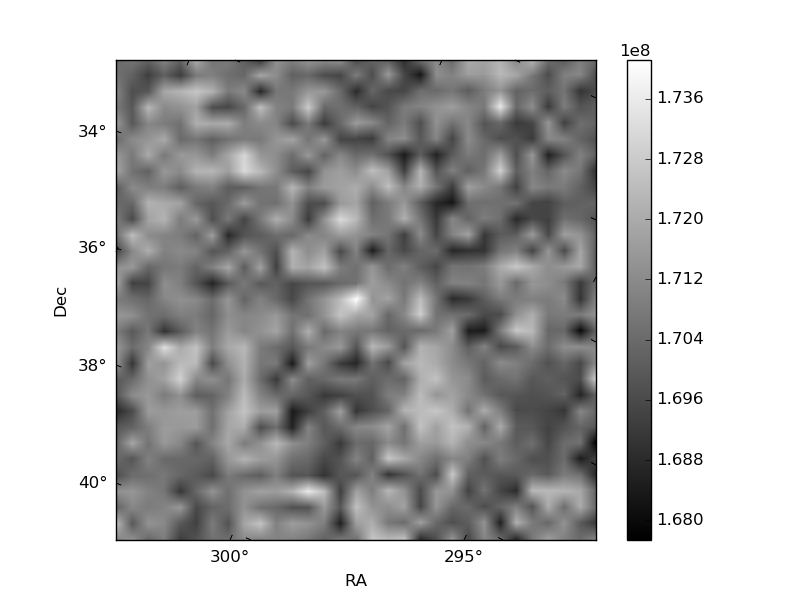
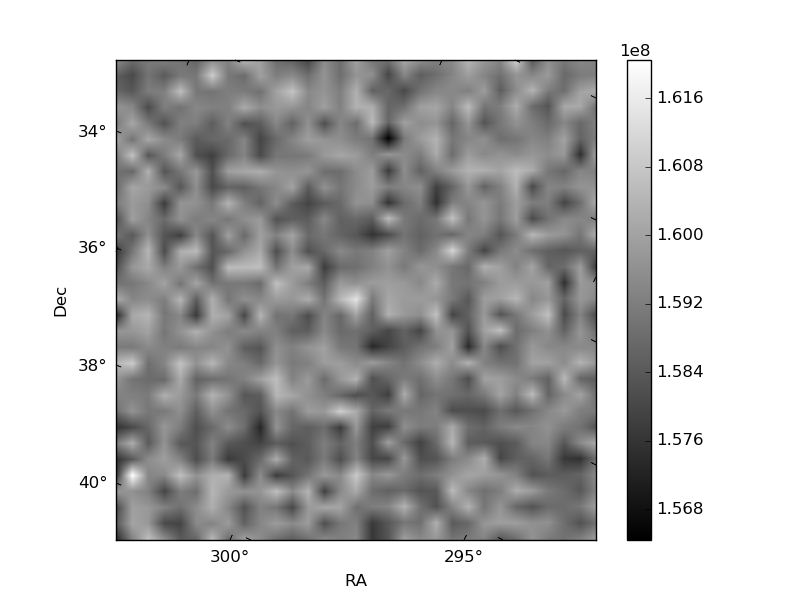
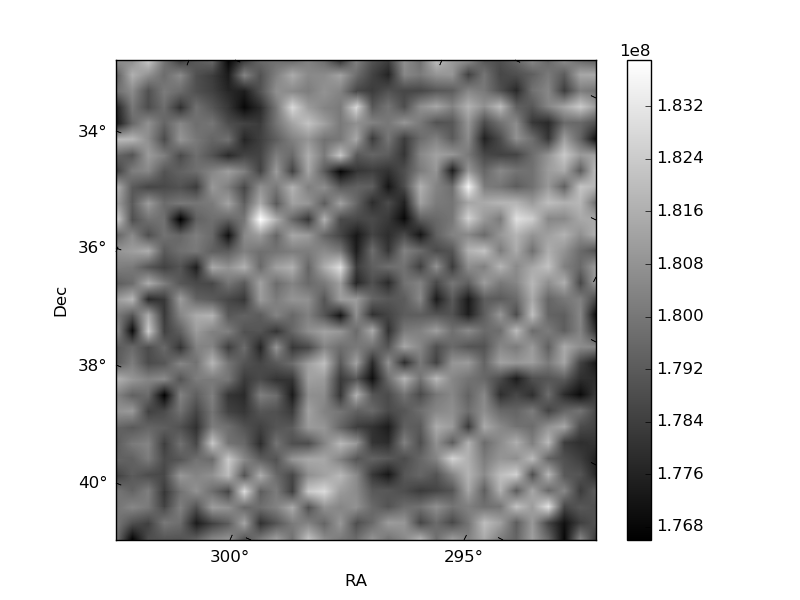
Histogram calculated using DETX and DETY for each event in the final _common_clean file
| Quadrant A |  |
 |
Quadrant B |
|---|---|---|---|
| Quadrant D | 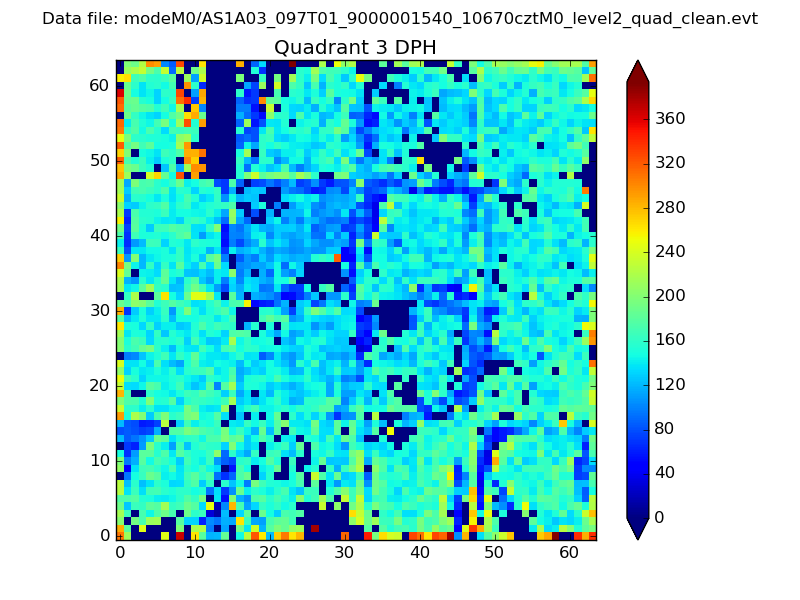 |
 |
Quadrant C |
| Plot type | Count rate plots | Images |
|---|---|---|
| Comparison with Poisson distribution Blue bars denote a histogram of data divided into 1 sec bins. Red curve is a Poisson curve with rate = median count rate of data. |
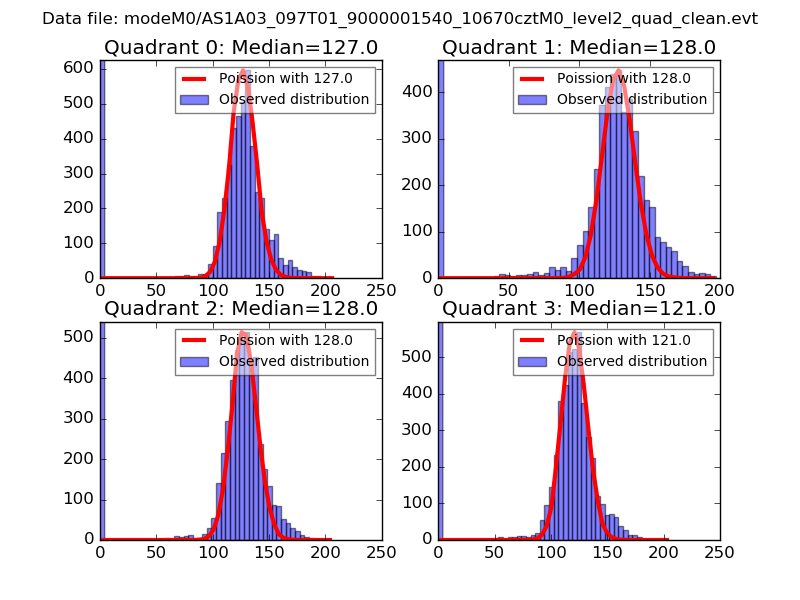 |
 |
| Quadrant-wise count rates Data is divided into 100 sec bins |
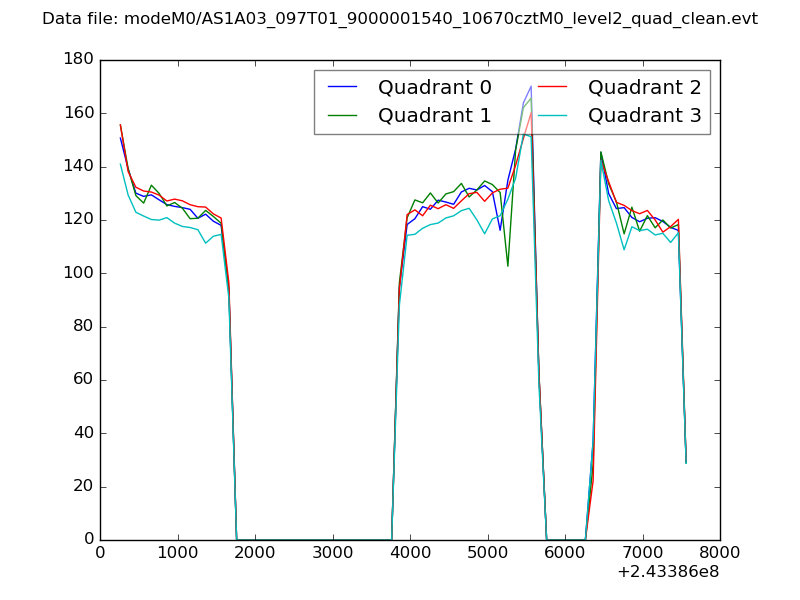 |
|
| Module-wise count rates for Quadrant A Data is divided into 100 sec bins |
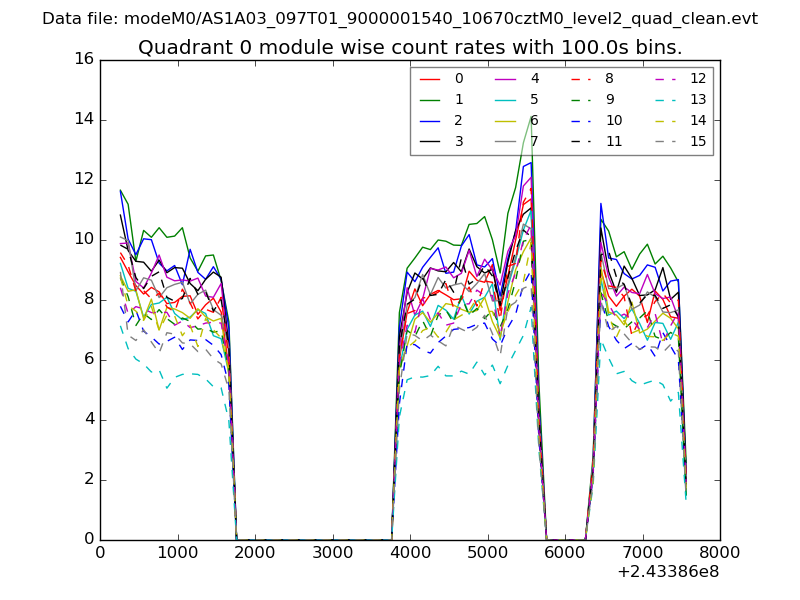 |
 |
| Module-wise count rates for Quadrant B Data is divided into 100 sec bins |
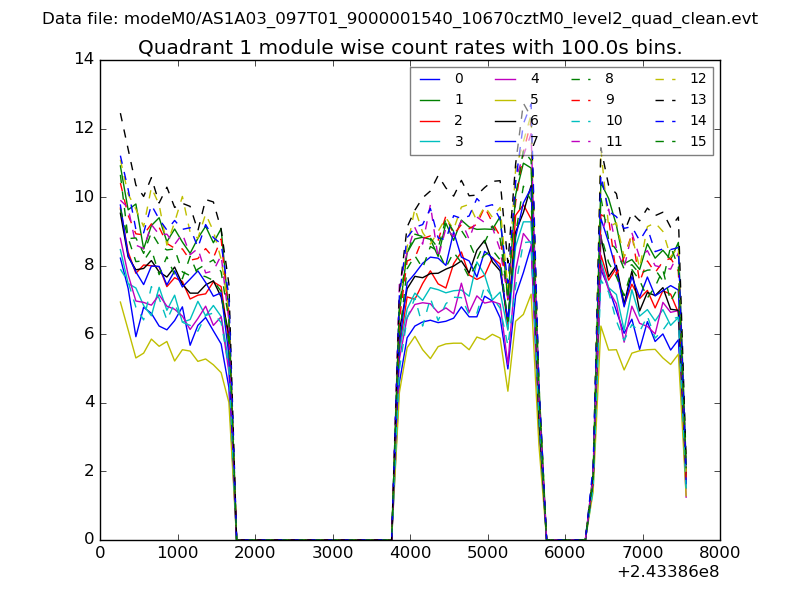 |
 |
| Module-wise count rates for Quadrant C Data is divided into 100 sec bins |
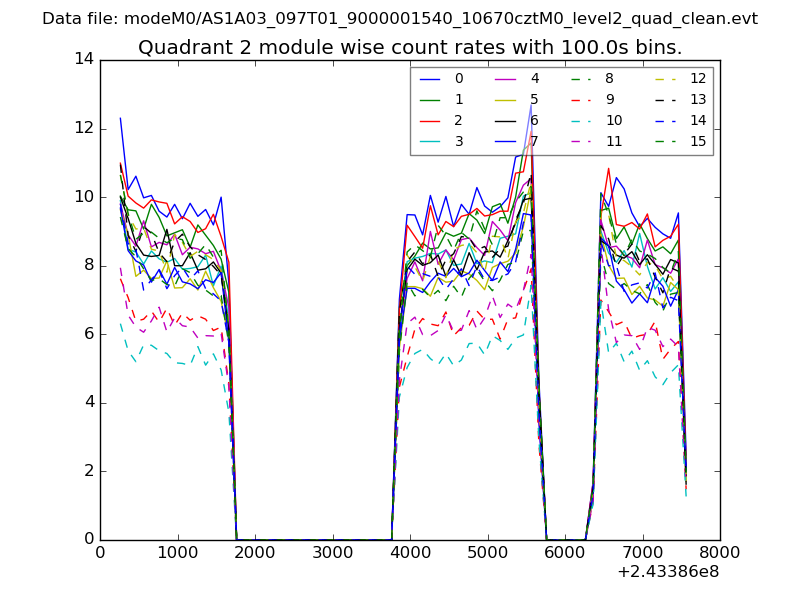 |
 |
| Module-wise count rates for Quadrant D Data is divided into 100 sec bins |
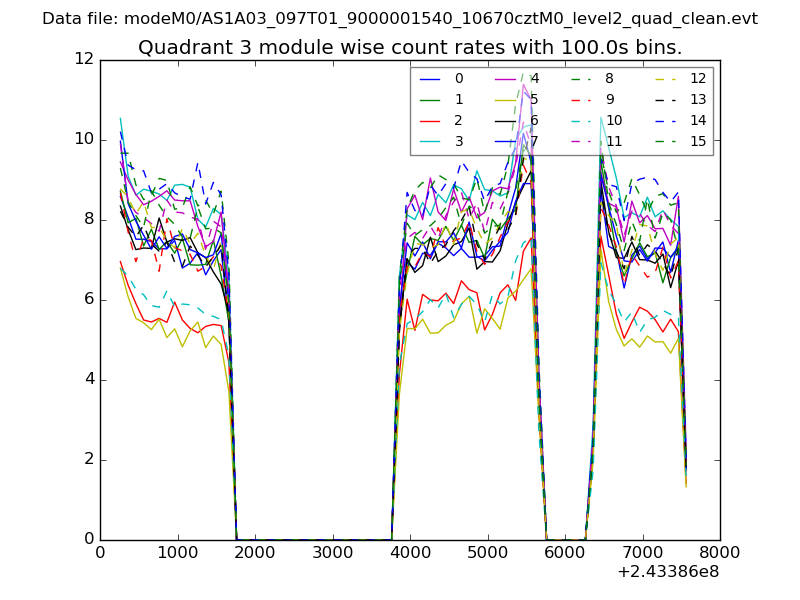 |
 |
| Parameter | Plot |
|---|---|
| CZT HV Monitor | 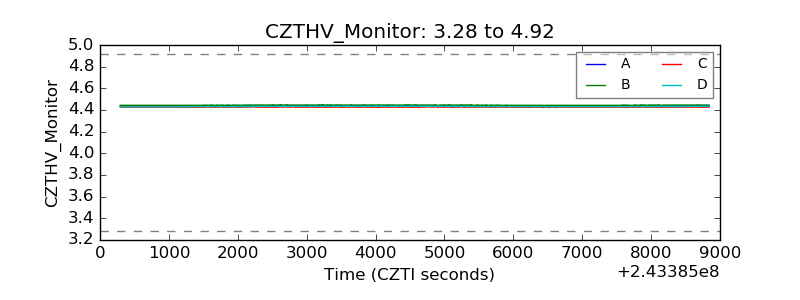 |
| D_VDD | 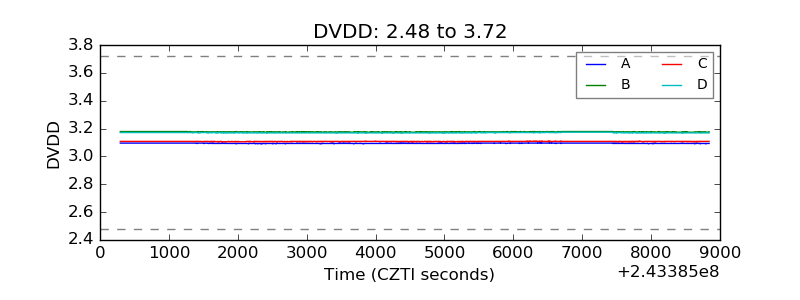 |
| Temperature 1 | 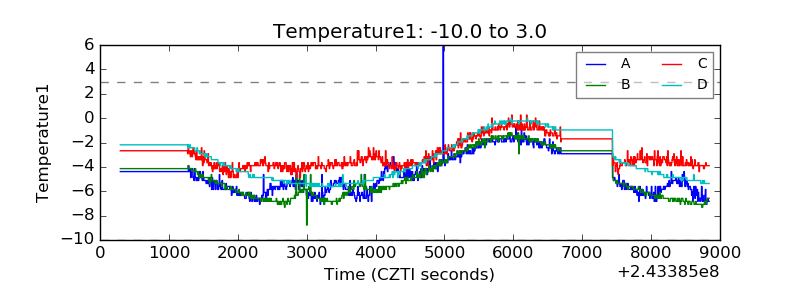 |
| Veto HV Monitor | 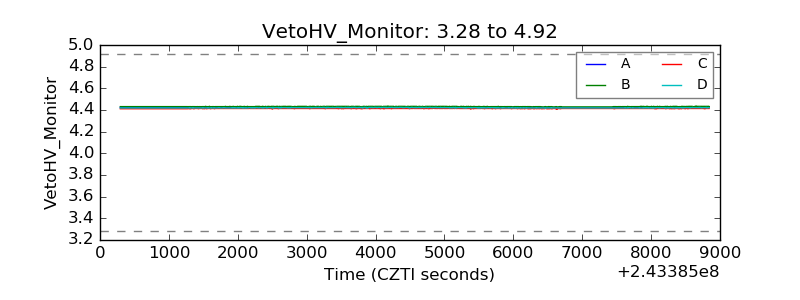 |
| Veto LLD | 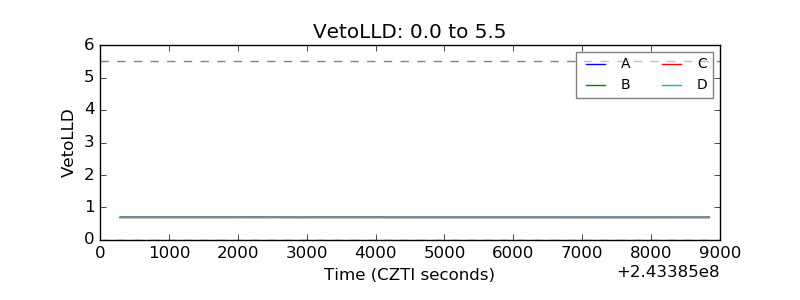 |
| Alpha Counter | 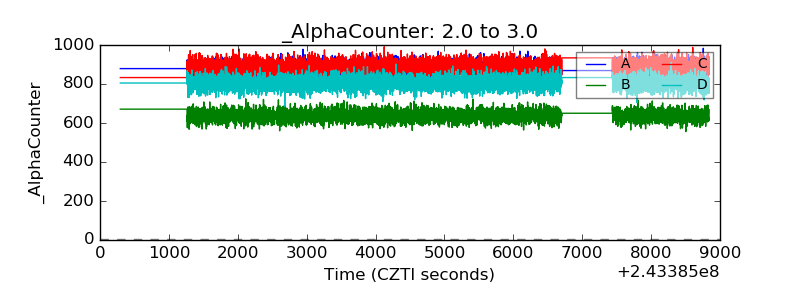 |
| _CPM_Rate | 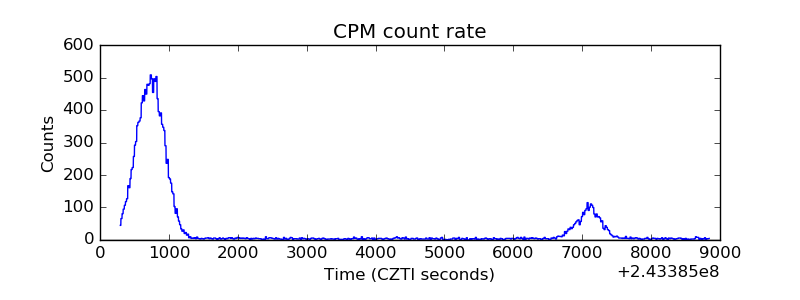 |
| CZT Counter | 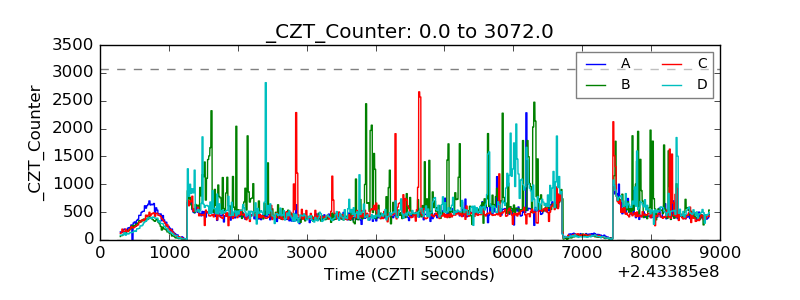 |
| +2.5 Volts monitor |  |
| +5 Volts monitor | 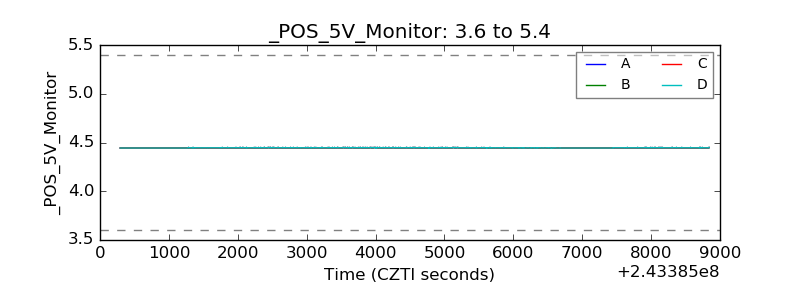 |
| _ROLL_ROT | 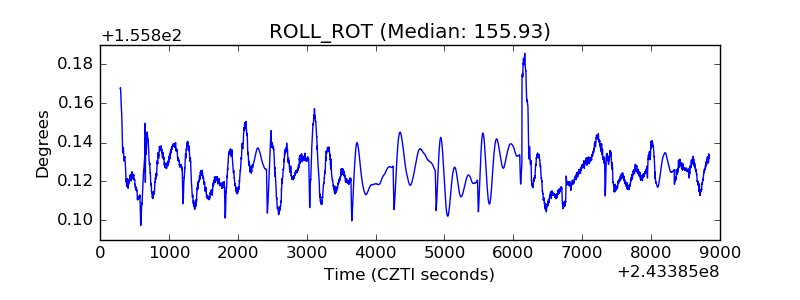 |
| _Roll_DEC | 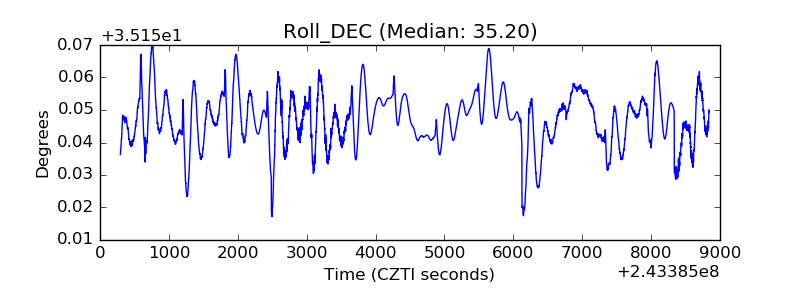 |
| _Roll_RA | 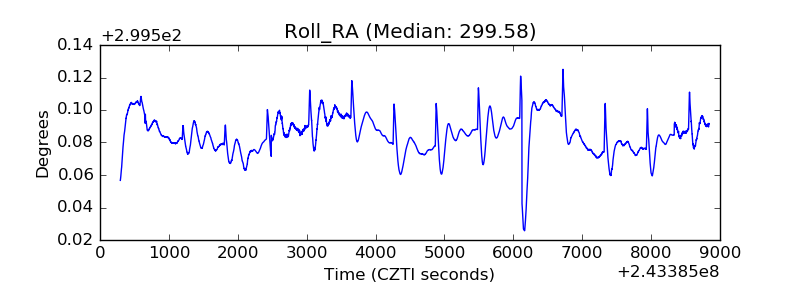 |
| Veto Counter |  |