| Param | Original file | Final file |
|---|---|---|
| Filename | modeM0/AS1A03_097T01_9000001540_10671cztM0_level2.evt | modeM0/AS1A03_097T01_9000001540_10671cztM0_level2_quad_clean.evt |
| Size (bytes) | 554,109,120 | 89,496,000 |
| Size | 528.4 MB | 85.4 MB |
| Events in quadrant A | 3,416,699 | 565,030 |
| Events in quadrant B | 4,403,151 | 559,457 |
| Events in quadrant C | 3,340,967 | 565,152 |
| Events in quadrant D | 5,125,428 | 512,252 |
| Mode M9 | |||
|---|---|---|---|
| Quadrant | BADHDUFLAG | Total packets | Discarded packets |
| A | 0 | 1 | 0 |
| B | 0 | 1 | 0 |
| C | 0 | 1 | 0 |
| D | 0 | 1 | 0 |
| Mode M0 | |||
|---|---|---|---|
| Quadrant | BADHDUFLAG | Total packets | Discarded packets |
| A | 0 | 15203 | 3 |
| B | 0 | 17940 | 2 |
| C | 0 | 15084 | 2 |
| D | 0 | 19825 | 2 |
| Mode SS | |||
|---|---|---|---|
| Quadrant | BADHDUFLAG | Total packets | Discarded packets |
| A | 0 | 150 | 0 |
| B | 0 | 150 | 0 |
| C | 0 | 150 | 0 |
| D | 0 | 150 | 0 |
| Quadrant | Total seconds | Saturated seconds | Saturation percentage |
|---|---|---|---|
| A | 7289 | 82 | 1.124983% |
| B | 7289 | 367 | 5.034984% |
| C | 7289 | 50 | 0.685965% |
| D | 7289 | 455 | 6.242283% |
Noise dominated data is calculated using 1-second bins in cleaned event files. If a bin has >2000 counts, and if more than 50% of those come from <1% of pixels, then it is considered to be noise-dominated and hence unusable.
| Quadrant | # 1 sec bins | Bins with >0 counts | Bins with >2000 counts | High rate bins dominated by noise | Noise dominated (total time) | Noise dominated (detector-on time) | Marked lightcurve |
|---|---|---|---|---|---|---|---|
| A | 7494 | 7292 | 0 | 0 | 0.00% | 0.00% | 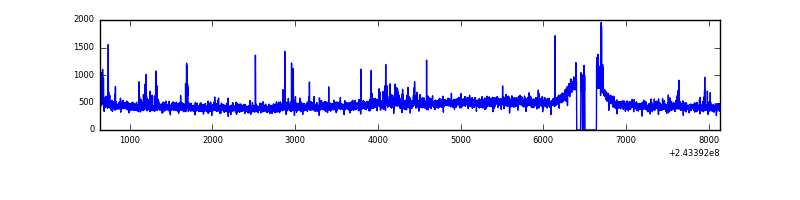 |
| B | 7494 | 7292 | 153 | 153 | 2.04% | 2.10% | 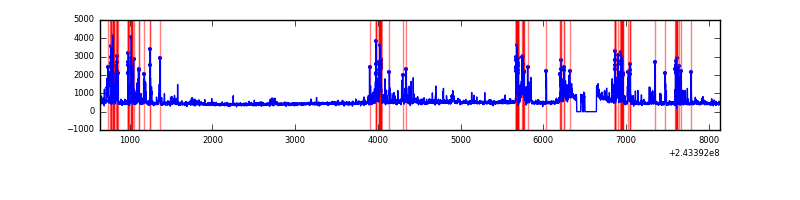 |
| C | 7494 | 7292 | 4 | 4 | 0.05% | 0.05% | 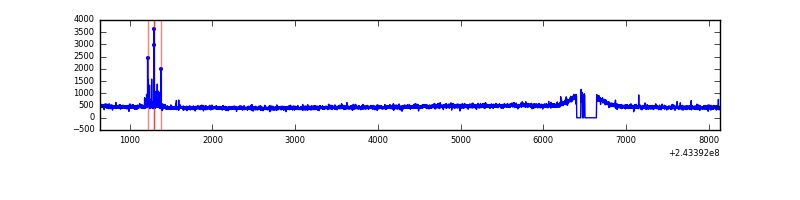 |
| D | 7494 | 7292 | 319 | 319 | 4.26% | 4.37% | 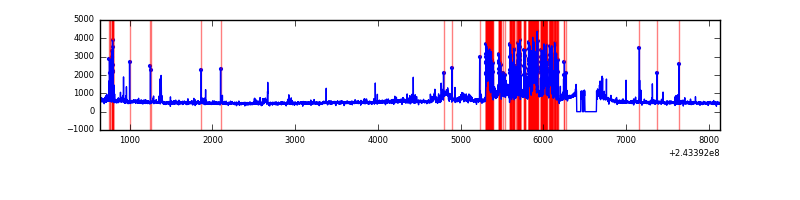 |
Top three noisy pixels from each quadrant. If the there are fewer than three noisy pixels in the level2.evt file, extra rows are filled as -1
| Pixel properties | Quadrant properties | ||||||
|---|---|---|---|---|---|---|---|
| Quadrant | DetID | PixID | Counts | Sigma | Mean | Median | Sigma |
| A | 4 | 2 | 106372 | 606.86 | 847 | 830 | 173.9 |
| A | 1 | 162 | 21135 | 116.75 | 847 | 830 | 173.9 |
| A | 11 | 29 | 9793 | 51.54 | 847 | 830 | 173.9 |
| B | 4 | 239 | 980978 | 6054.97 | 843 | 819 | 161.9 |
| B | 0 | 214 | 82164 | 502.51 | 843 | 819 | 161.9 |
| B | 15 | 204 | 40205 | 243.31 | 843 | 819 | 161.9 |
| C | 4 | 254 | 50430 | 254.79 | 833 | 838 | 194.6 |
| C | 4 | 175 | 27684 | 137.92 | 833 | 838 | 194.6 |
| C | 14 | 67 | 6439 | 28.77 | 833 | 838 | 194.6 |
| D | 10 | 199 | 885460 | 4556.35 | 801 | 776 | 194.2 |
| D | 8 | 195 | 673319 | 3463.77 | 801 | 776 | 194.2 |
| D | 12 | 233 | 169106 | 866.94 | 801 | 776 | 194.2 |
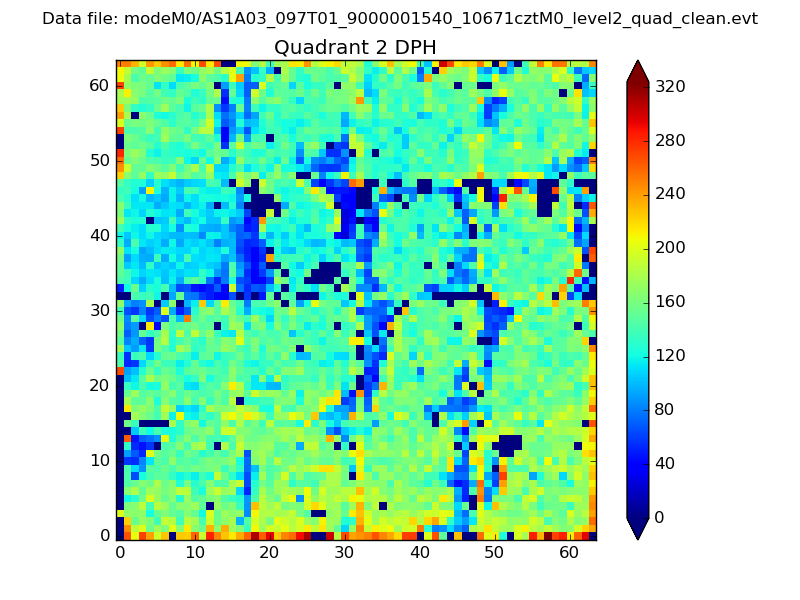
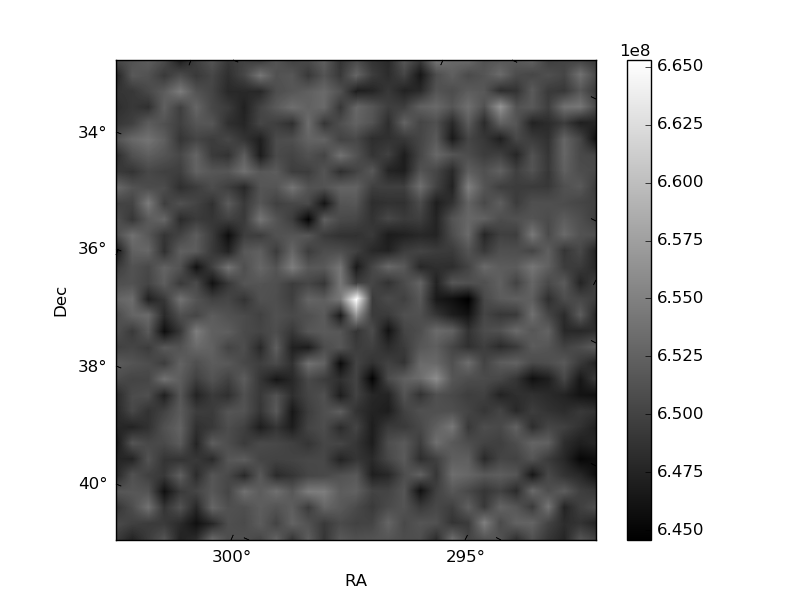
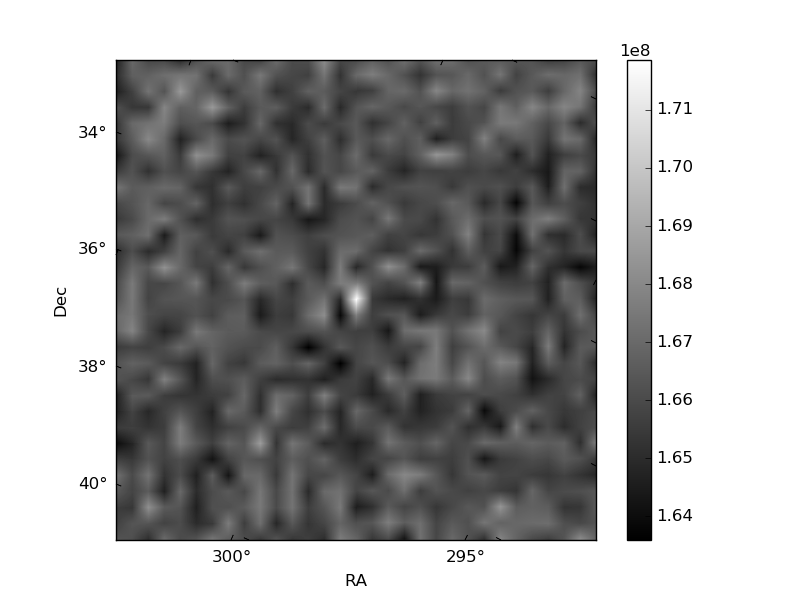
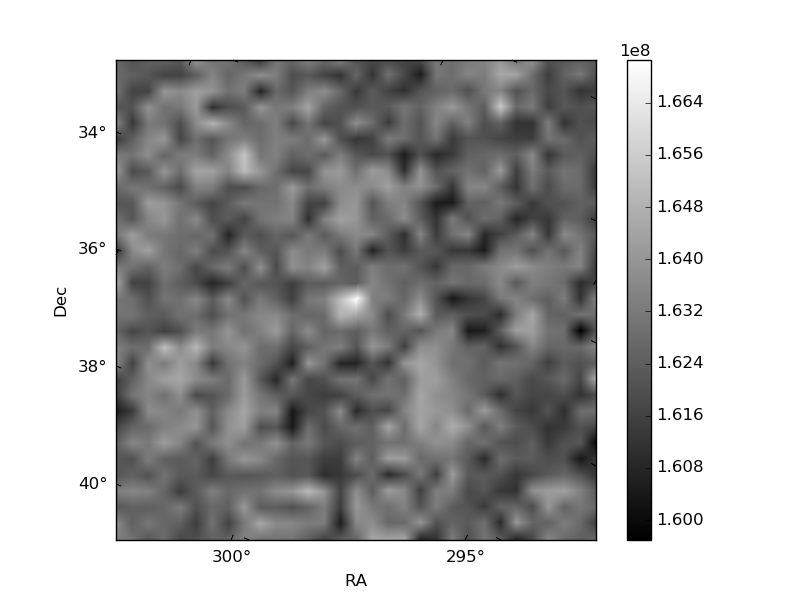
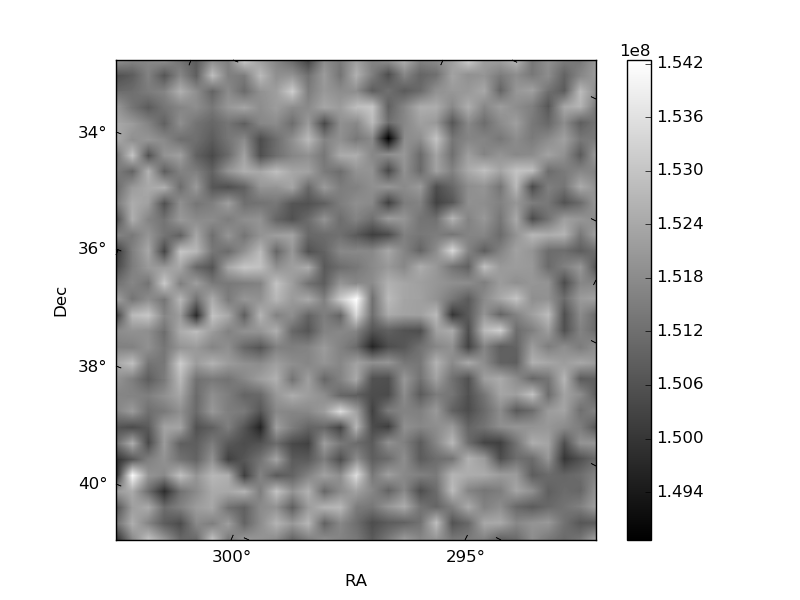
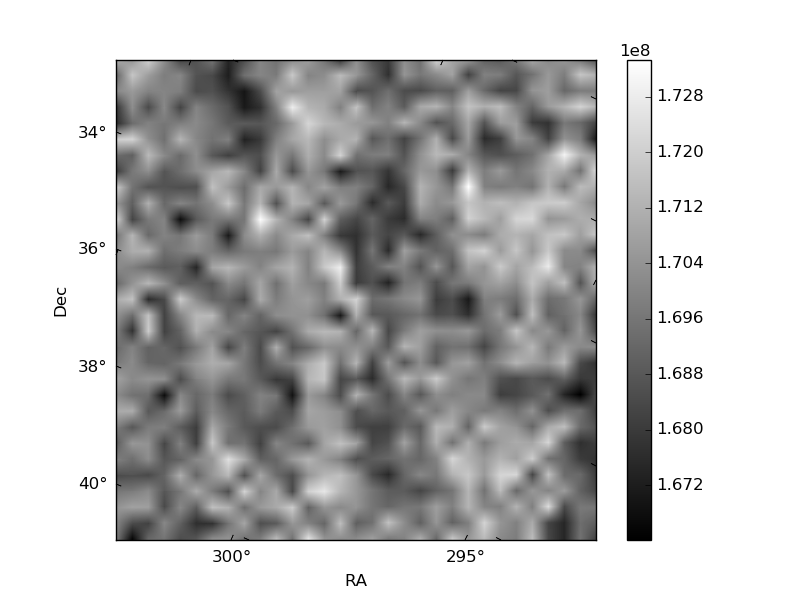
Histogram calculated using DETX and DETY for each event in the final _common_clean file
| Quadrant A | 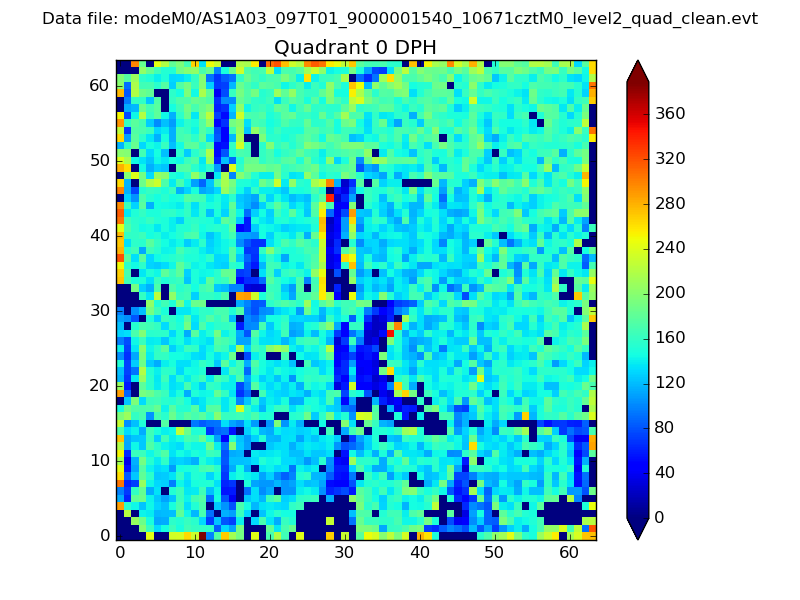 |
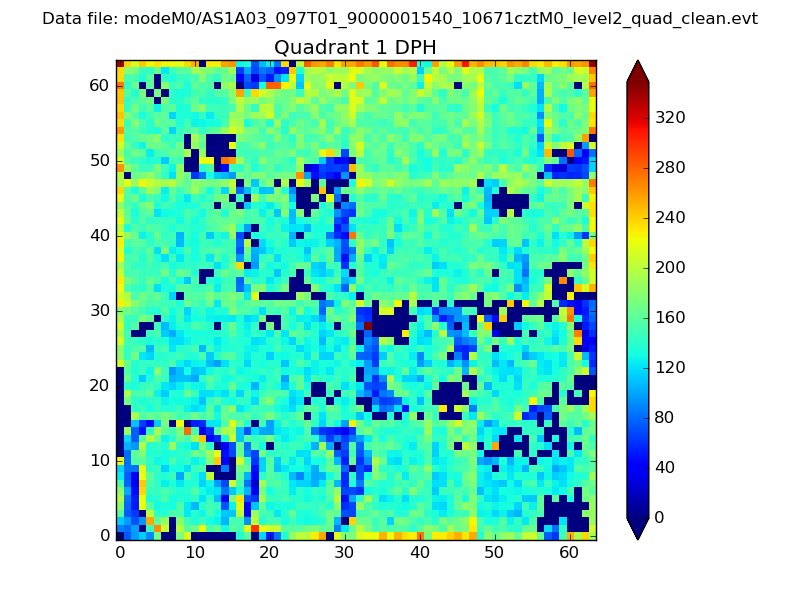 |
Quadrant B |
|---|---|---|---|
| Quadrant D | 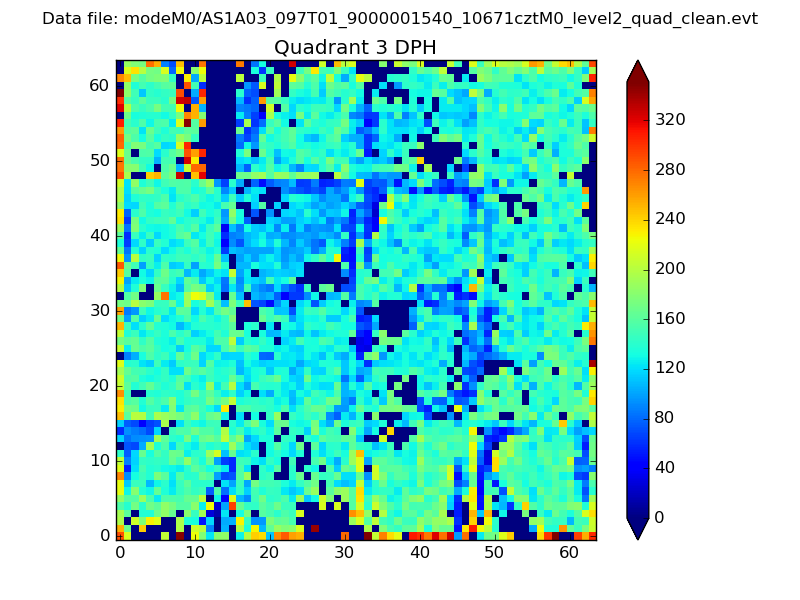 |
 |
Quadrant C |
| Plot type | Count rate plots | Images |
|---|---|---|
| Comparison with Poisson distribution Blue bars denote a histogram of data divided into 1 sec bins. Red curve is a Poisson curve with rate = median count rate of data. |
 |
 |
| Quadrant-wise count rates Data is divided into 100 sec bins |
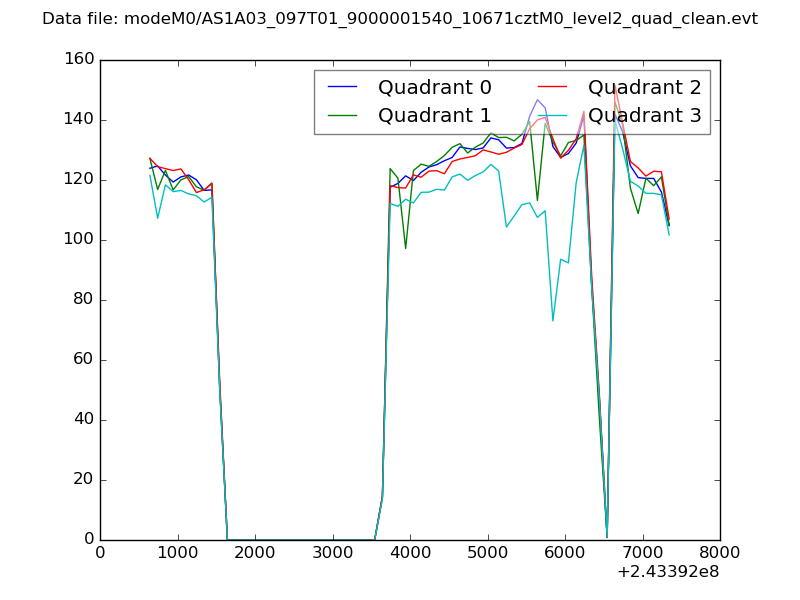 |
|
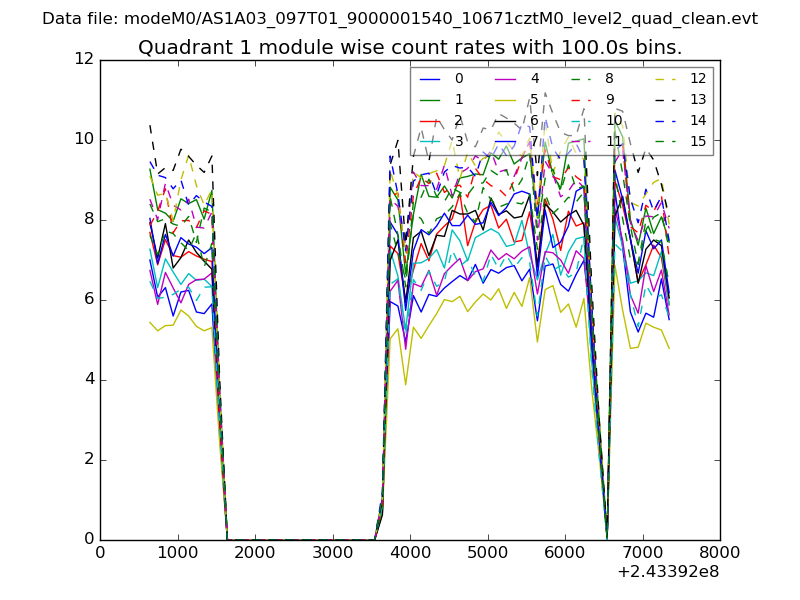
| Module-wise count rates for Quadrant A Data is divided into 100 sec bins |
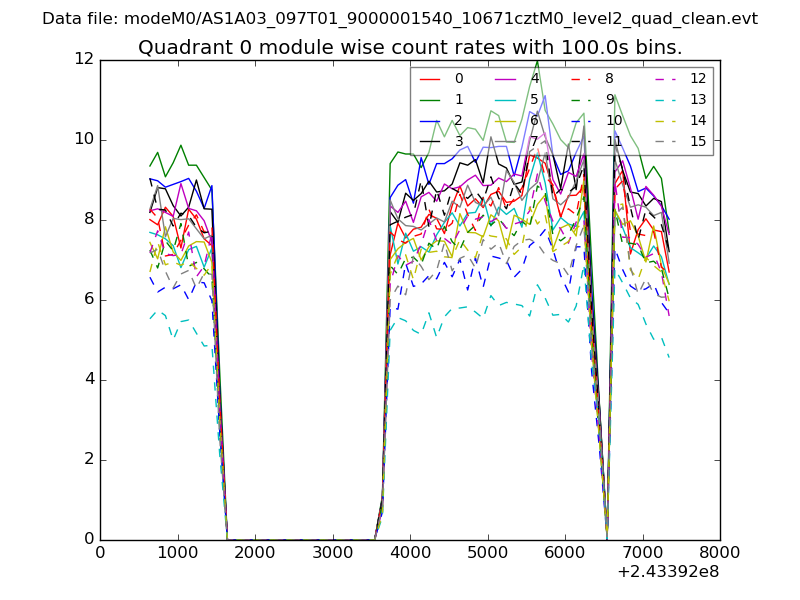 |
 |
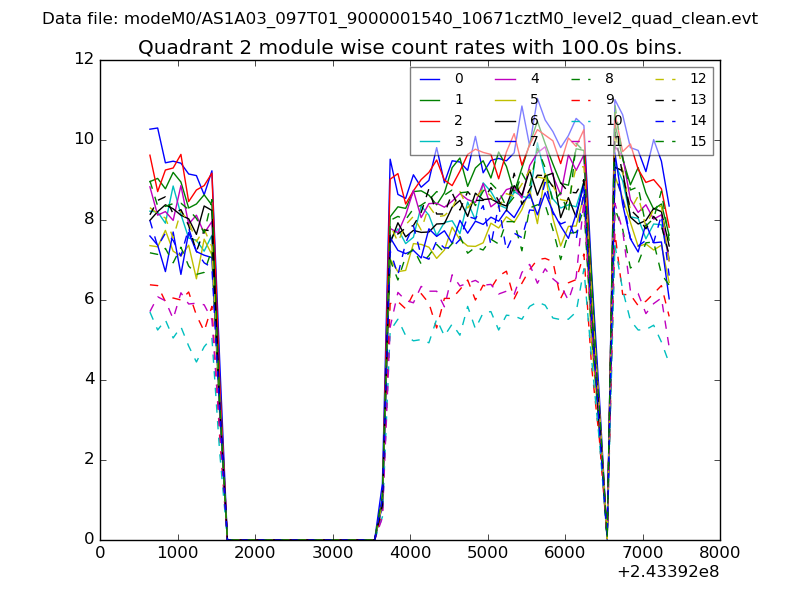
| Module-wise count rates for Quadrant B Data is divided into 100 sec bins |
 |
 |
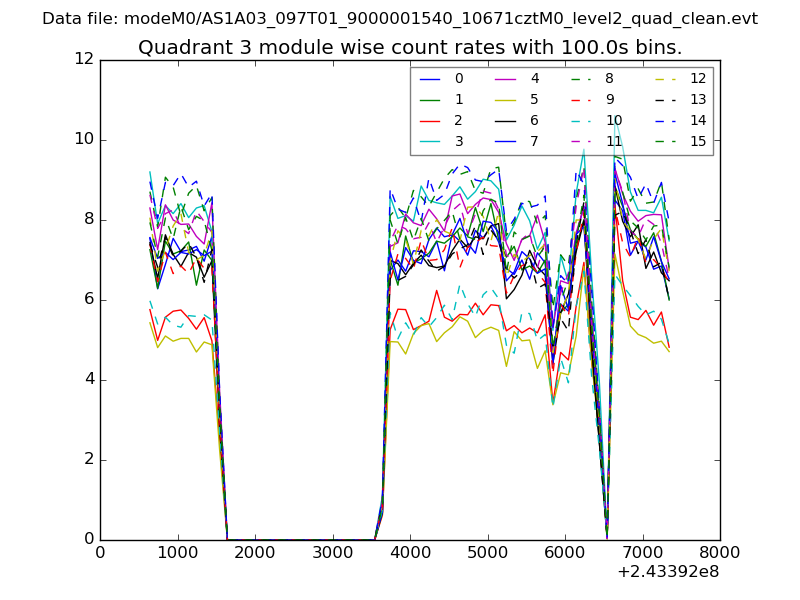
| Module-wise count rates for Quadrant C Data is divided into 100 sec bins |
 |
 |
| Module-wise count rates for Quadrant D Data is divided into 100 sec bins |
 |
 |
| Parameter | Plot |
|---|---|
| CZT HV Monitor | 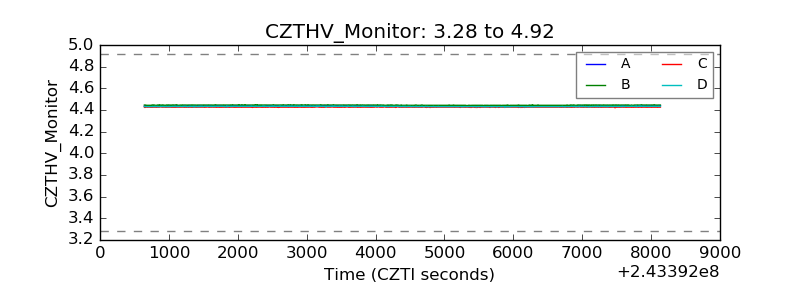 |
| D_VDD | 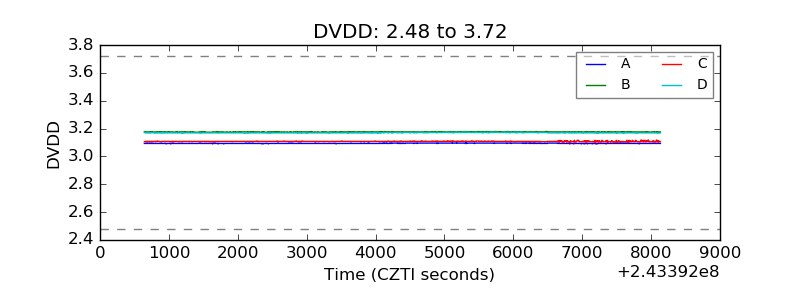 |
| Temperature 1 | 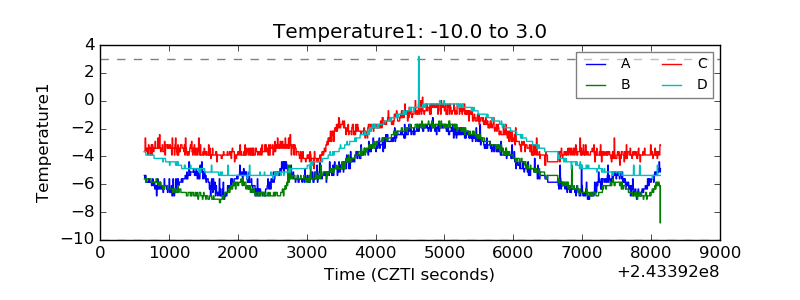 |
| Veto HV Monitor | 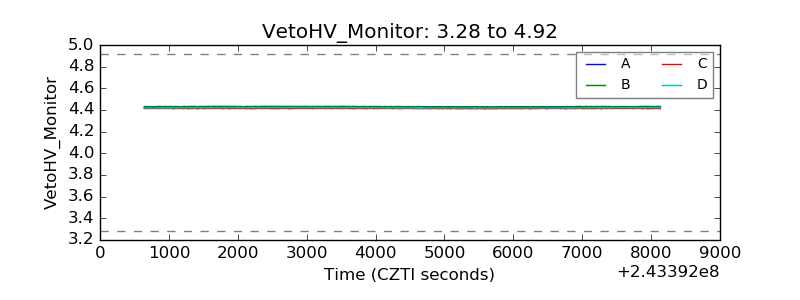 |
| Veto LLD | 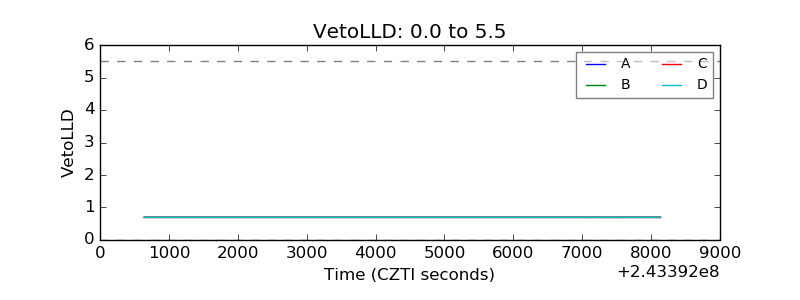 |
| Alpha Counter | 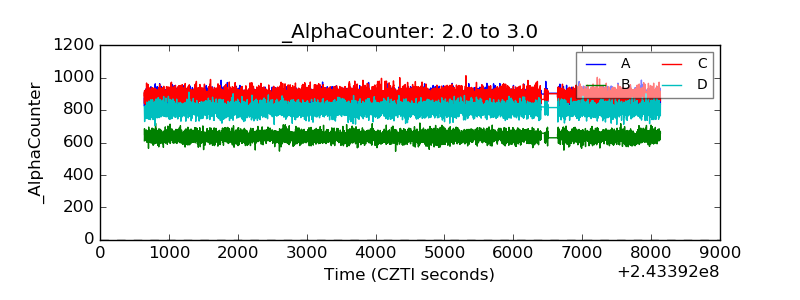 |
| _CPM_Rate | 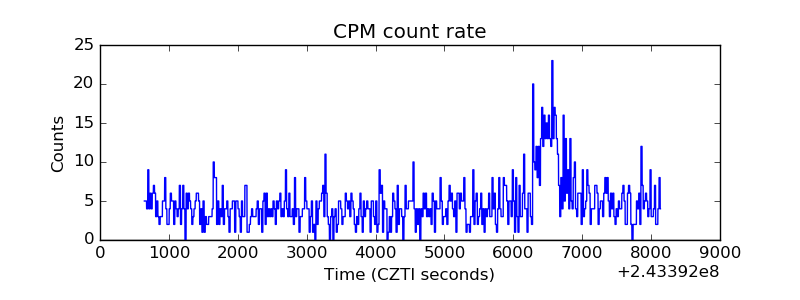 |
| CZT Counter | 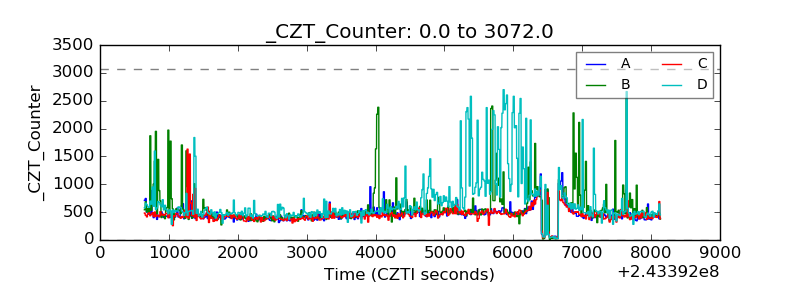 |
| +2.5 Volts monitor |  |
| +5 Volts monitor | 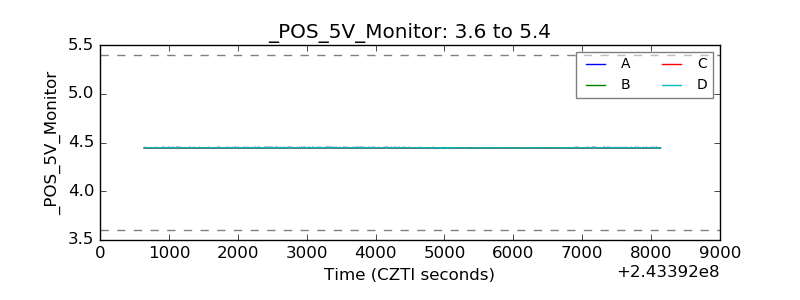 |
| _ROLL_ROT | 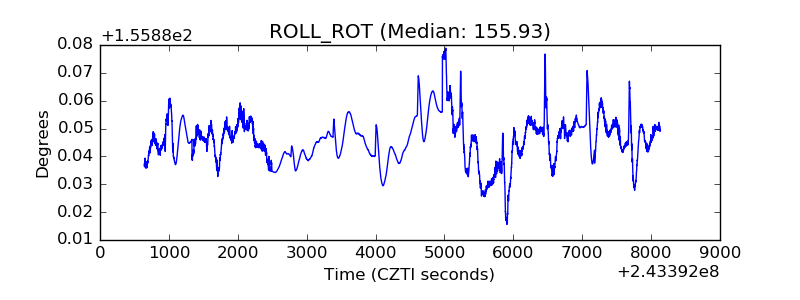 |
| _Roll_DEC | 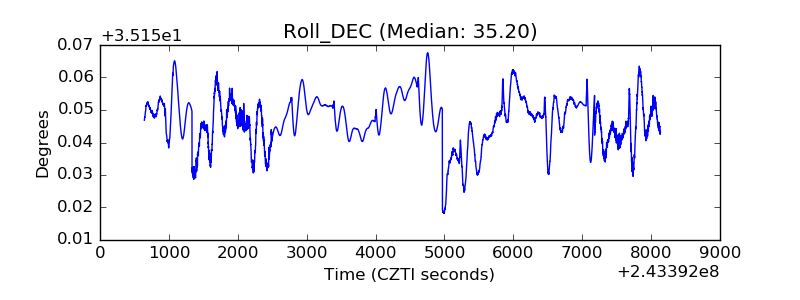 |
| _Roll_RA | 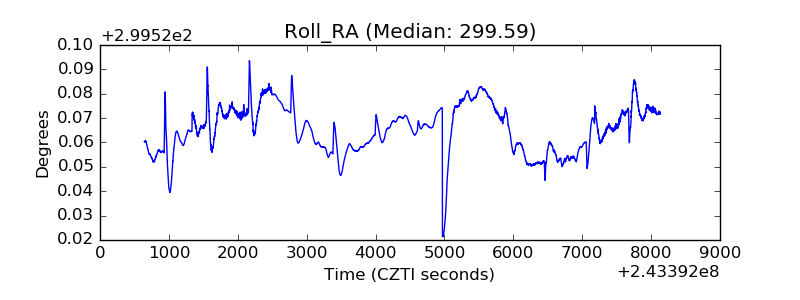 |
| Veto Counter | 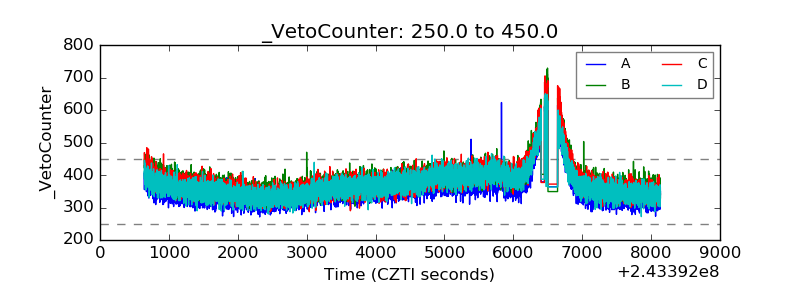 |