| Param | Original file | Final file |
|---|---|---|
| Filename | modeM0/AS1A03_097T01_9000001540_10672cztM0_level2.evt | modeM0/AS1A03_097T01_9000001540_10672cztM0_level2_quad_clean.evt |
| Size (bytes) | 603,982,080 | 88,712,640 |
| Size | 576.0 MB | 84.6 MB |
| Events in quadrant A | 4,657,050 | 526,744 |
| Events in quadrant B | 4,787,008 | 546,419 |
| Events in quadrant C | 3,558,606 | 556,101 |
| Events in quadrant D | 4,769,484 | 523,777 |
| Mode M0 | |||
|---|---|---|---|
| Quadrant | BADHDUFLAG | Total packets | Discarded packets |
| A | 0 | 19062 | 1 |
| B | 0 | 19337 | 0 |
| C | 0 | 15968 | 0 |
| D | 0 | 18978 | 0 |
| Mode SS | |||
|---|---|---|---|
| Quadrant | BADHDUFLAG | Total packets | Discarded packets |
| A | 0 | 154 | 0 |
| B | 0 | 154 | 0 |
| C | 0 | 154 | 0 |
| D | 0 | 154 | 0 |
| Quadrant | Total seconds | Saturated seconds | Saturation percentage |
|---|---|---|---|
| A | 7658 | 572 | 7.469313% |
| B | 7658 | 428 | 5.588927% |
| C | 7658 | 96 | 1.253591% |
| D | 7658 | 154 | 2.010969% |
Noise dominated data is calculated using 1-second bins in cleaned event files. If a bin has >2000 counts, and if more than 50% of those come from <1% of pixels, then it is considered to be noise-dominated and hence unusable.
| Quadrant | # 1 sec bins | Bins with >0 counts | Bins with >2000 counts | High rate bins dominated by noise | Noise dominated (total time) | Noise dominated (detector-on time) | Marked lightcurve |
|---|---|---|---|---|---|---|---|
| A | 7658 | 7658 | 396 | 396 | 5.17% | 5.17% | 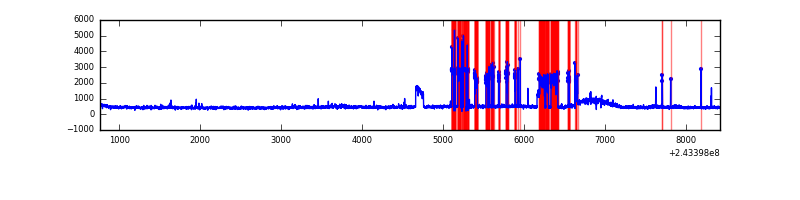 |
| B | 7658 | 7658 | 133 | 133 | 1.74% | 1.74% | 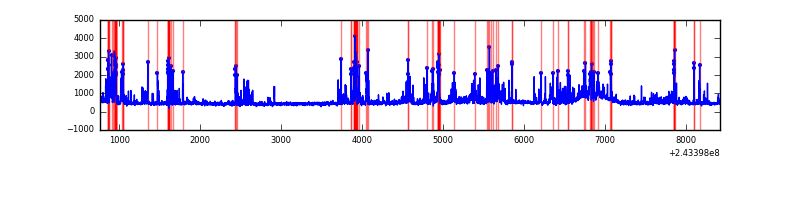 |
| C | 7658 | 7658 | 9 | 9 | 0.12% | 0.12% | 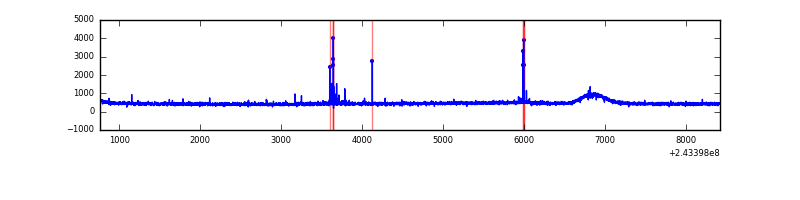 |
| D | 7658 | 7658 | 41 | 41 | 0.54% | 0.54% | 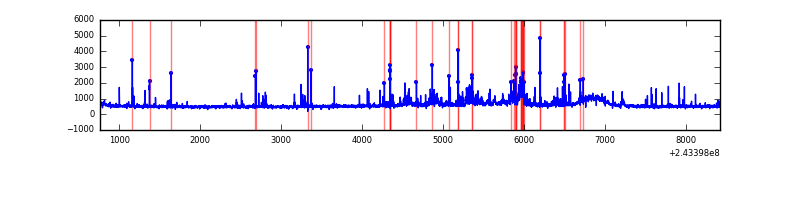 |
Top three noisy pixels from each quadrant. If the there are fewer than three noisy pixels in the level2.evt file, extra rows are filled as -1
| Pixel properties | Quadrant properties | ||||||
|---|---|---|---|---|---|---|---|
| Quadrant | DetID | PixID | Counts | Sigma | Mean | Median | Sigma |
| A | 15 | 239 | 1154561 | 6355.55 | 885 | 865 | 181.5 |
| A | 3 | 1 | 35749 | 192.17 | 885 | 865 | 181.5 |
| A | 1 | 162 | 31488 | 168.7 | 885 | 865 | 181.5 |
| B | 4 | 239 | 1071517 | 6190.36 | 897 | 875 | 173.0 |
| B | 4 | 81 | 63782 | 363.72 | 897 | 875 | 173.0 |
| B | 0 | 214 | 50451 | 286.64 | 897 | 875 | 173.0 |
| C | 14 | 234 | 49124 | 231.99 | 889 | 893 | 207.9 |
| C | 8 | 128 | 13541 | 60.84 | 889 | 893 | 207.9 |
| C | 4 | 175 | 10428 | 45.86 | 889 | 893 | 207.9 |
| D | 8 | 195 | 767820 | 3617.46 | 879 | 855 | 212.0 |
| D | 10 | 199 | 359731 | 1692.67 | 879 | 855 | 212.0 |
| D | 13 | 249 | 66033 | 307.42 | 879 | 855 | 212.0 |
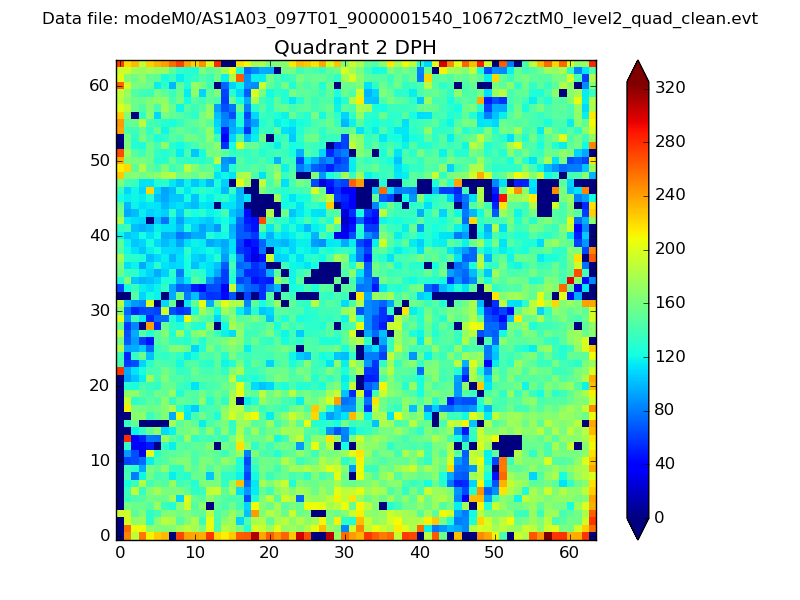
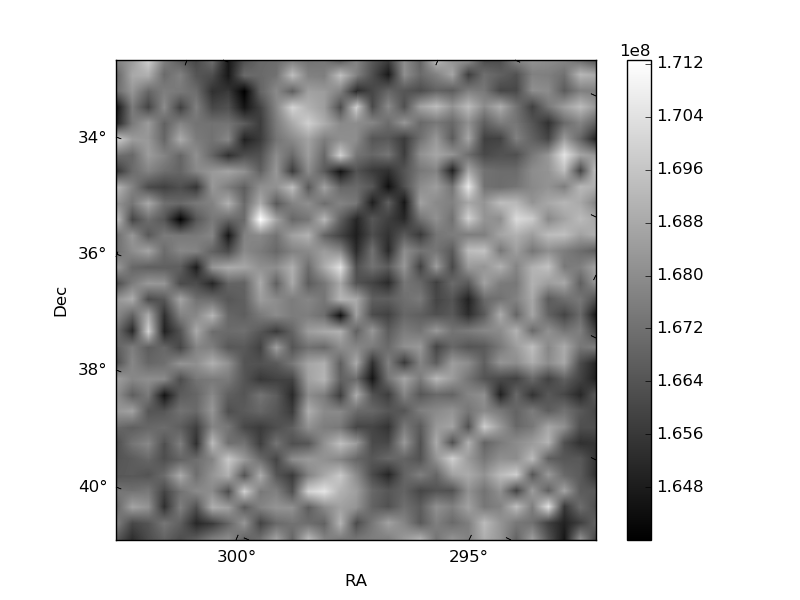
Histogram calculated using DETX and DETY for each event in the final _common_clean file
| Quadrant A | 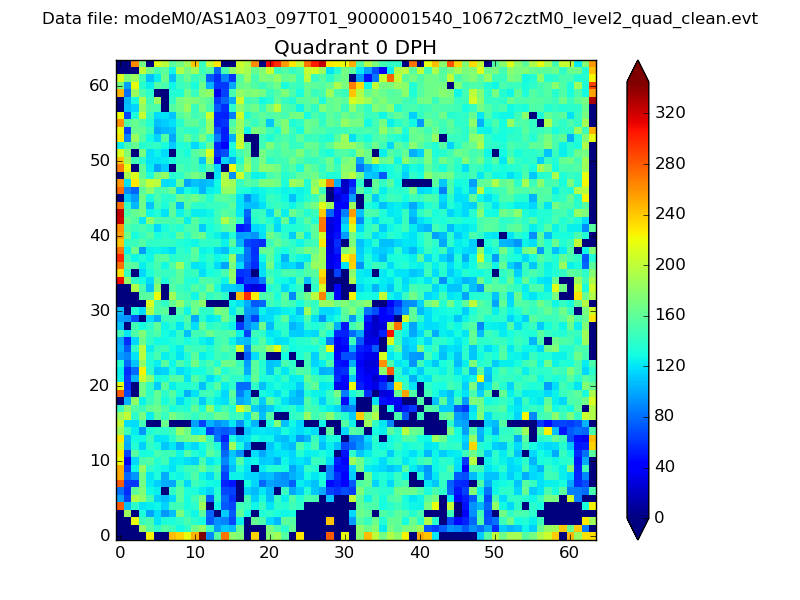 |
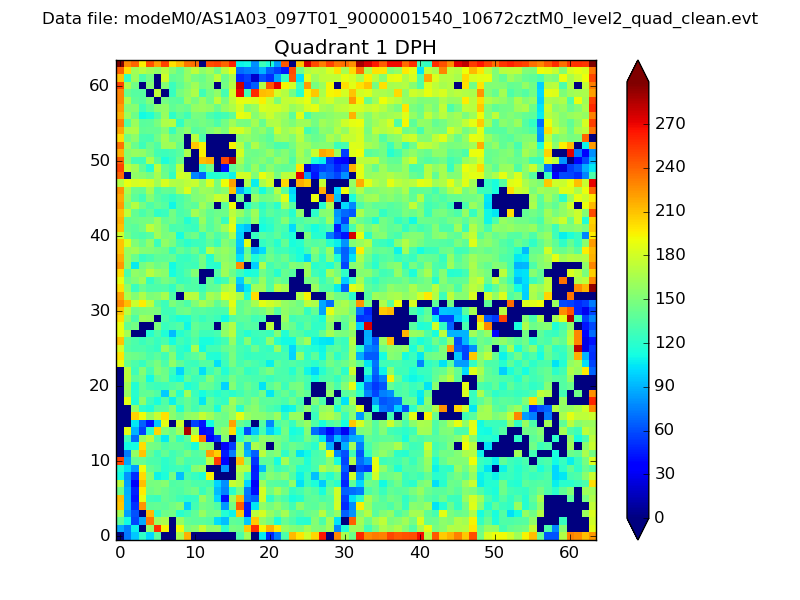 |
Quadrant B |
|---|---|---|---|
| Quadrant D | 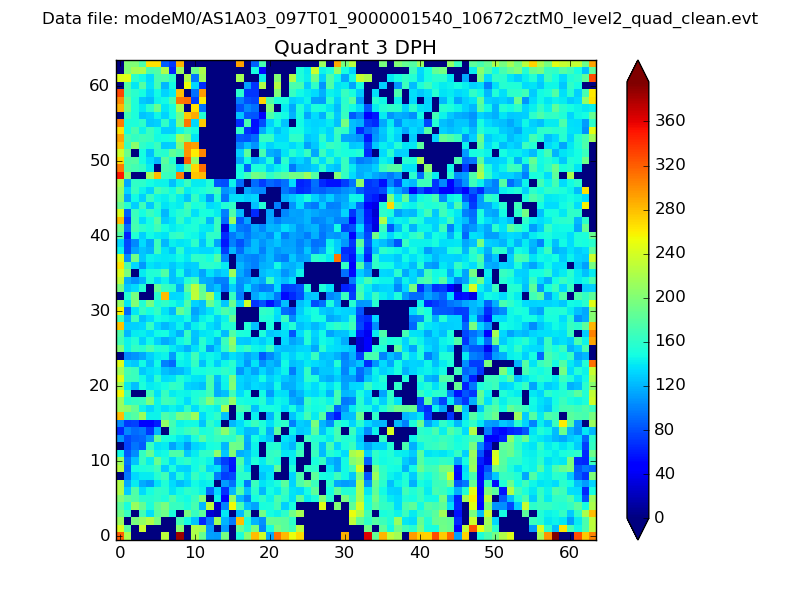 |
 |
Quadrant C |
| Plot type | Count rate plots | Images |
|---|---|---|
| Comparison with Poisson distribution Blue bars denote a histogram of data divided into 1 sec bins. Red curve is a Poisson curve with rate = median count rate of data. |
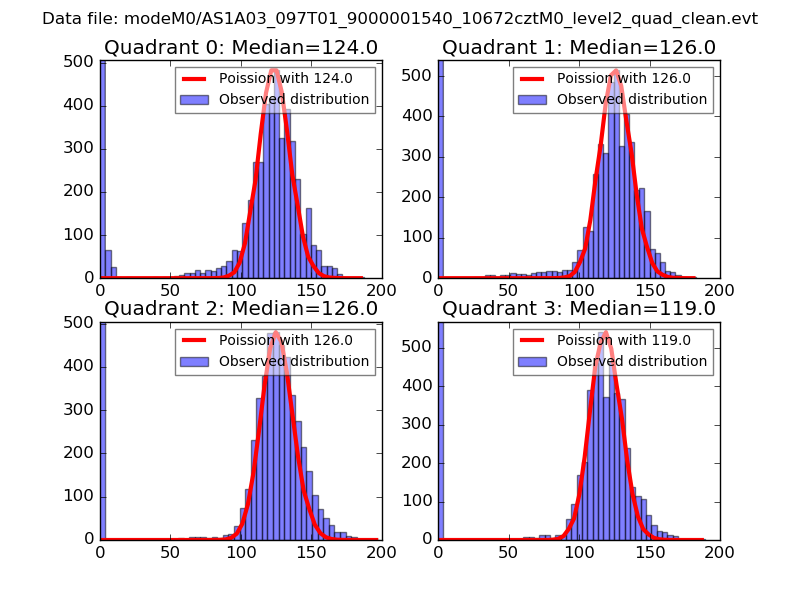 |
 |
| Quadrant-wise count rates Data is divided into 100 sec bins |
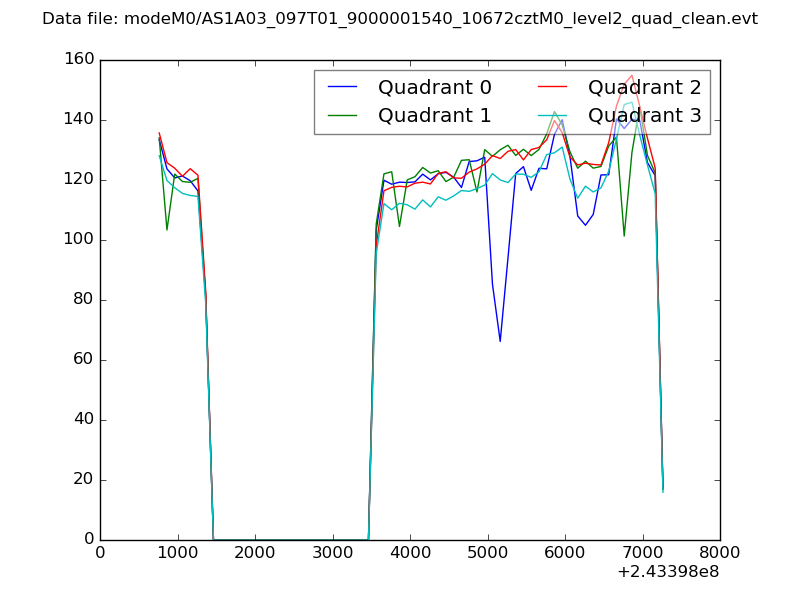 |
|
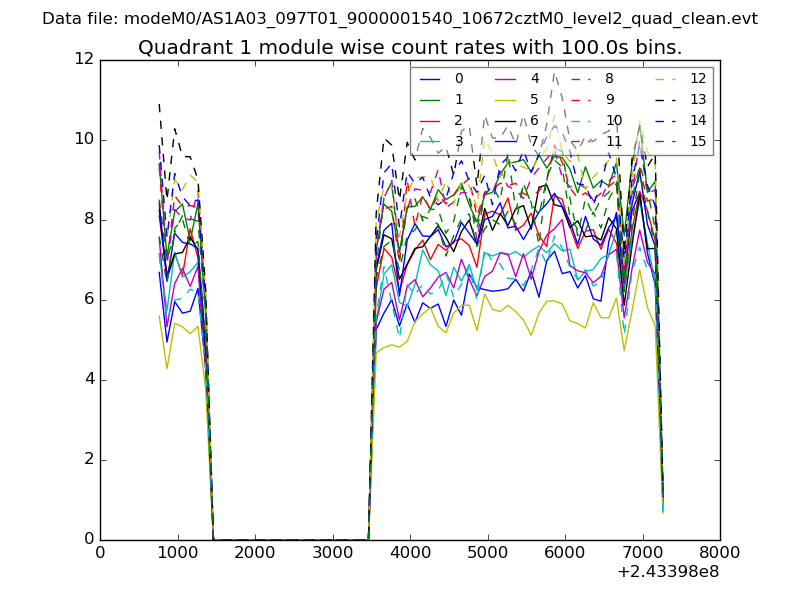
| Module-wise count rates for Quadrant A Data is divided into 100 sec bins |
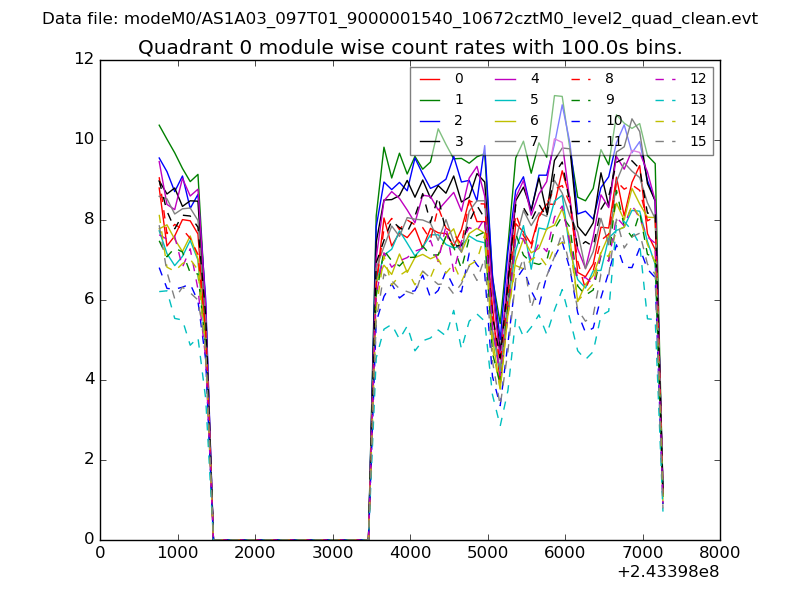 |
 |
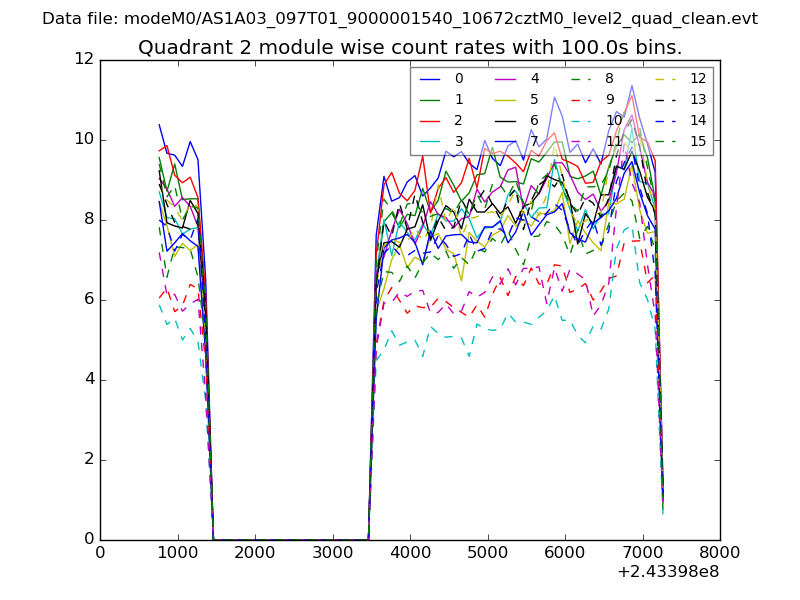
| Module-wise count rates for Quadrant B Data is divided into 100 sec bins |
 |
 |
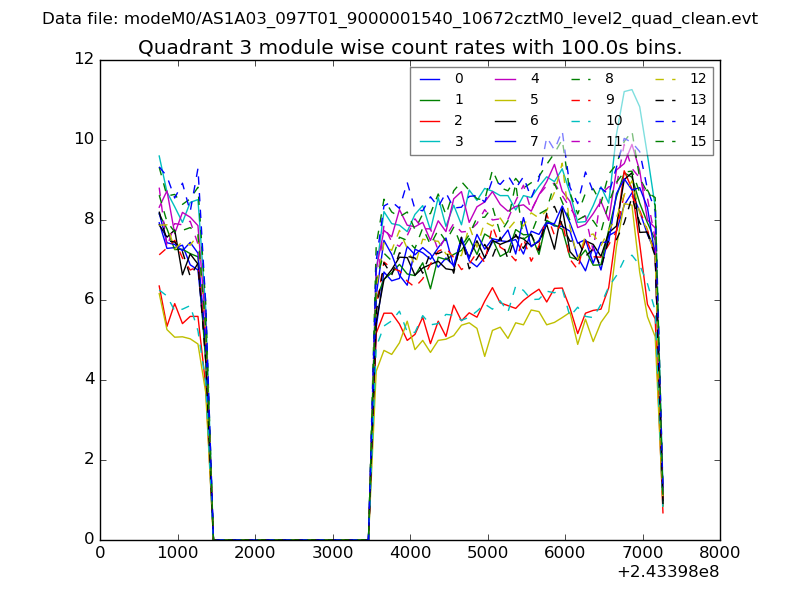
| Module-wise count rates for Quadrant C Data is divided into 100 sec bins |
 |
 |
| Module-wise count rates for Quadrant D Data is divided into 100 sec bins |
 |
 |
| Parameter | Plot |
|---|---|
| CZT HV Monitor | 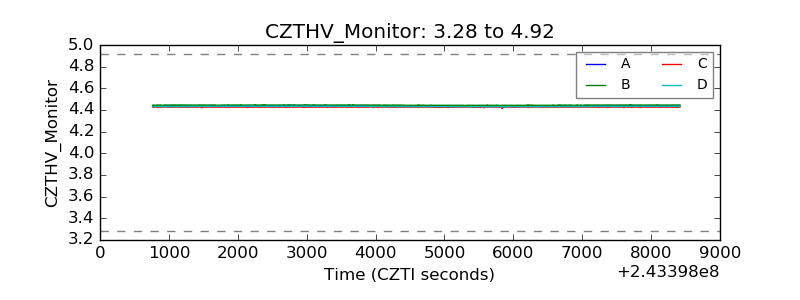 |
| D_VDD | 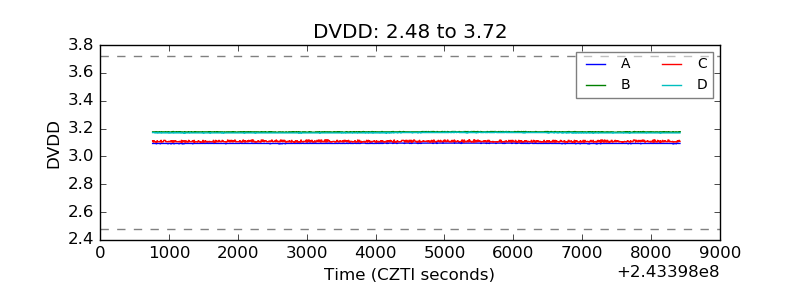 |
| Temperature 1 | 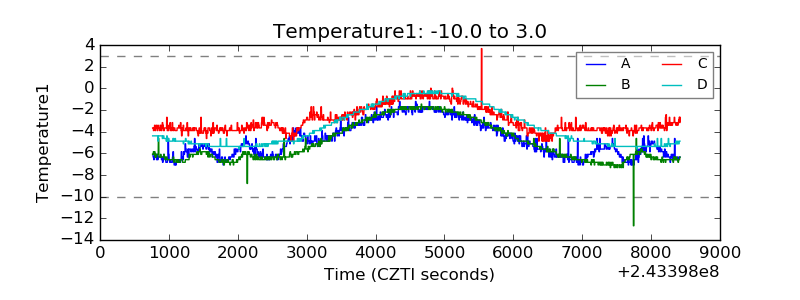 |
| Veto HV Monitor | 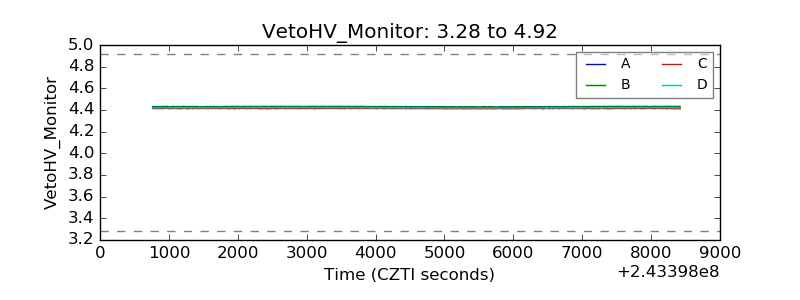 |
| Veto LLD | 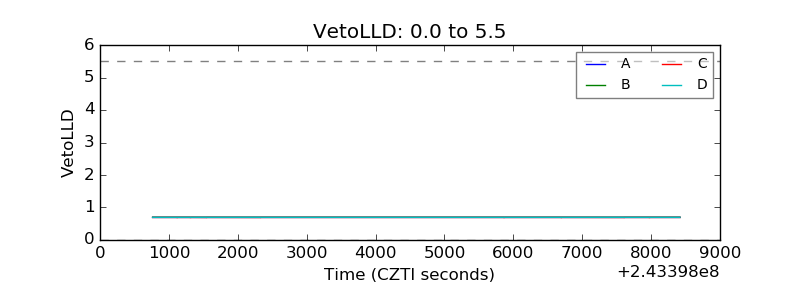 |
| Alpha Counter | 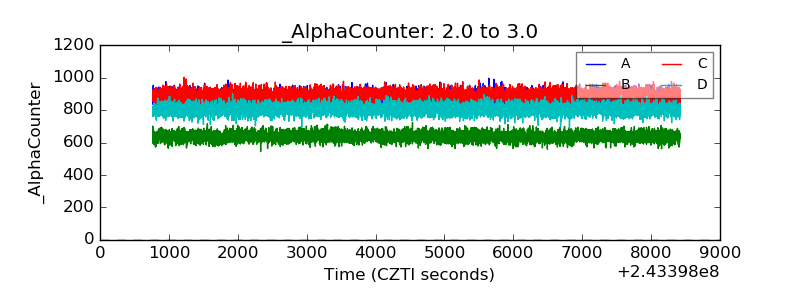 |
| _CPM_Rate | 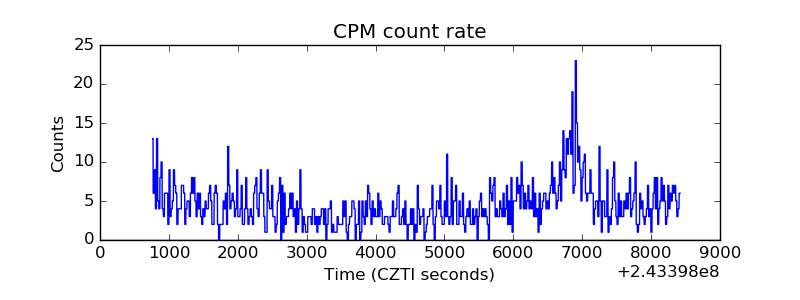 |
| CZT Counter |  |
| +2.5 Volts monitor |  |
| +5 Volts monitor |  |
| _ROLL_ROT | 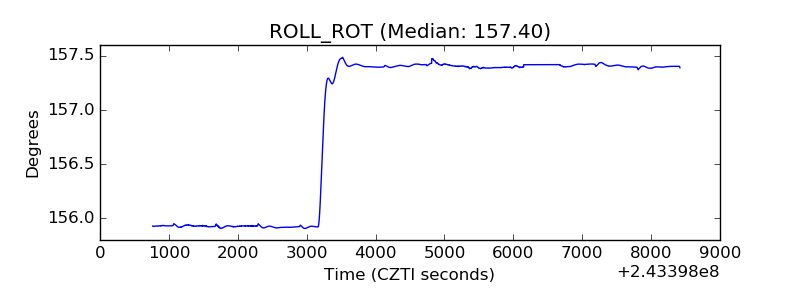 |
| _Roll_DEC | 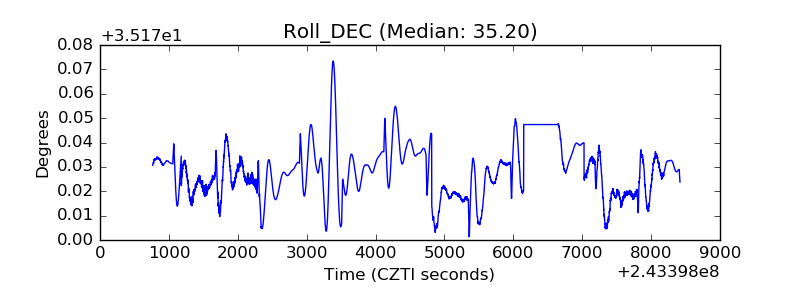 |
| _Roll_RA | 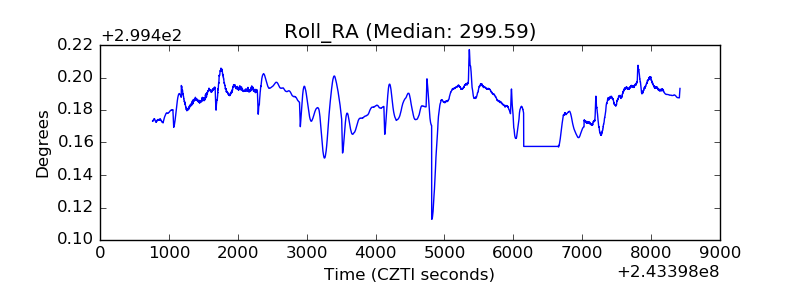 |
| Veto Counter | 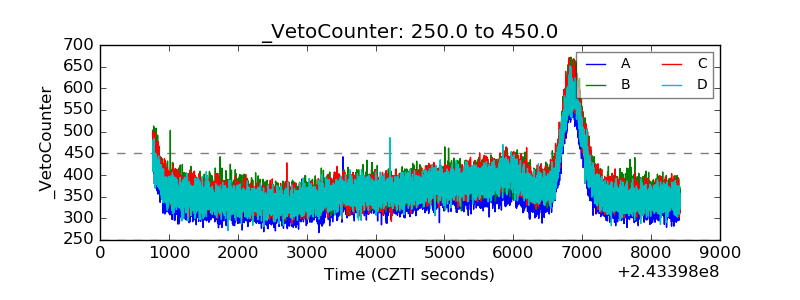 |