| Param | Original file | Final file |
|---|---|---|
| Filename | modeM0/AS1A03_097T01_9000001540_10673cztM0_level2.evt | modeM0/AS1A03_097T01_9000001540_10673cztM0_level2_quad_clean.evt |
| Size (bytes) | 663,886,080 | 86,391,360 |
| Size | 633.1 MB | 82.4 MB |
| Events in quadrant A | 4,046,467 | 533,346 |
| Events in quadrant B | 5,409,682 | 524,250 |
| Events in quadrant C | 3,721,879 | 541,181 |
| Events in quadrant D | 6,390,545 | 465,175 |
| Mode M9 | |||
|---|---|---|---|
| Quadrant | BADHDUFLAG | Total packets | Discarded packets |
| A | 0 | 2 | 0 |
| B | 0 | 2 | 0 |
| C | 0 | 2 | 0 |
| D | 0 | 2 | 0 |
| Mode M0 | |||
|---|---|---|---|
| Quadrant | BADHDUFLAG | Total packets | Discarded packets |
| A | 0 | 17293 | 2 |
| B | 0 | 21227 | 1 |
| C | 0 | 16628 | 1 |
| D | 0 | 23941 | 1 |
| Mode SS | |||
|---|---|---|---|
| Quadrant | BADHDUFLAG | Total packets | Discarded packets |
| A | 0 | 162 | 0 |
| B | 0 | 162 | 0 |
| C | 0 | 162 | 0 |
| D | 0 | 162 | 0 |
| Quadrant | Total seconds | Saturated seconds | Saturation percentage |
|---|---|---|---|
| A | 7922 | 319 | 4.026761% |
| B | 7922 | 678 | 8.558445% |
| C | 7922 | 157 | 1.981823% |
| D | 7922 | 928 | 11.714214% |
Noise dominated data is calculated using 1-second bins in cleaned event files. If a bin has >2000 counts, and if more than 50% of those come from <1% of pixels, then it is considered to be noise-dominated and hence unusable.
| Quadrant | # 1 sec bins | Bins with >0 counts | Bins with >2000 counts | High rate bins dominated by noise | Noise dominated (total time) | Noise dominated (detector-on time) | Marked lightcurve |
|---|---|---|---|---|---|---|---|
| A | 8187 | 7923 | 37 | 37 | 0.45% | 0.47% | 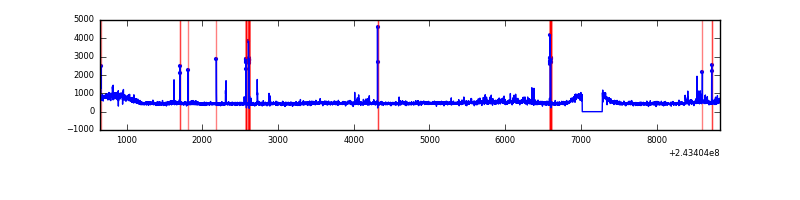 |
| B | 8187 | 7923 | 199 | 199 | 2.43% | 2.51% | 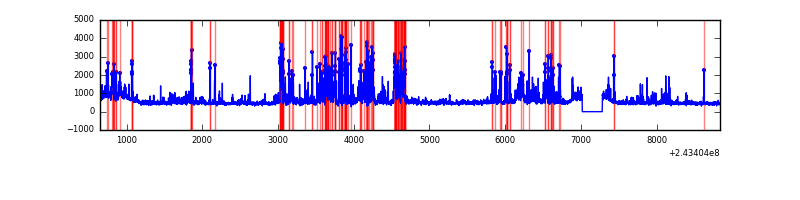 |
| C | 8187 | 7923 | 3 | 3 | 0.04% | 0.04% | 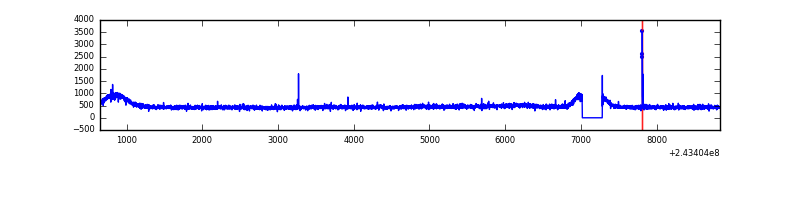 |
| D | 8186 | 7922 | 690 | 690 | 8.43% | 8.71% | 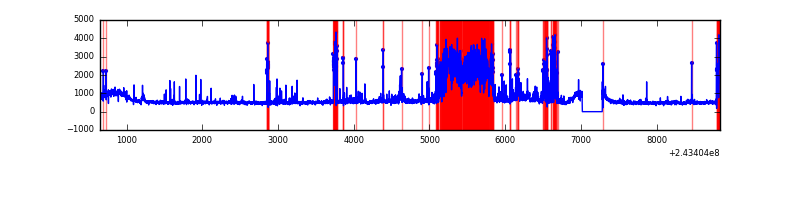 |
Top three noisy pixels from each quadrant. If the there are fewer than three noisy pixels in the level2.evt file, extra rows are filled as -1
| Pixel properties | Quadrant properties | ||||||
|---|---|---|---|---|---|---|---|
| Quadrant | DetID | PixID | Counts | Sigma | Mean | Median | Sigma |
| A | 15 | 239 | 292793 | 1475.98 | 956 | 933 | 197.7 |
| A | 1 | 162 | 32359 | 158.93 | 956 | 933 | 197.7 |
| A | 3 | 1 | 23884 | 116.07 | 956 | 933 | 197.7 |
| B | 4 | 239 | 847723 | 4604.36 | 943 | 917 | 183.9 |
| B | 0 | 85 | 471386 | 2558.09 | 943 | 917 | 183.9 |
| B | 4 | 81 | 257780 | 1396.65 | 943 | 917 | 183.9 |
| C | 14 | 234 | 18136 | 77.96 | 939 | 942 | 220.6 |
| C | 4 | 175 | 13426 | 56.6 | 939 | 942 | 220.6 |
| C | 8 | 128 | 10256 | 42.23 | 939 | 942 | 220.6 |
| D | 10 | 199 | 1485459 | 6859.86 | 889 | 861 | 216.4 |
| D | 8 | 195 | 580020 | 2676.11 | 889 | 861 | 216.4 |
| D | 12 | 233 | 364708 | 1681.22 | 889 | 861 | 216.4 |
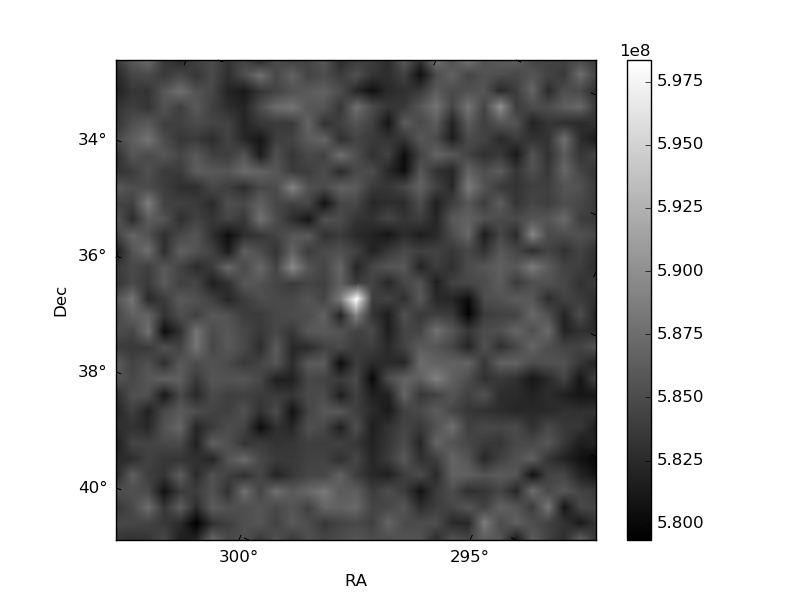
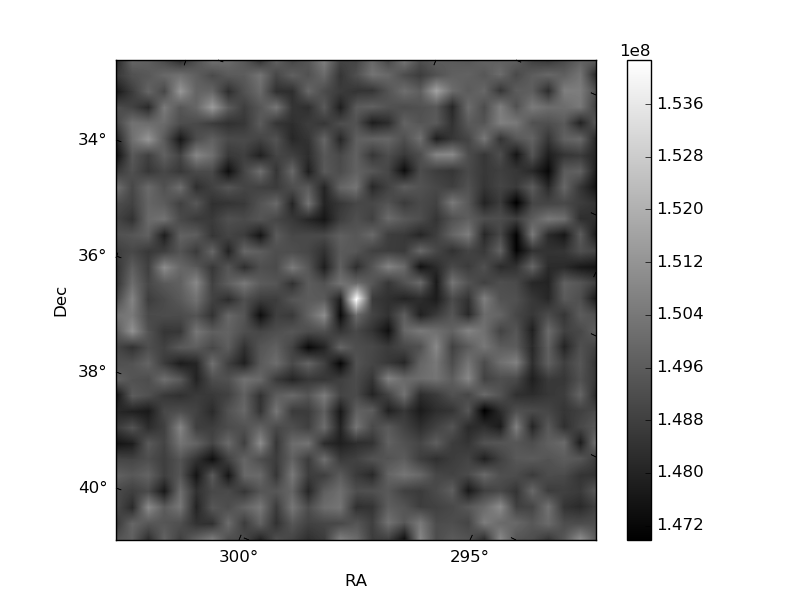
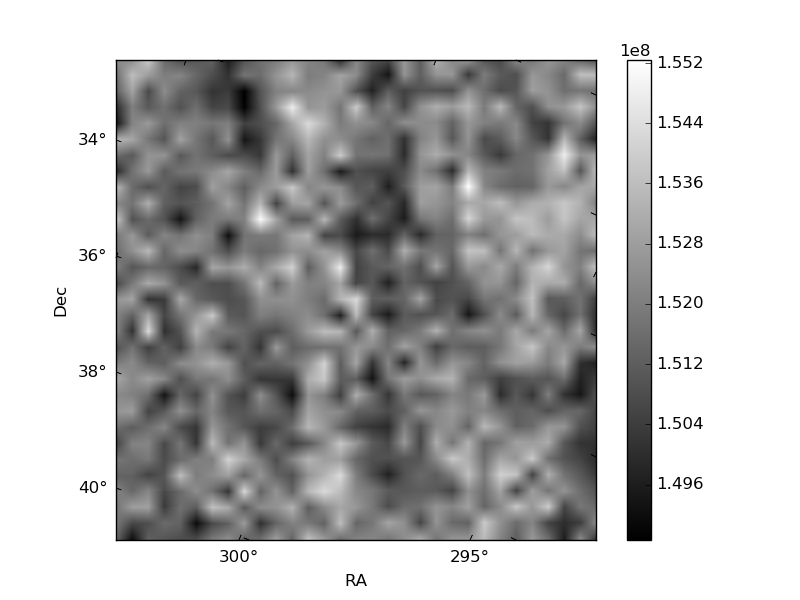
Histogram calculated using DETX and DETY for each event in the final _common_clean file
| Quadrant A | 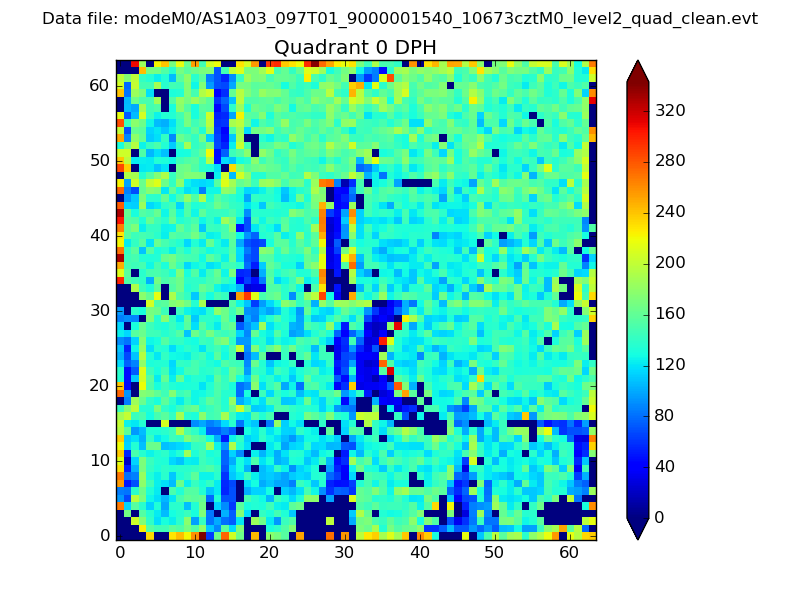 |
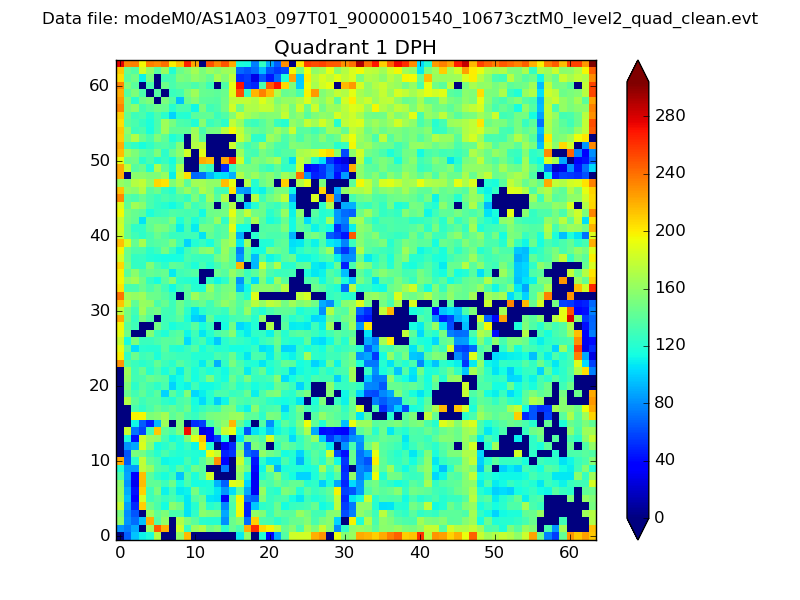 |
Quadrant B |
|---|---|---|---|
| Quadrant D |  |
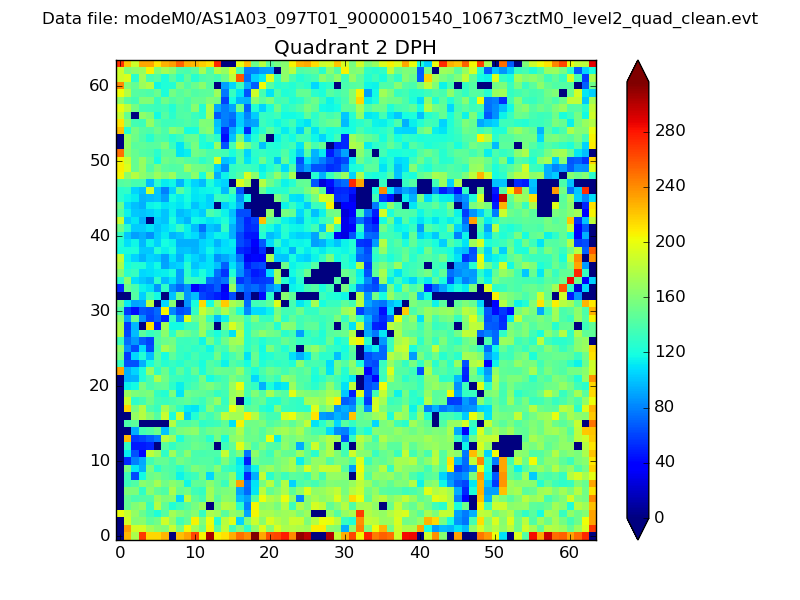 |
Quadrant C |
| Plot type | Count rate plots | Images |
|---|---|---|
| Comparison with Poisson distribution Blue bars denote a histogram of data divided into 1 sec bins. Red curve is a Poisson curve with rate = median count rate of data. |
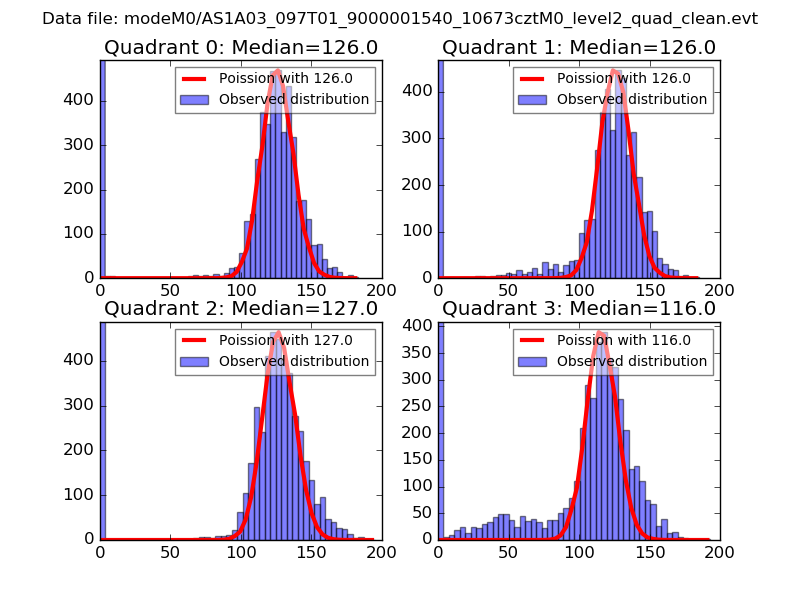 |
 |
| Quadrant-wise count rates Data is divided into 100 sec bins |
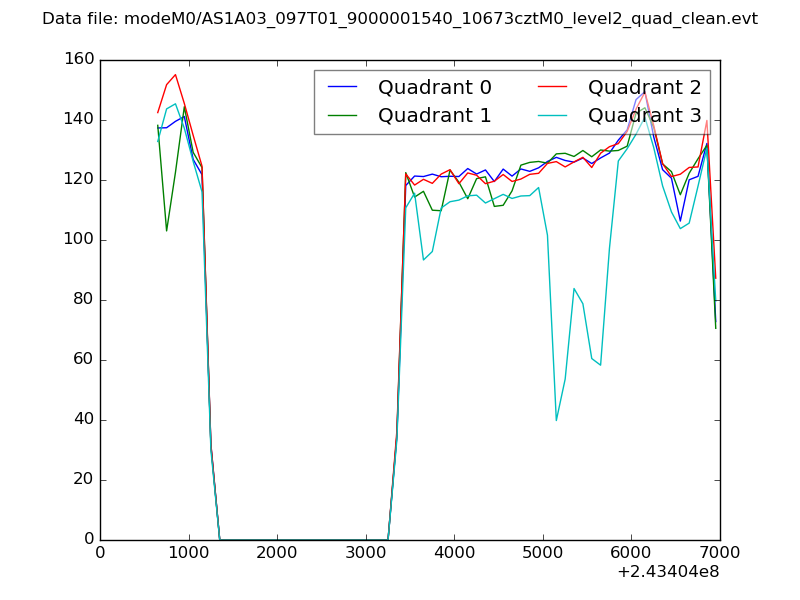 |
|
| Module-wise count rates for Quadrant A Data is divided into 100 sec bins |
 |
 |
| Module-wise count rates for Quadrant B Data is divided into 100 sec bins |
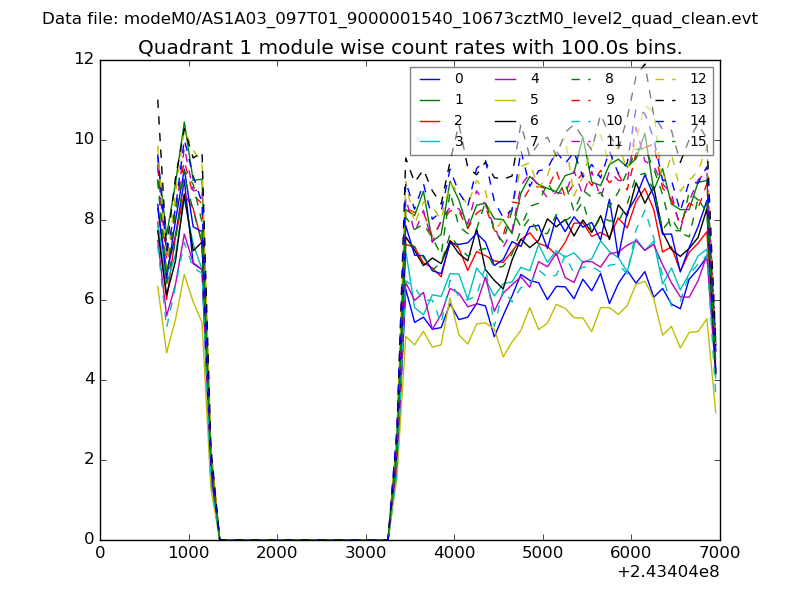 |
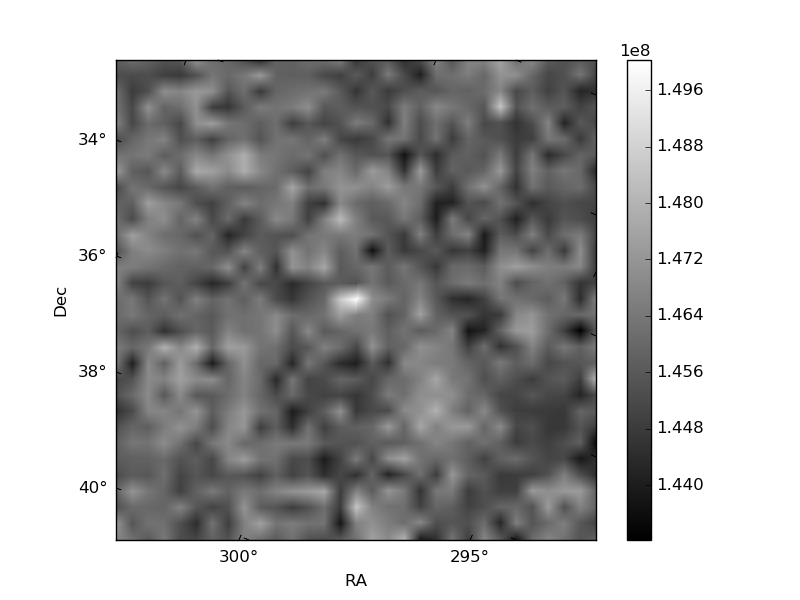 |
| Module-wise count rates for Quadrant C Data is divided into 100 sec bins |
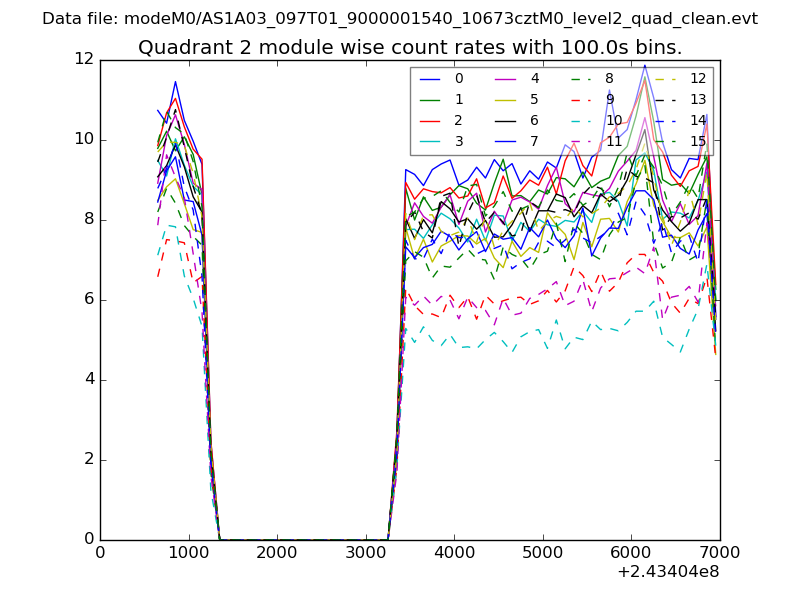 |
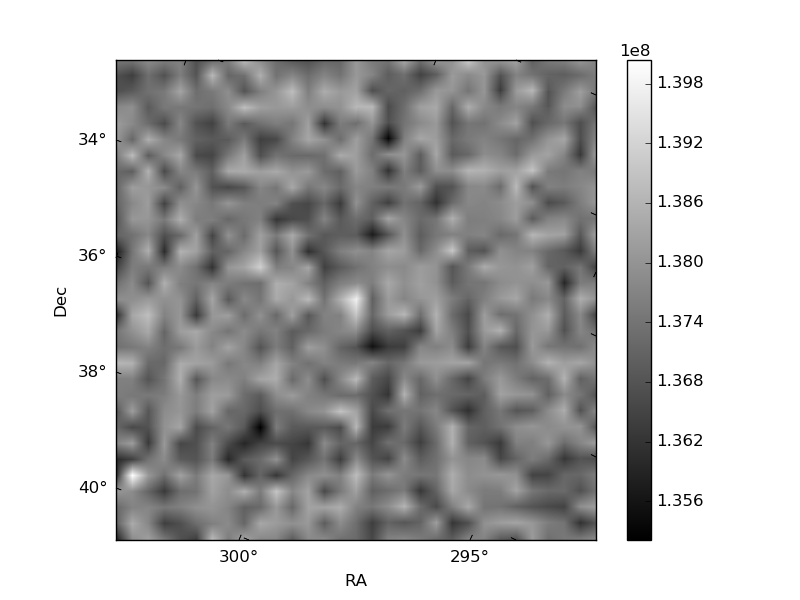 |
| Module-wise count rates for Quadrant D Data is divided into 100 sec bins |
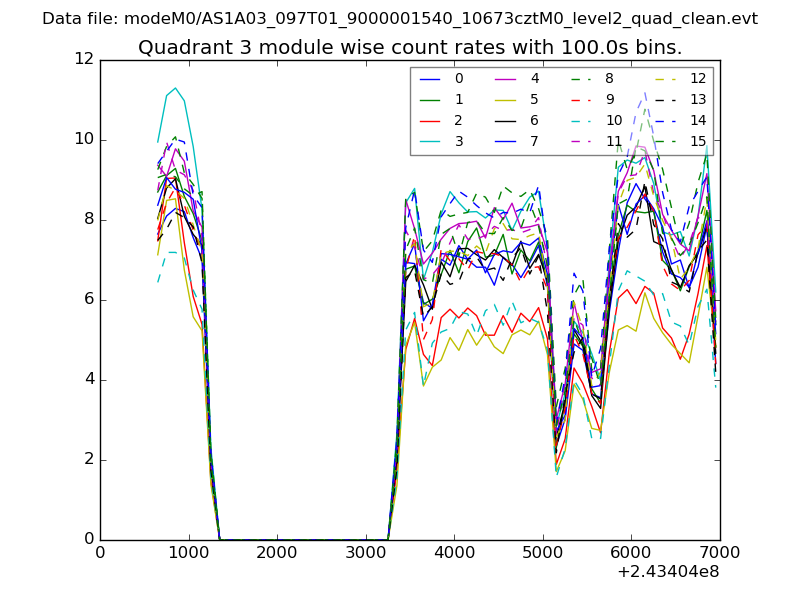 |
 |
| Parameter | Plot |
|---|---|
| CZT HV Monitor |  |
| D_VDD | 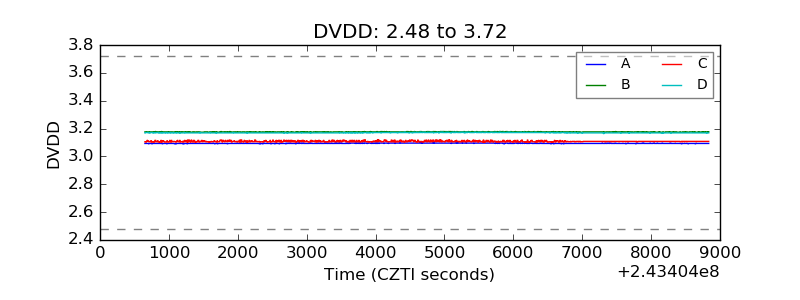 |
| Temperature 1 | 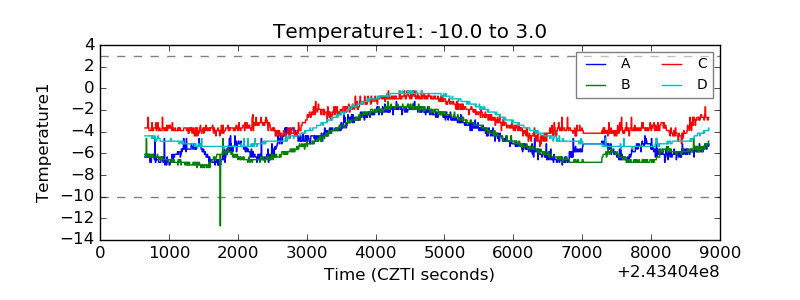 |
| Veto HV Monitor | 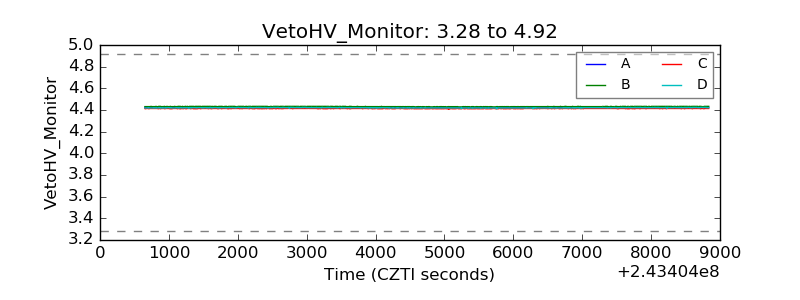 |
| Veto LLD | 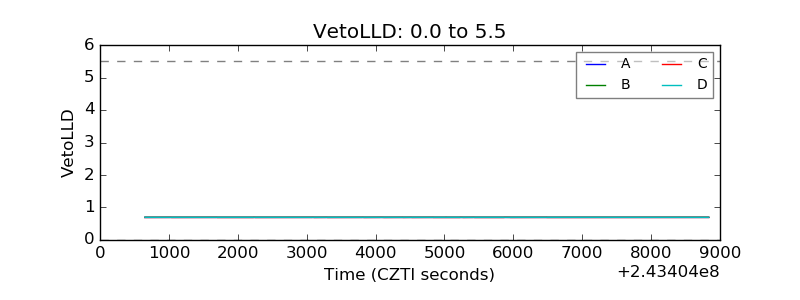 |
| Alpha Counter | 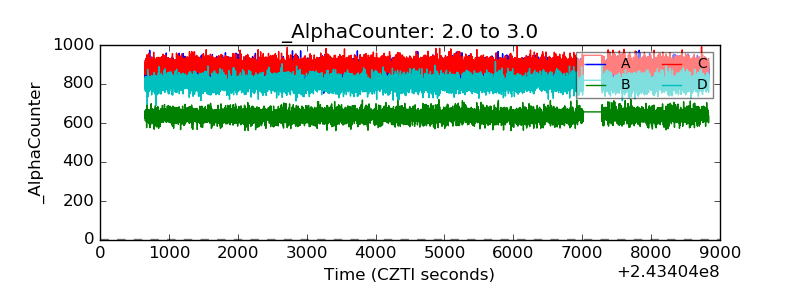 |
| _CPM_Rate | 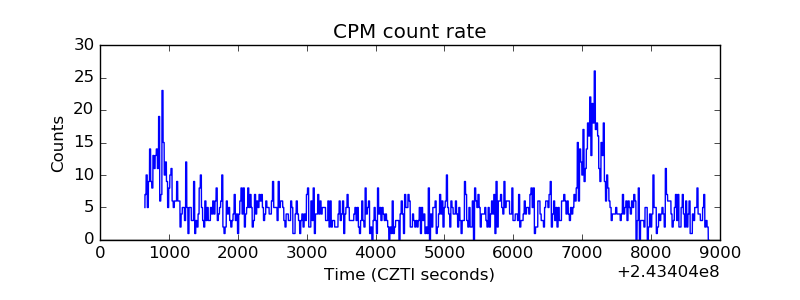 |
| CZT Counter | 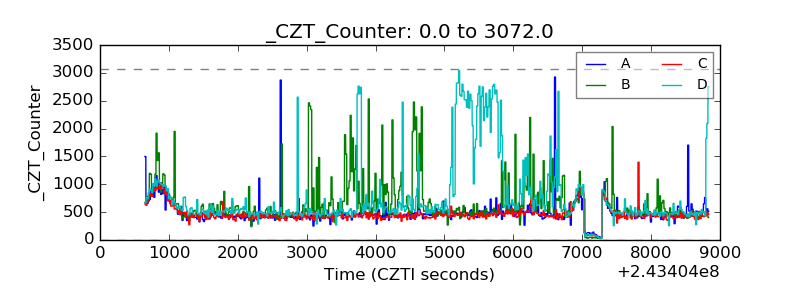 |
| +2.5 Volts monitor |  |
| +5 Volts monitor | 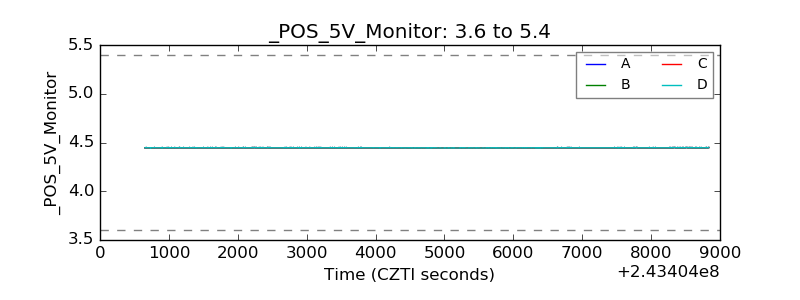 |
| _ROLL_ROT | 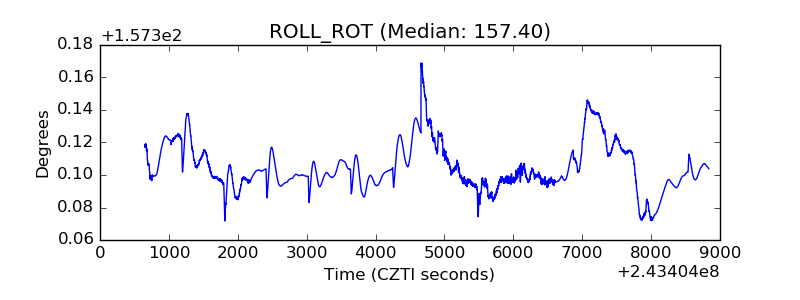 |
| _Roll_DEC | 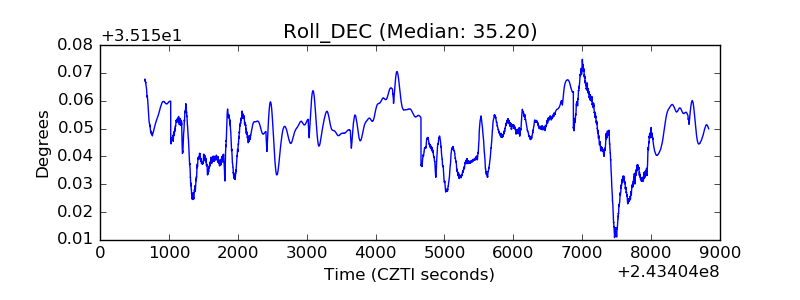 |
| _Roll_RA | 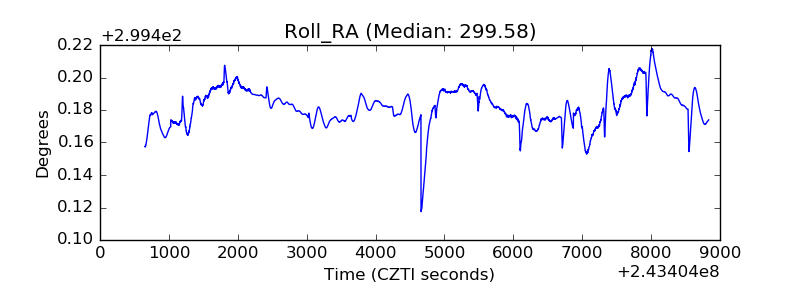 |
| Veto Counter | 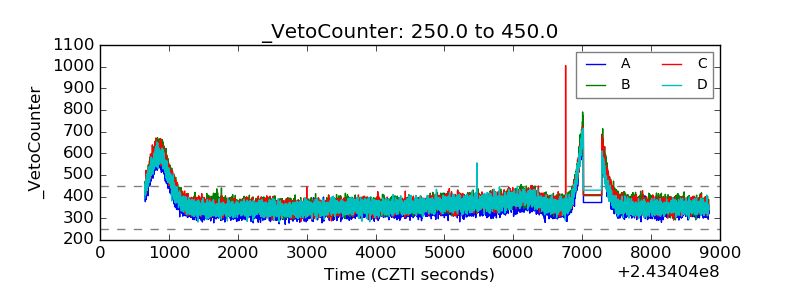 |