| Param | Original file | Final file |
|---|---|---|
| Filename | modeM0/AS1A03_097T01_9000001540_10675cztM0_level2.evt | modeM0/AS1A03_097T01_9000001540_10675cztM0_level2_quad_clean.evt |
| Size (bytes) | 1,291,956,480 | 149,120,640 |
| Size | 1.2 GB | 142.2 MB |
| Events in quadrant A | 15,037,632 | 825,229 |
| Events in quadrant B | 8,284,817 | 947,915 |
| Events in quadrant C | 6,075,735 | 954,694 |
| Events in quadrant D | 8,844,507 | 881,813 |
| Mode M9 | |||
|---|---|---|---|
| Quadrant | BADHDUFLAG | Total packets | Discarded packets |
| A | 0 | 12 | 0 |
| B | 0 | 12 | 0 |
| C | 0 | 12 | 0 |
| D | 0 | 12 | 0 |
| Mode M0 | |||
|---|---|---|---|
| Quadrant | BADHDUFLAG | Total packets | Discarded packets |
| A | 0 | 53558 | 120 |
| B | 0 | 33276 | 30 |
| C | 0 | 27286 | 12 |
| D | 0 | 34184 | 13 |
| Mode SS | |||
|---|---|---|---|
| Quadrant | BADHDUFLAG | Total packets | Discarded packets |
| A | 0 | 264 | 0 |
| B | 0 | 264 | 0 |
| C | 0 | 264 | 0 |
| D | 0 | 264 | 2 |
| Quadrant | Total seconds | Saturated seconds | Saturation percentage |
|---|---|---|---|
| A | 13108 | 3718 | 28.364358% |
| B | 13114 | 598 | 4.560012% |
| C | 13119 | 189 | 1.440659% |
| D | 13118 | 731 | 5.572496% |
Noise dominated data is calculated using 1-second bins in cleaned event files. If a bin has >2000 counts, and if more than 50% of those come from <1% of pixels, then it is considered to be noise-dominated and hence unusable.
| Quadrant | # 1 sec bins | Bins with >0 counts | Bins with >2000 counts | High rate bins dominated by noise | Noise dominated (total time) | Noise dominated (detector-on time) | Marked lightcurve |
|---|---|---|---|---|---|---|---|
| A | 14197 | 13110 | 3264 | 3264 | 22.99% | 24.90% | 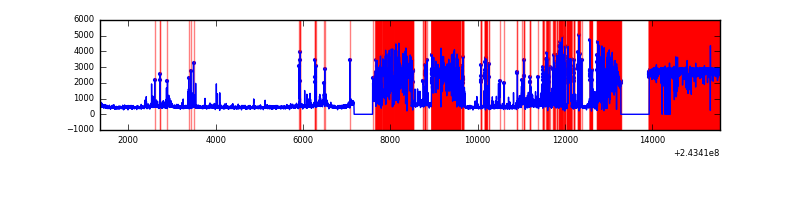 |
| B | 14198 | 13121 | 219 | 219 | 1.54% | 1.67% | 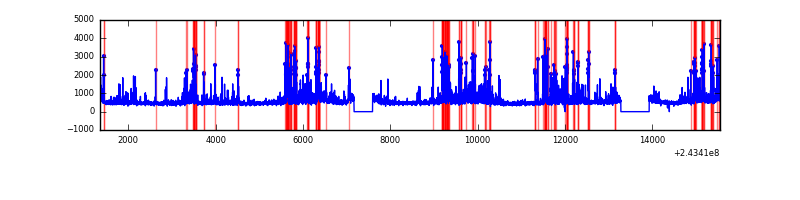 |
| C | 14198 | 13125 | 20 | 20 | 0.14% | 0.15% | 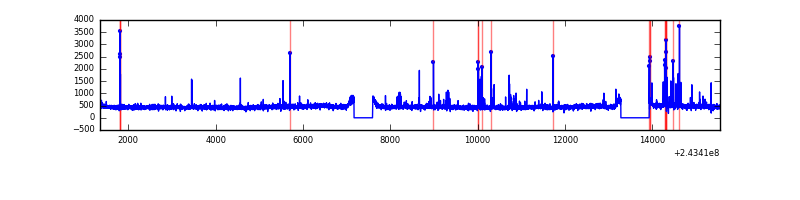 |
| D | 14198 | 13123 | 488 | 488 | 3.44% | 3.72% | 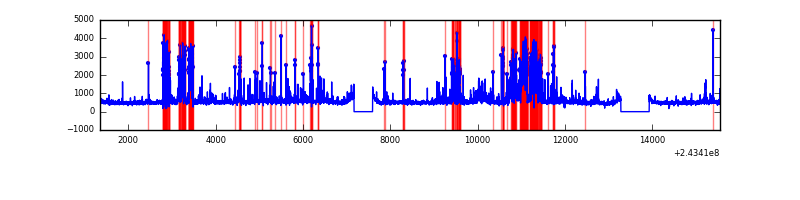 |
Top three noisy pixels from each quadrant. If the there are fewer than three noisy pixels in the level2.evt file, extra rows are filled as -1
| Pixel properties | Quadrant properties | ||||||
|---|---|---|---|---|---|---|---|
| Quadrant | DetID | PixID | Counts | Sigma | Mean | Median | Sigma |
| A | 15 | 239 | 9888103 | 39779.57 | 1229 | 1201 | 248.5 |
| A | 15 | 174 | 186729 | 746.46 | 1229 | 1201 | 248.5 |
| A | 13 | 251 | 87966 | 349.1 | 1229 | 1201 | 248.5 |
| B | 4 | 239 | 1390954 | 4790.64 | 1518 | 1478 | 290.0 |
| B | 4 | 81 | 487628 | 1676.15 | 1518 | 1478 | 290.0 |
| B | 0 | 85 | 170135 | 581.5 | 1518 | 1478 | 290.0 |
| C | 4 | 254 | 206537 | 596.54 | 1487 | 1492 | 343.7 |
| C | 14 | 234 | 36366 | 101.46 | 1487 | 1492 | 343.7 |
| C | 1 | 3 | 27579 | 75.89 | 1487 | 1492 | 343.7 |
| D | 10 | 199 | 955377 | 2737.69 | 1451 | 1411 | 348.5 |
| D | 8 | 195 | 884216 | 2533.47 | 1451 | 1411 | 348.5 |
| D | 2 | 14 | 566376 | 1621.33 | 1451 | 1411 | 348.5 |
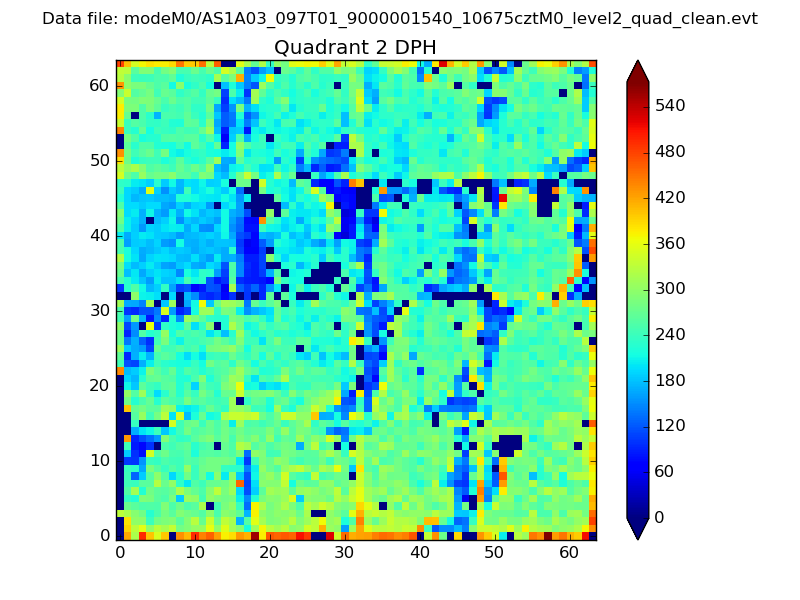
Histogram calculated using DETX and DETY for each event in the final _common_clean file
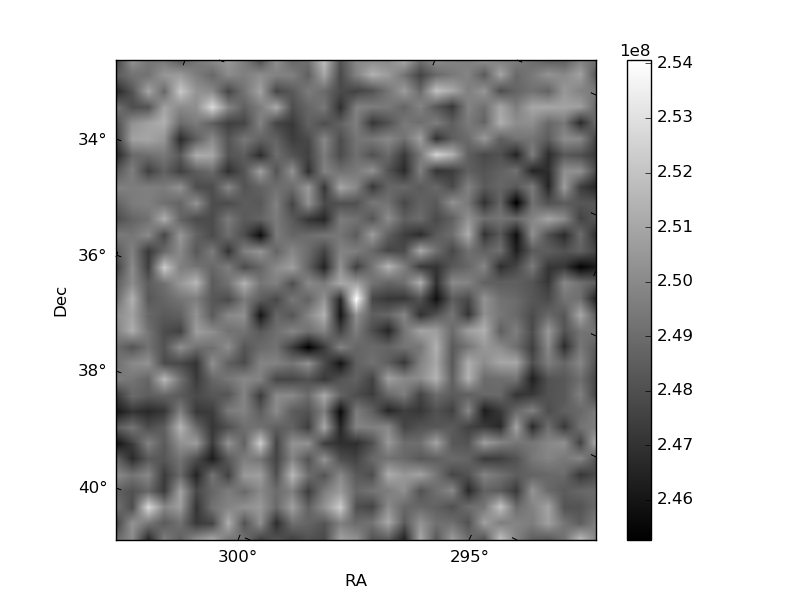
| Quadrant A |  |
 |
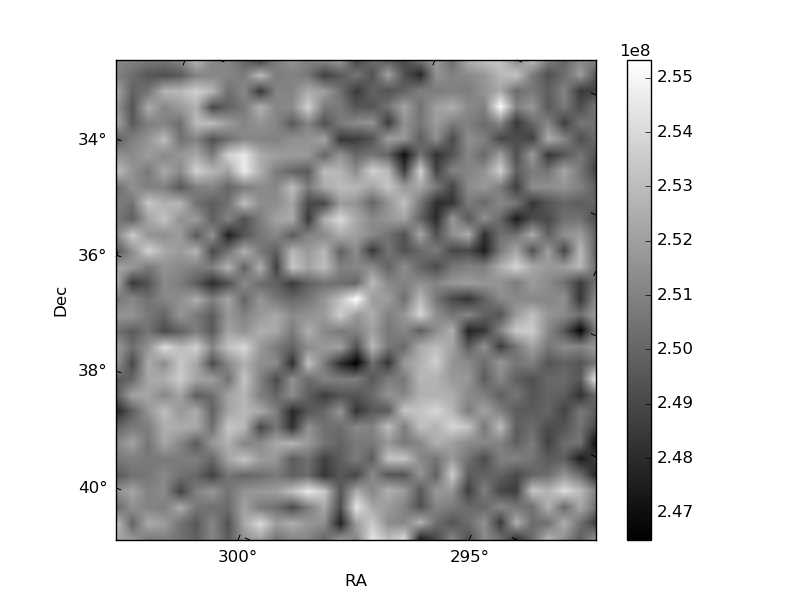
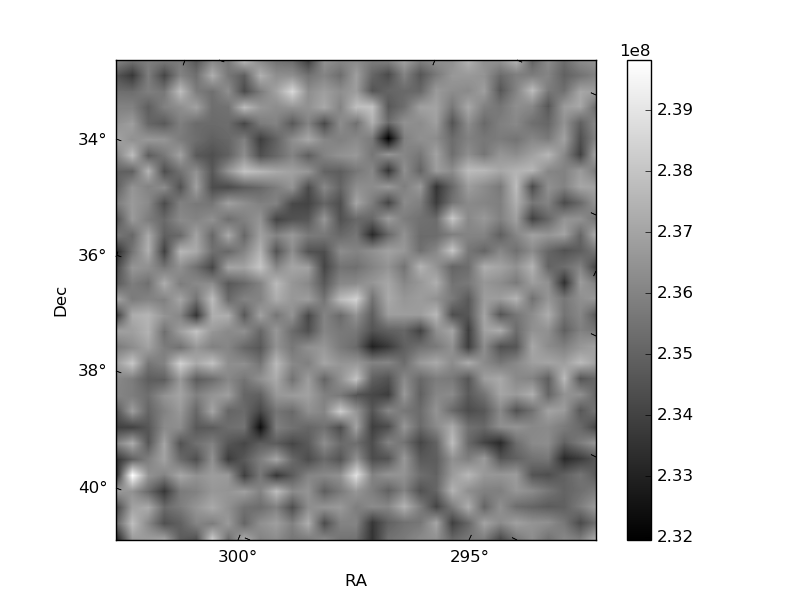
Quadrant B |
|---|---|---|---|
| Quadrant D | 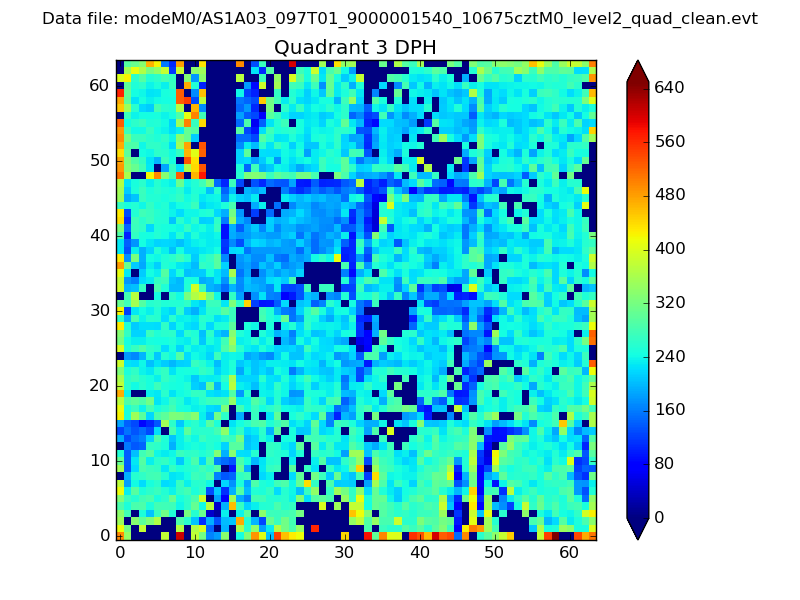 |
 |
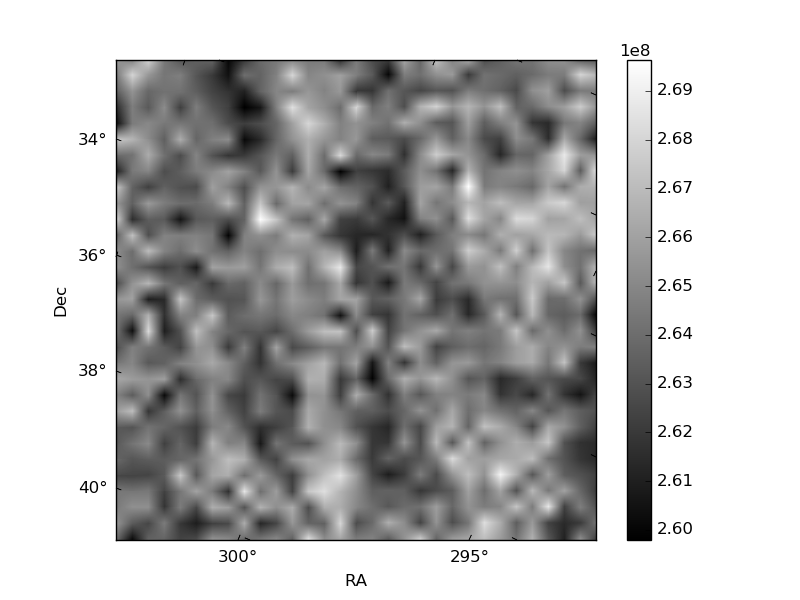
Quadrant C |
| Plot type | Count rate plots | Images |
|---|---|---|
| Comparison with Poisson distribution Blue bars denote a histogram of data divided into 1 sec bins. Red curve is a Poisson curve with rate = median count rate of data. |
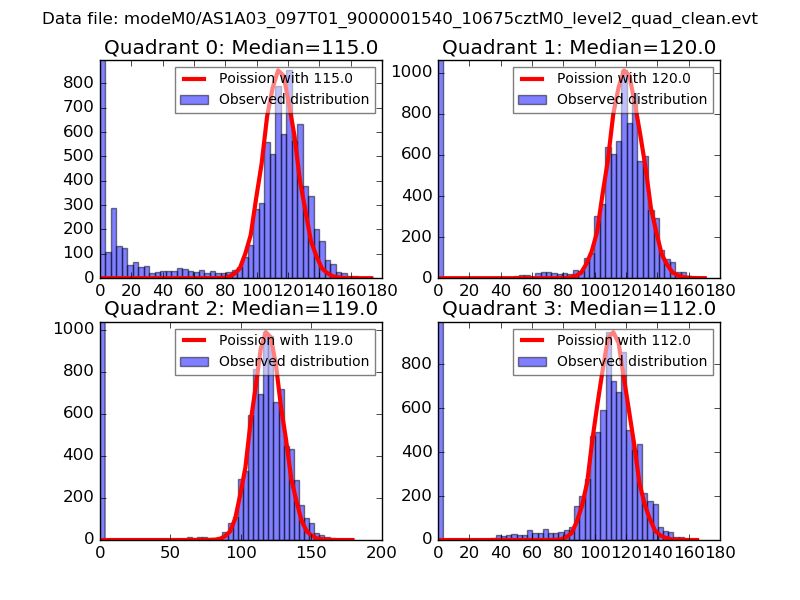 |
 |
| Quadrant-wise count rates Data is divided into 100 sec bins |
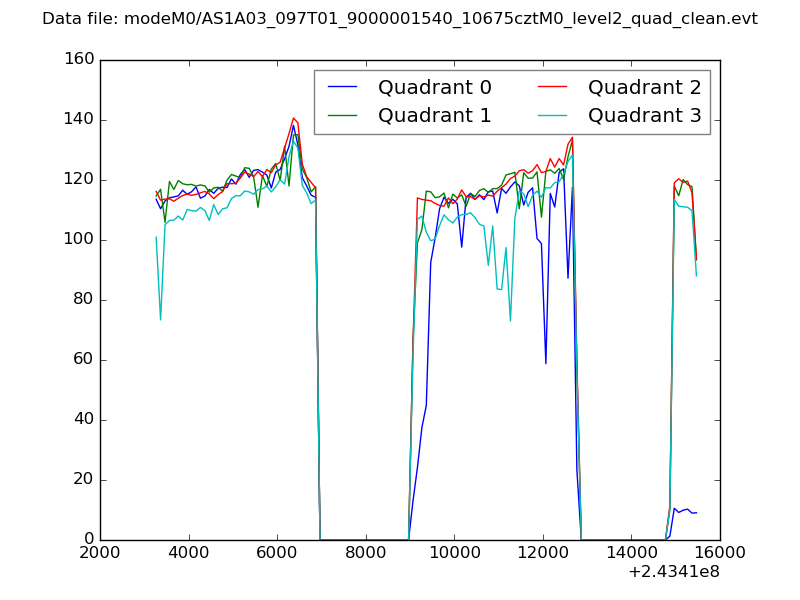 |
|
| Module-wise count rates for Quadrant A Data is divided into 100 sec bins |
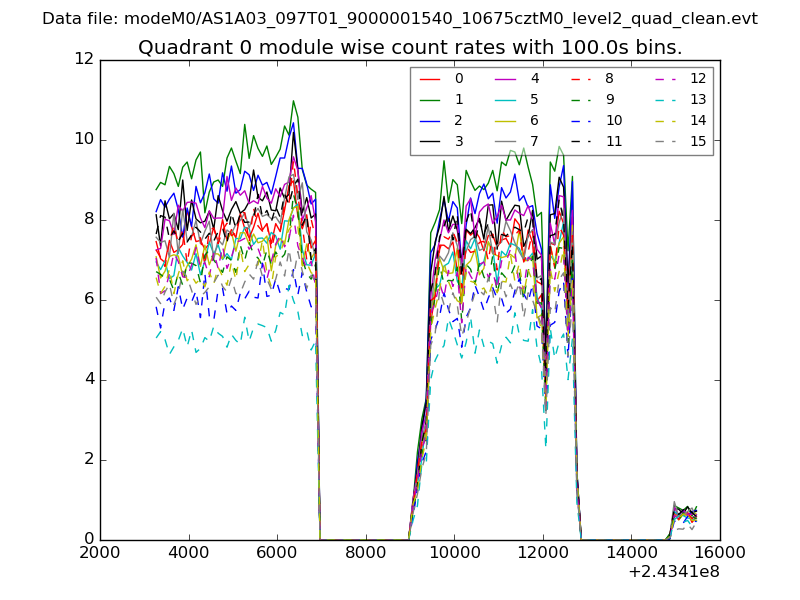 |
 |
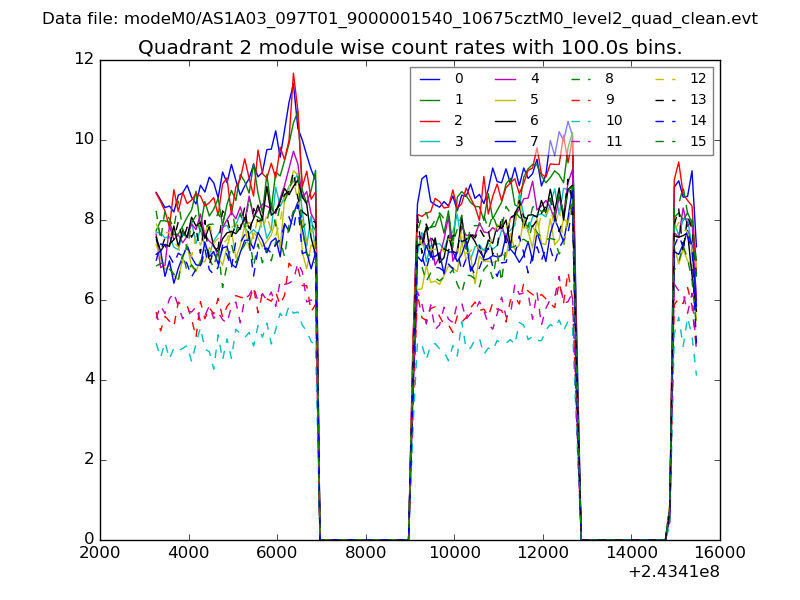
| Module-wise count rates for Quadrant B Data is divided into 100 sec bins |
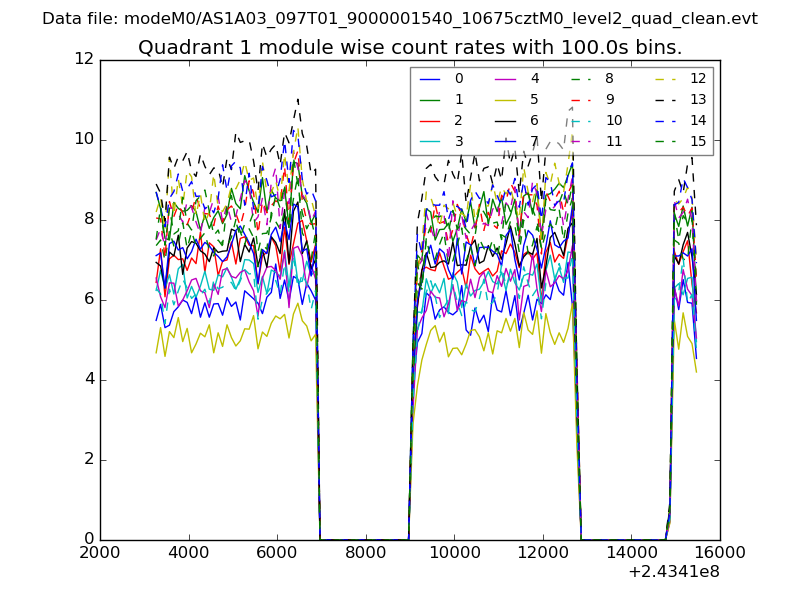 |
 |
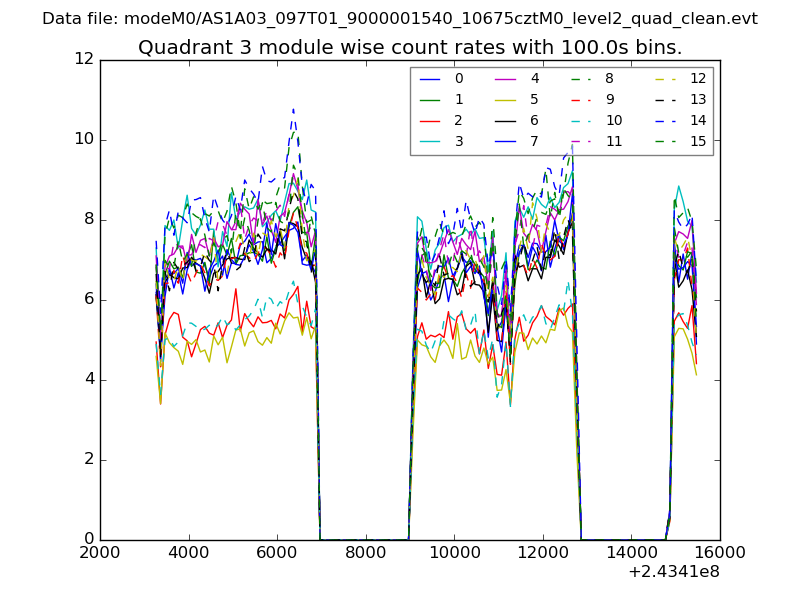
| Module-wise count rates for Quadrant C Data is divided into 100 sec bins |
 |
 |
| Module-wise count rates for Quadrant D Data is divided into 100 sec bins |
 |
 |
| Parameter | Plot |
|---|---|
| CZT HV Monitor |  |
| D_VDD | 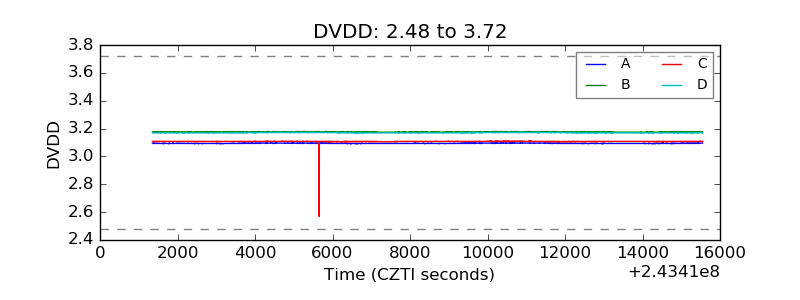 |
| Temperature 1 | 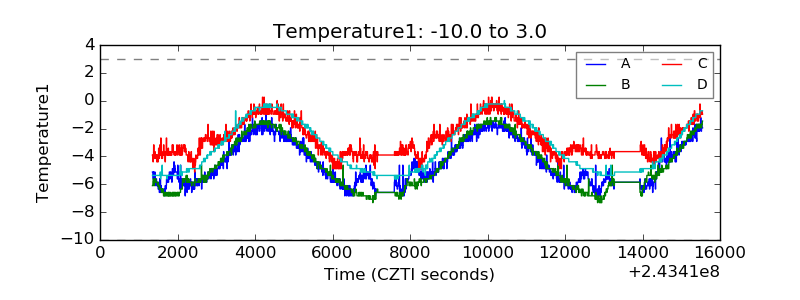 |
| Veto HV Monitor | 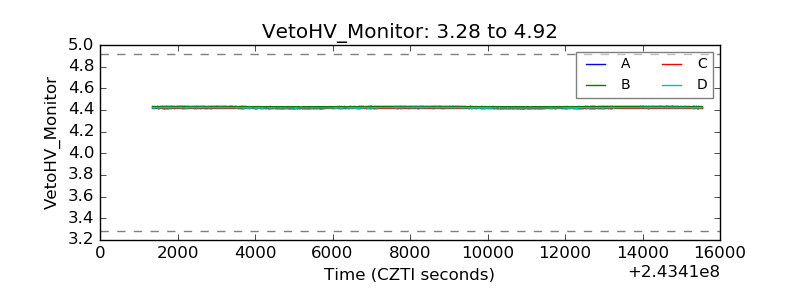 |
| Veto LLD | 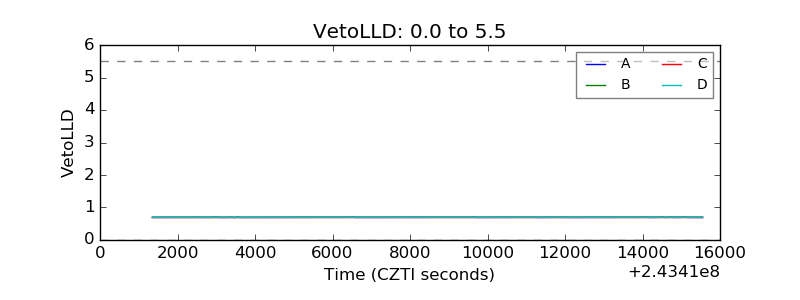 |
| Alpha Counter | 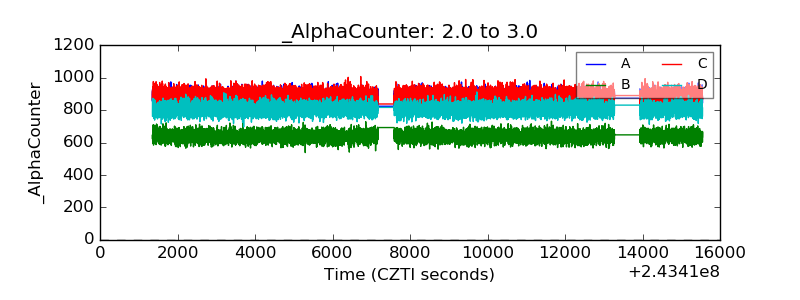 |
| _CPM_Rate | 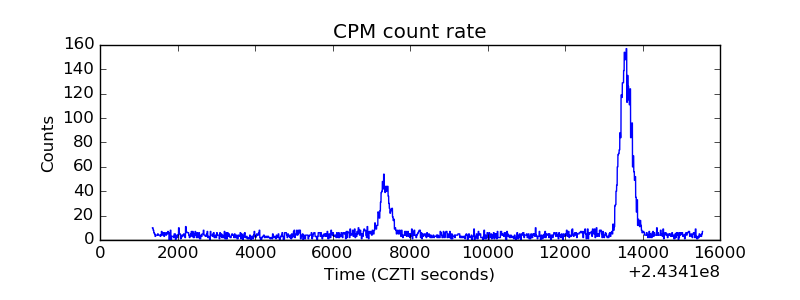 |
| CZT Counter | 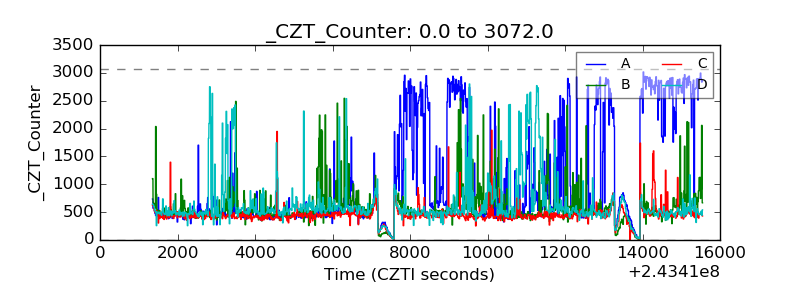 |
| +2.5 Volts monitor |  |
| +5 Volts monitor | 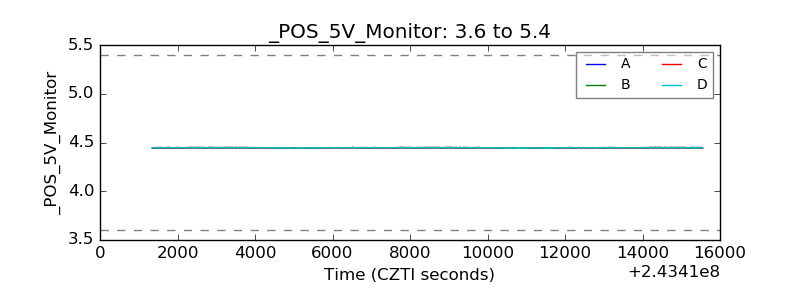 |
| _ROLL_ROT | 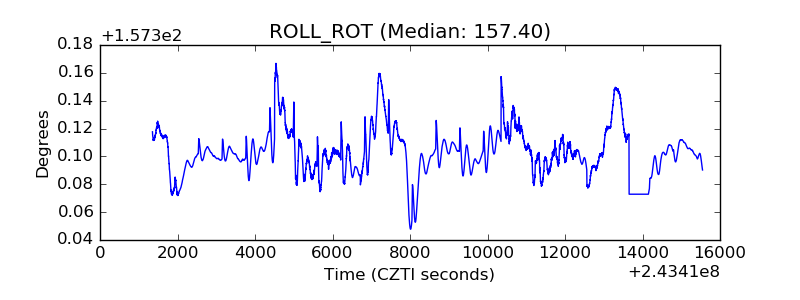 |
| _Roll_DEC | 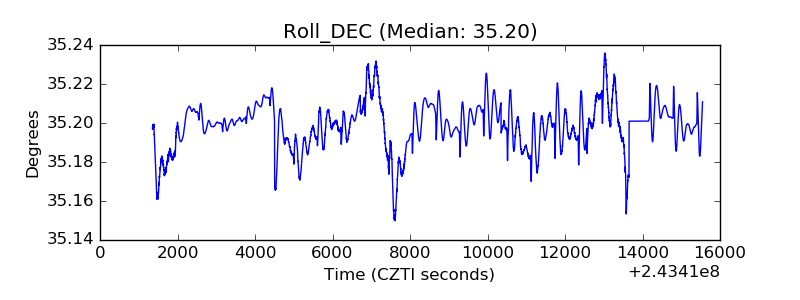 |
| _Roll_RA |  |
| Veto Counter | 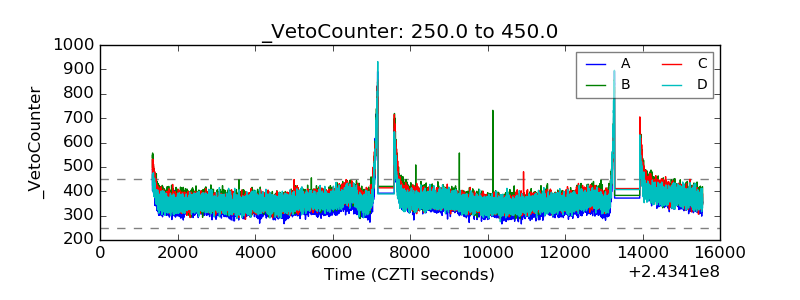 |