| Param | Original file | Final file |
|---|---|---|
| Filename | modeM0/AS1A03_097T01_9000001540_10676cztM0_level2.evt | modeM0/AS1A03_097T01_9000001540_10676cztM0_level2_quad_clean.evt |
| Size (bytes) | 1,002,928,320 | 76,726,080 |
| Size | 956.5 MB | 73.2 MB |
| Events in quadrant A | 17,681,624 | 215,448 |
| Events in quadrant B | 5,081,563 | 543,608 |
| Events in quadrant C | 3,271,920 | 552,889 |
| Events in quadrant D | 3,868,486 | 523,528 |
| Mode M9 | |||
|---|---|---|---|
| Quadrant | BADHDUFLAG | Total packets | Discarded packets |
| A | 0 | 8 | 0 |
| B | 0 | 8 | 0 |
| C | 0 | 8 | 0 |
| D | 0 | 8 | 0 |
| Mode M0 | |||
|---|---|---|---|
| Quadrant | BADHDUFLAG | Total packets | Discarded packets |
| A | 0 | 56950 | 12 |
| B | 0 | 19675 | 6 |
| C | 0 | 14543 | 2 |
| D | 0 | 15710 | 4 |
| Mode SS | |||
|---|---|---|---|
| Quadrant | BADHDUFLAG | Total packets | Discarded packets |
| A | 0 | 142 | 0 |
| B | 0 | 142 | 0 |
| C | 0 | 142 | 0 |
| D | 0 | 142 | 0 |
| Quadrant | Total seconds | Saturated seconds | Saturation percentage |
|---|---|---|---|
| A | 6972 | 6061 | 86.933448% |
| B | 6972 | 457 | 6.554791% |
| C | 6973 | 77 | 1.104259% |
| D | 6972 | 102 | 1.462995% |
Noise dominated data is calculated using 1-second bins in cleaned event files. If a bin has >2000 counts, and if more than 50% of those come from <1% of pixels, then it is considered to be noise-dominated and hence unusable.
| Quadrant | # 1 sec bins | Bins with >0 counts | Bins with >2000 counts | High rate bins dominated by noise | Noise dominated (total time) | Noise dominated (detector-on time) | Marked lightcurve |
|---|---|---|---|---|---|---|---|
| A | 7818 | 6972 | 5974 | 5974 | 76.41% | 85.69% | 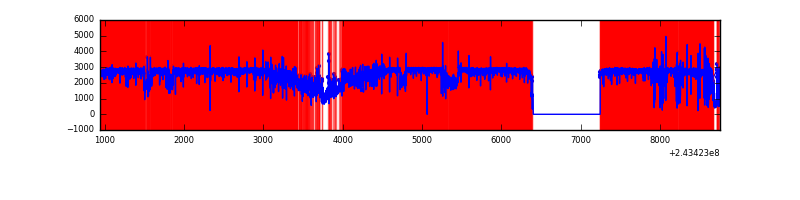 |
| B | 7818 | 6973 | 271 | 271 | 3.47% | 3.89% | 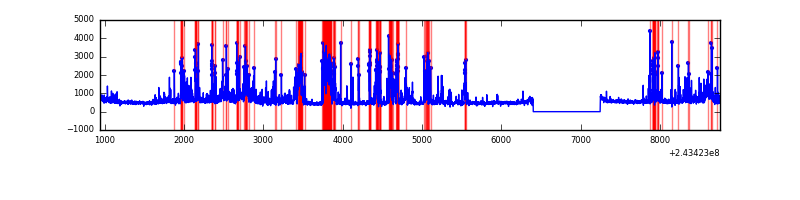 |
| C | 7818 | 6973 | 11 | 11 | 0.14% | 0.16% | 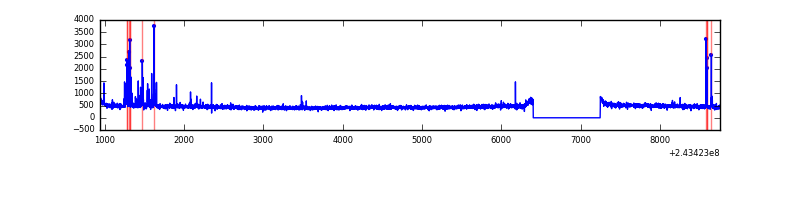 |
| D | 7818 | 6973 | 45 | 45 | 0.58% | 0.65% | 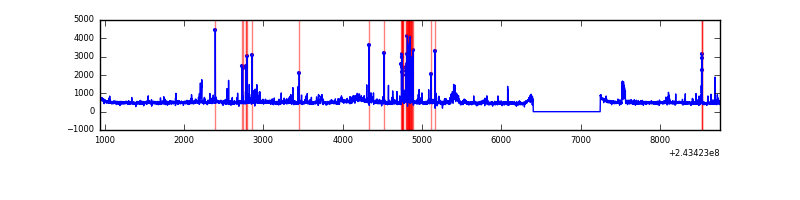 |
Top three noisy pixels from each quadrant. If the there are fewer than three noisy pixels in the level2.evt file, extra rows are filled as -1
| Pixel properties | Quadrant properties | ||||||
|---|---|---|---|---|---|---|---|
| Quadrant | DetID | PixID | Counts | Sigma | Mean | Median | Sigma |
| A | 15 | 239 | 16470810 | 262653.75 | 304 | 298 | 62.7 |
| A | 1 | 162 | 13806 | 215.41 | 304 | 298 | 62.7 |
| A | 13 | 251 | 7318 | 111.95 | 304 | 298 | 62.7 |
| B | 4 | 239 | 1360801 | 8636.59 | 815 | 792 | 157.5 |
| B | 4 | 81 | 295832 | 1873.62 | 815 | 792 | 157.5 |
| B | 0 | 214 | 89162 | 561.18 | 815 | 792 | 157.5 |
| C | 4 | 254 | 108727 | 580.87 | 800 | 805 | 185.8 |
| C | 1 | 3 | 22879 | 118.81 | 800 | 805 | 185.8 |
| C | 14 | 234 | 10482 | 52.08 | 800 | 805 | 185.8 |
| D | 8 | 195 | 280777 | 1458.94 | 796 | 773 | 191.9 |
| D | 1 | 52 | 143580 | 744.09 | 796 | 773 | 191.9 |
| D | 12 | 233 | 121394 | 628.49 | 796 | 773 | 191.9 |
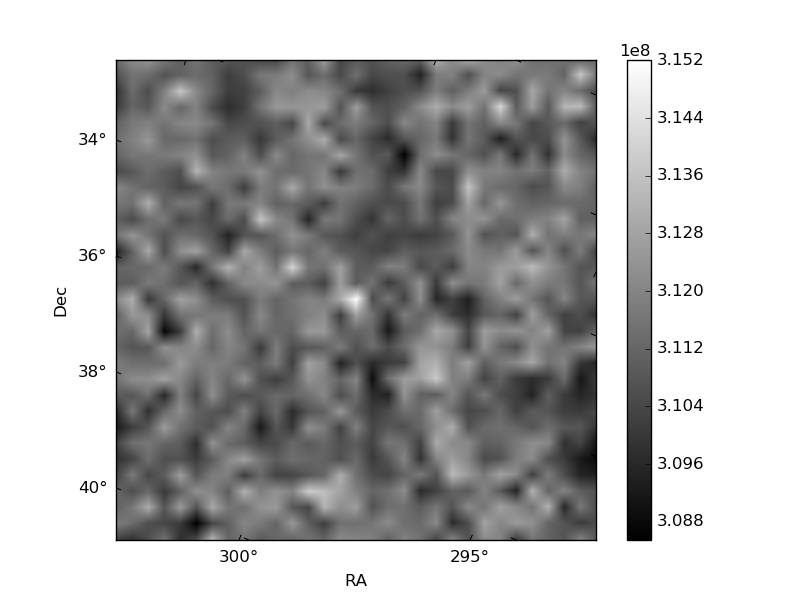
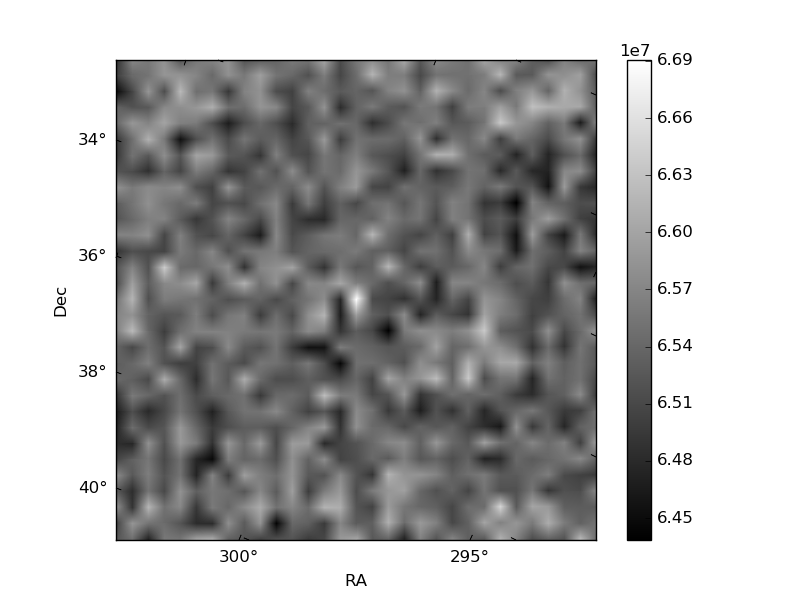
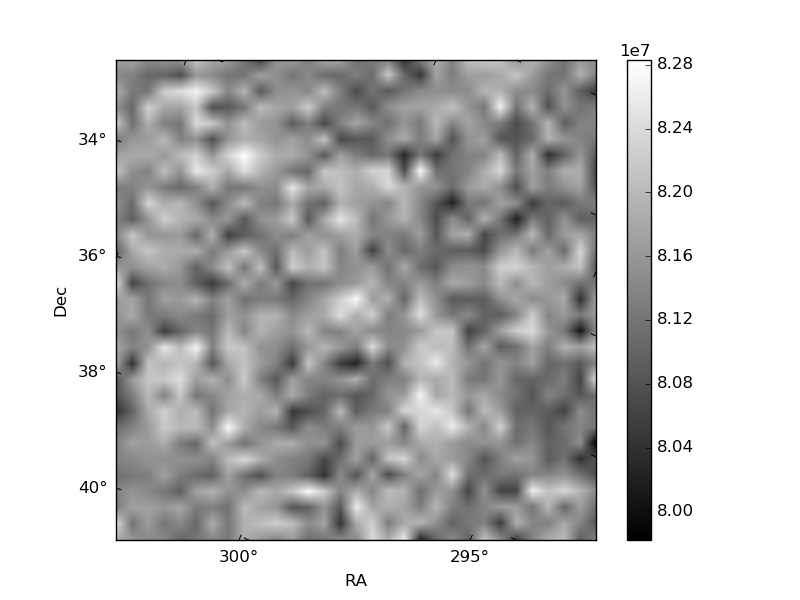
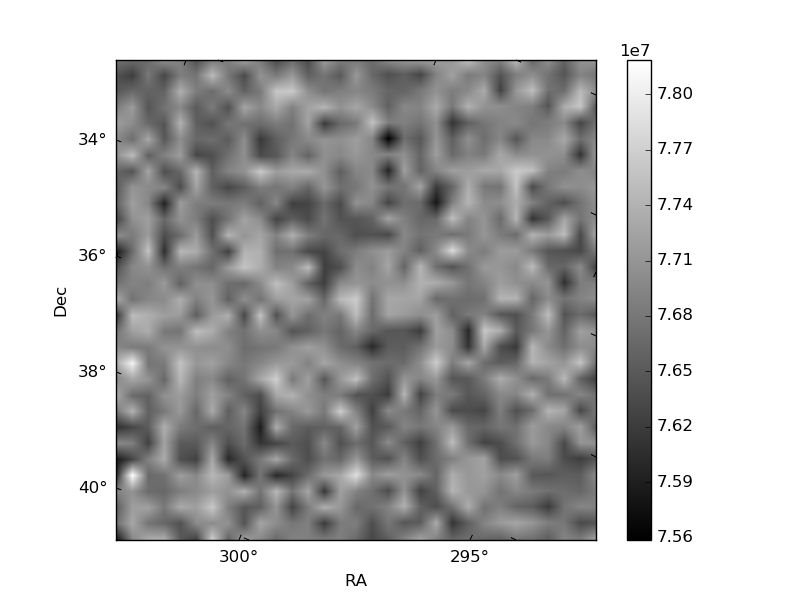
Histogram calculated using DETX and DETY for each event in the final _common_clean file
| Quadrant A | 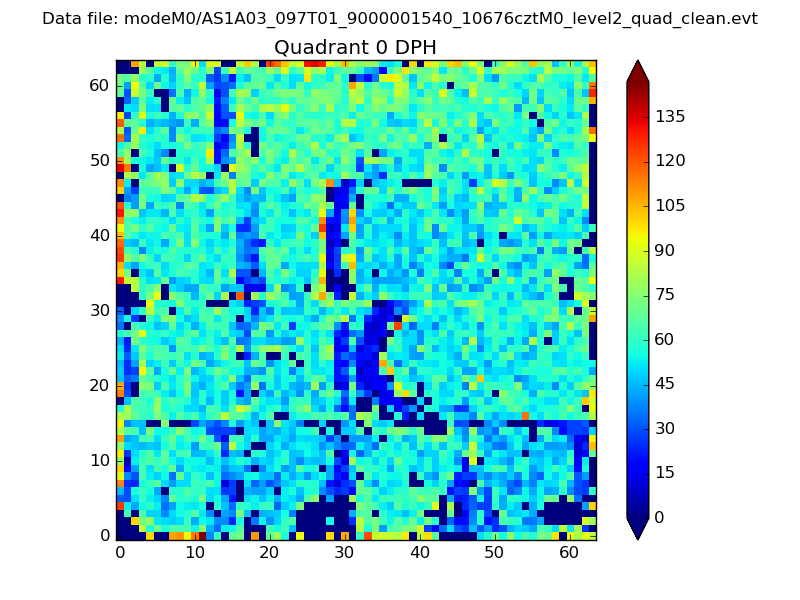 |
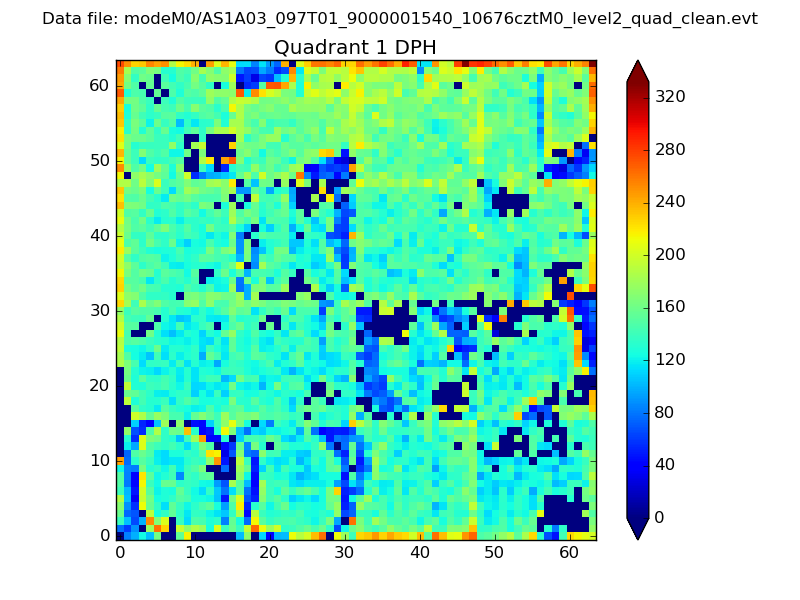 |
Quadrant B |
|---|---|---|---|
| Quadrant D | 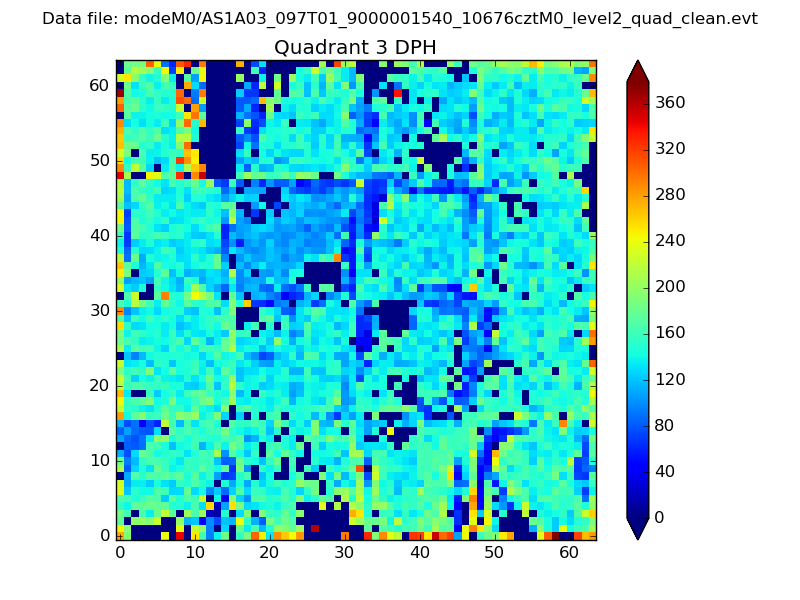 |
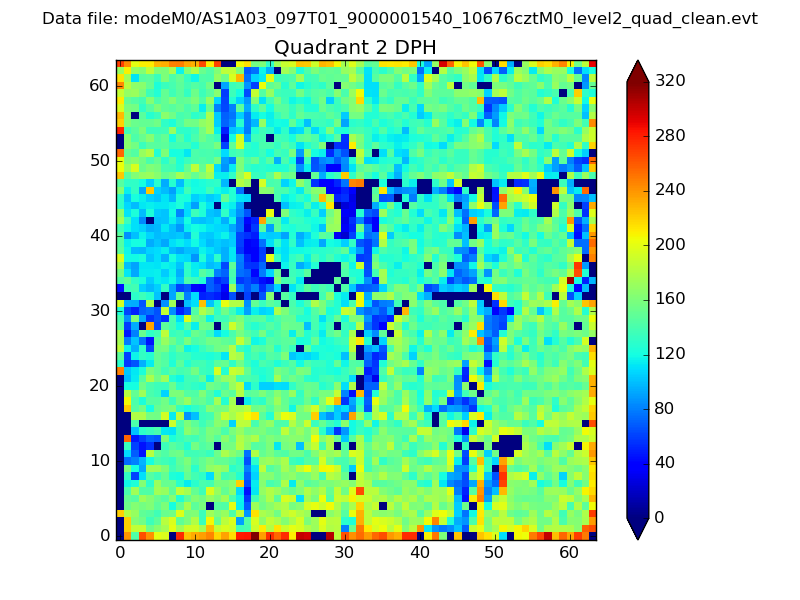 |
Quadrant C |
| Plot type | Count rate plots | Images |
|---|---|---|
| Comparison with Poisson distribution Blue bars denote a histogram of data divided into 1 sec bins. Red curve is a Poisson curve with rate = median count rate of data. |
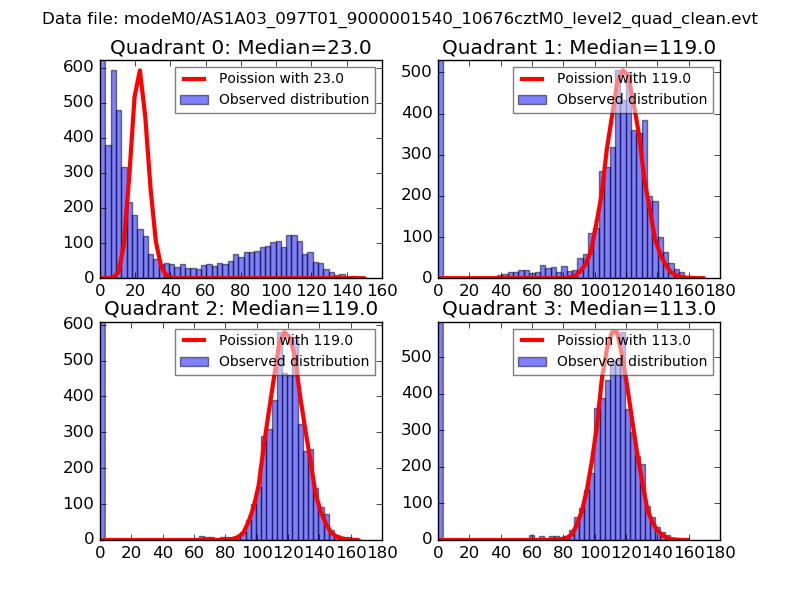 |
 |
| Quadrant-wise count rates Data is divided into 100 sec bins |
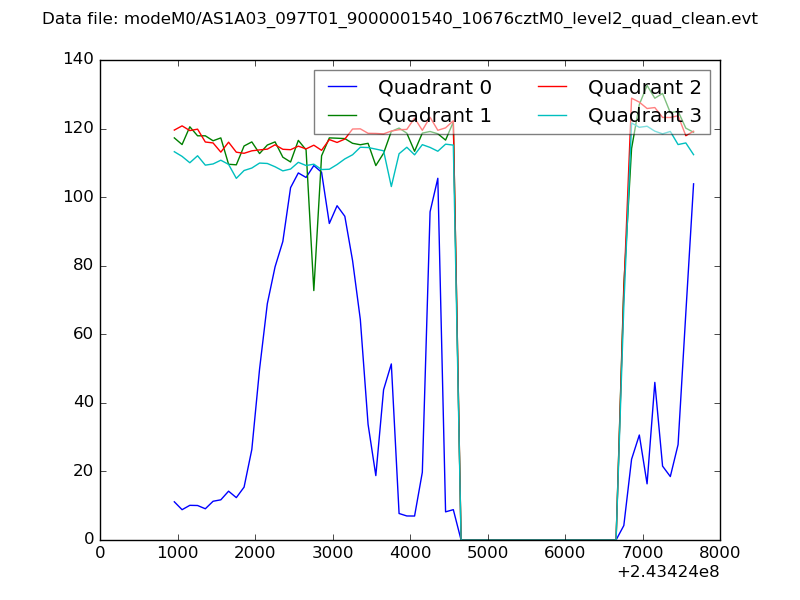 |
|
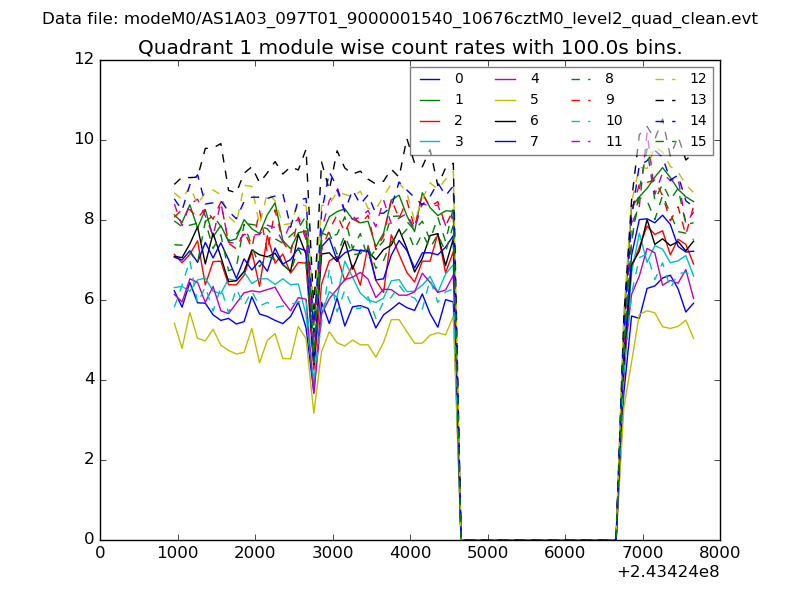
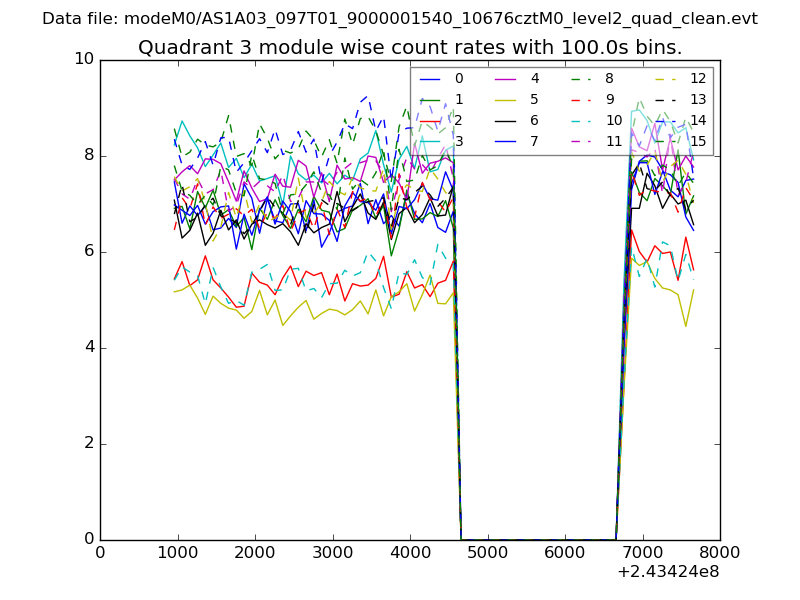
| Module-wise count rates for Quadrant A Data is divided into 100 sec bins |
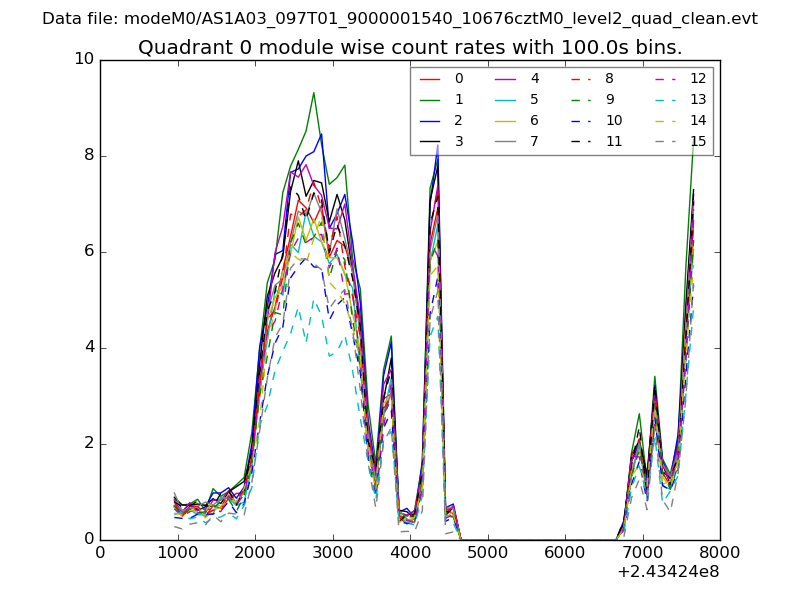 |
 |
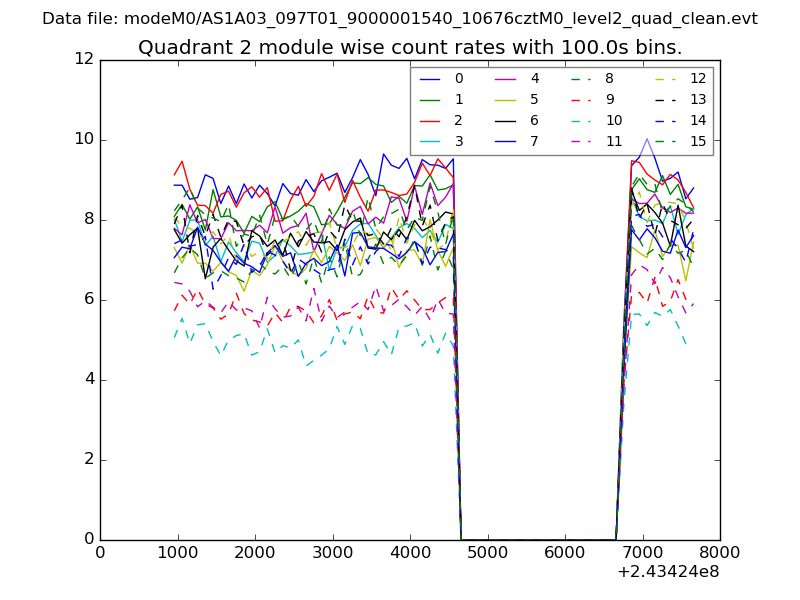
| Module-wise count rates for Quadrant B Data is divided into 100 sec bins |
 |
 |
| Module-wise count rates for Quadrant C Data is divided into 100 sec bins |
 |
 |
| Module-wise count rates for Quadrant D Data is divided into 100 sec bins |
 |
 |
| Parameter | Plot |
|---|---|
| CZT HV Monitor | 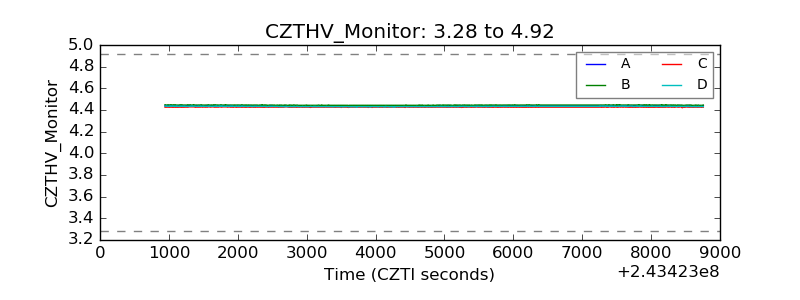 |
| D_VDD | 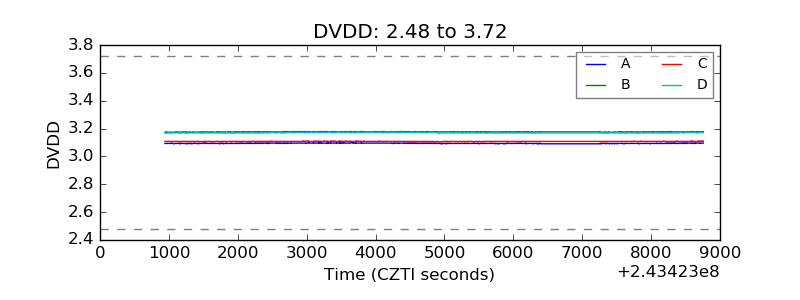 |
| Temperature 1 | 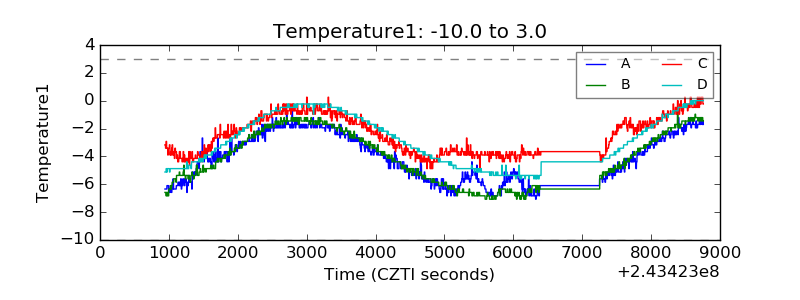 |
| Veto HV Monitor | 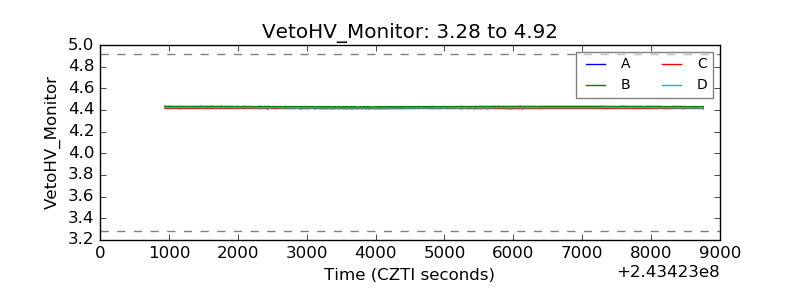 |
| Veto LLD | 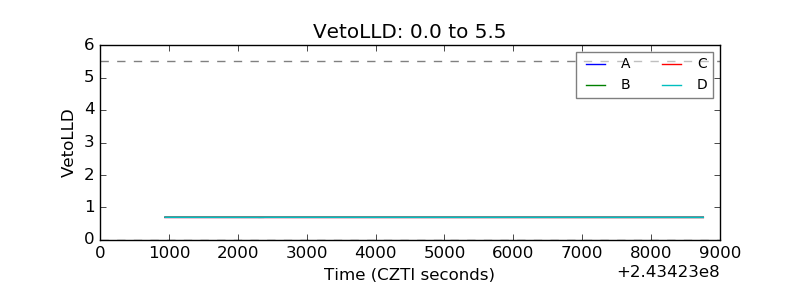 |
| Alpha Counter | 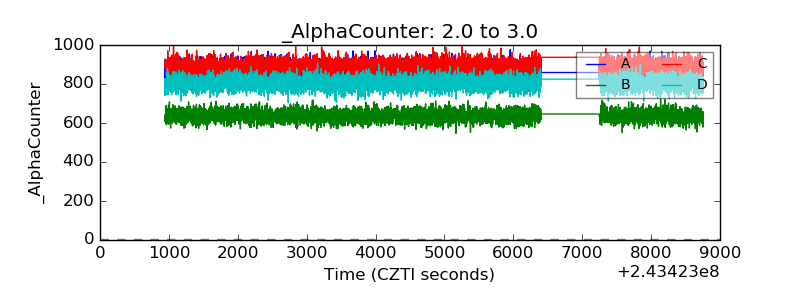 |
| _CPM_Rate | 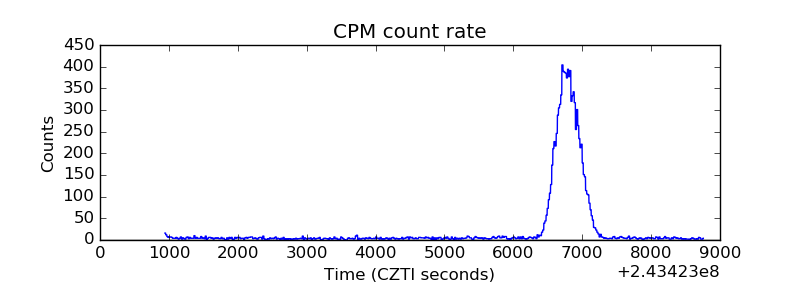 |
| CZT Counter | 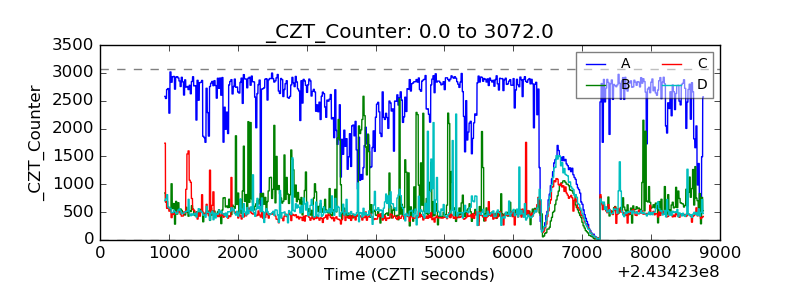 |
| +2.5 Volts monitor |  |
| +5 Volts monitor |  |
| _ROLL_ROT | 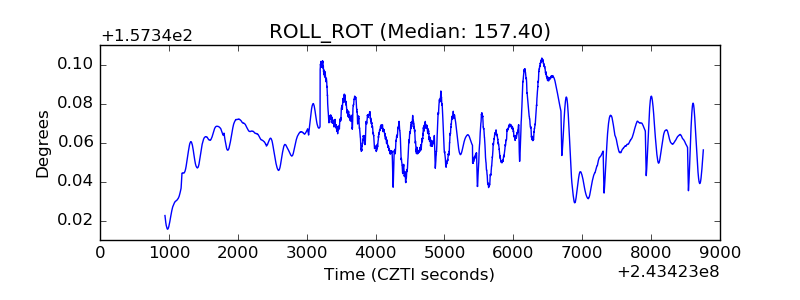 |
| _Roll_DEC | 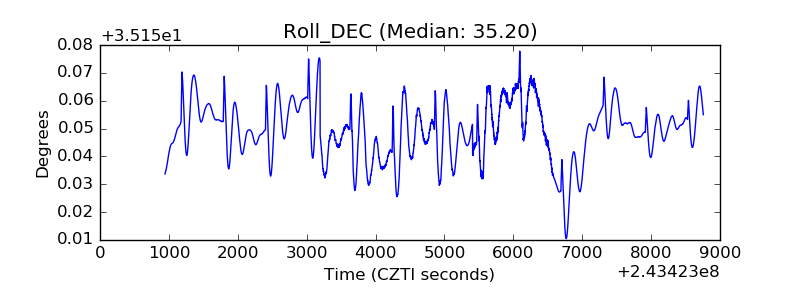 |
| _Roll_RA | 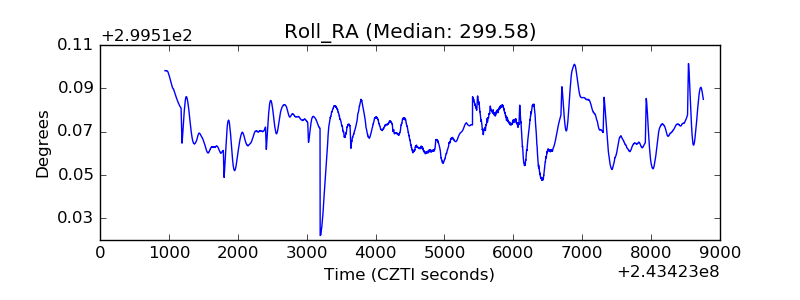 |
| Veto Counter | 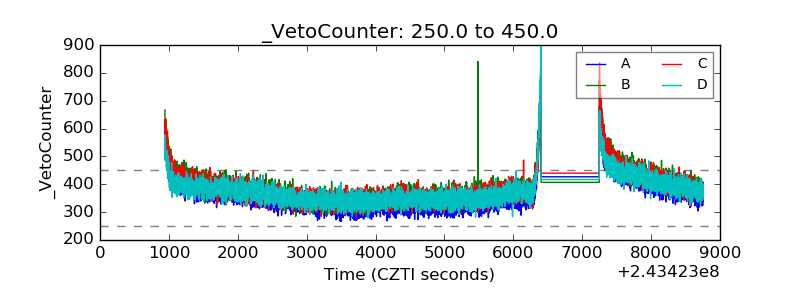 |