| Param | Original file | Final file |
|---|---|---|
| Filename | modeM0/AS1A03_097T01_9000001540_10677cztM0_level2.evt | modeM0/AS1A03_097T01_9000001540_10677cztM0_level2_quad_clean.evt |
| Size (bytes) | 637,983,360 | 89,680,320 |
| Size | 608.4 MB | 85.5 MB |
| Events in quadrant A | 8,090,523 | 425,182 |
| Events in quadrant B | 4,402,414 | 627,198 |
| Events in quadrant C | 2,821,721 | 628,147 |
| Events in quadrant D | 3,584,073 | 598,906 |
| Mode M9 | |||
|---|---|---|---|
| Quadrant | BADHDUFLAG | Total packets | Discarded packets |
| A | 0 | 10 | 0 |
| B | 0 | 10 | 0 |
| C | 0 | 10 | 0 |
| D | 0 | 10 | 0 |
| Mode M0 | |||
|---|---|---|---|
| Quadrant | BADHDUFLAG | Total packets | Discarded packets |
| A | 0 | 28319 | 2 |
| B | 0 | 17221 | 1 |
| C | 0 | 12726 | 1 |
| D | 0 | 14738 | 1 |
| Mode SS | |||
|---|---|---|---|
| Quadrant | BADHDUFLAG | Total packets | Discarded packets |
| A | 0 | 128 | 0 |
| B | 0 | 128 | 0 |
| C | 0 | 128 | 0 |
| D | 0 | 128 | 0 |
| Quadrant | Total seconds | Saturated seconds | Saturation percentage |
|---|---|---|---|
| A | 6232 | 2324 | 37.291399% |
| B | 6232 | 301 | 4.829910% |
| C | 6232 | 38 | 0.609756% |
| D | 6232 | 63 | 1.010911% |
Noise dominated data is calculated using 1-second bins in cleaned event files. If a bin has >2000 counts, and if more than 50% of those come from <1% of pixels, then it is considered to be noise-dominated and hence unusable.
| Quadrant | # 1 sec bins | Bins with >0 counts | Bins with >2000 counts | High rate bins dominated by noise | Noise dominated (total time) | Noise dominated (detector-on time) | Marked lightcurve |
|---|---|---|---|---|---|---|---|
| A | 7271 | 6232 | 2182 | 2182 | 30.01% | 35.01% | 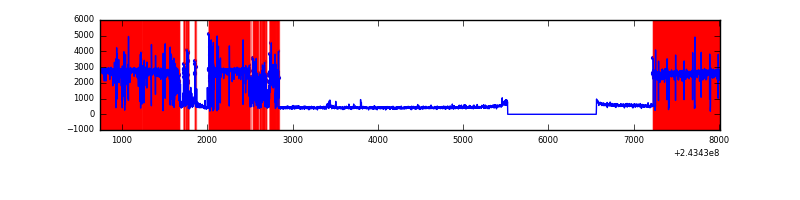 |
| B | 7272 | 6233 | 178 | 178 | 2.45% | 2.86% | 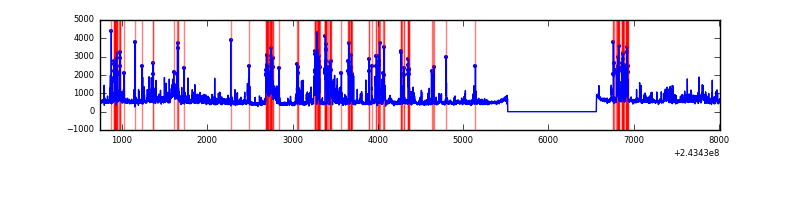 |
| C | 7272 | 6233 | 4 | 4 | 0.06% | 0.06% | 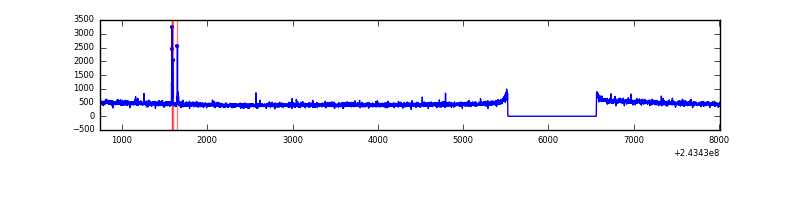 |
| D | 7272 | 6233 | 29 | 29 | 0.40% | 0.47% | 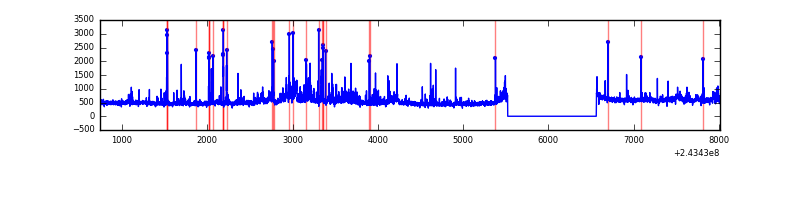 |
Top three noisy pixels from each quadrant. If the there are fewer than three noisy pixels in the level2.evt file, extra rows are filled as -1
| Pixel properties | Quadrant properties | ||||||
|---|---|---|---|---|---|---|---|
| Quadrant | DetID | PixID | Counts | Sigma | Mean | Median | Sigma |
| A | 15 | 239 | 5915630 | 52164.92 | 556 | 543 | 113.4 |
| A | 1 | 162 | 13843 | 117.29 | 556 | 543 | 113.4 |
| A | 4 | 2 | 7832 | 64.28 | 556 | 543 | 113.4 |
| B | 4 | 239 | 1108694 | 8005.06 | 727 | 710 | 138.4 |
| B | 4 | 81 | 222431 | 1601.91 | 727 | 710 | 138.4 |
| B | 15 | 204 | 64674 | 462.13 | 727 | 710 | 138.4 |
| C | 1 | 3 | 22761 | 133.03 | 715 | 720 | 165.7 |
| C | 13 | 61 | 5389 | 28.18 | 715 | 720 | 165.7 |
| C | 14 | 67 | 4001 | 19.8 | 715 | 720 | 165.7 |
| D | 8 | 195 | 297496 | 1722.17 | 716 | 695 | 172.3 |
| D | 1 | 52 | 149778 | 865.04 | 716 | 695 | 172.3 |
| D | 10 | 199 | 95668 | 551.07 | 716 | 695 | 172.3 |
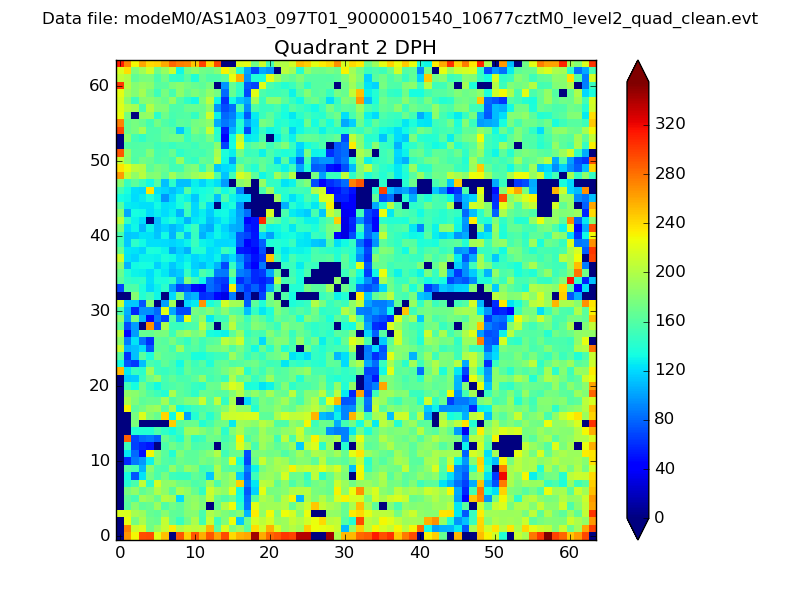
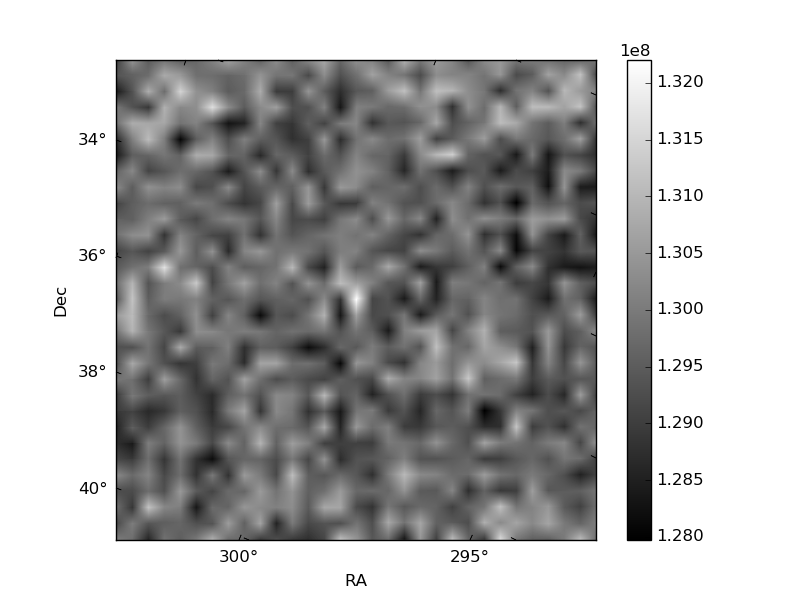
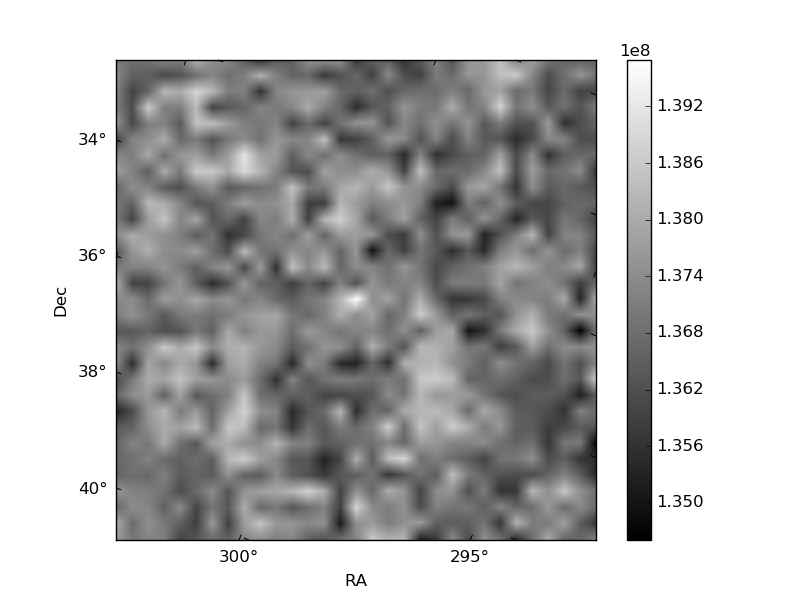
Histogram calculated using DETX and DETY for each event in the final _common_clean file
| Quadrant A | 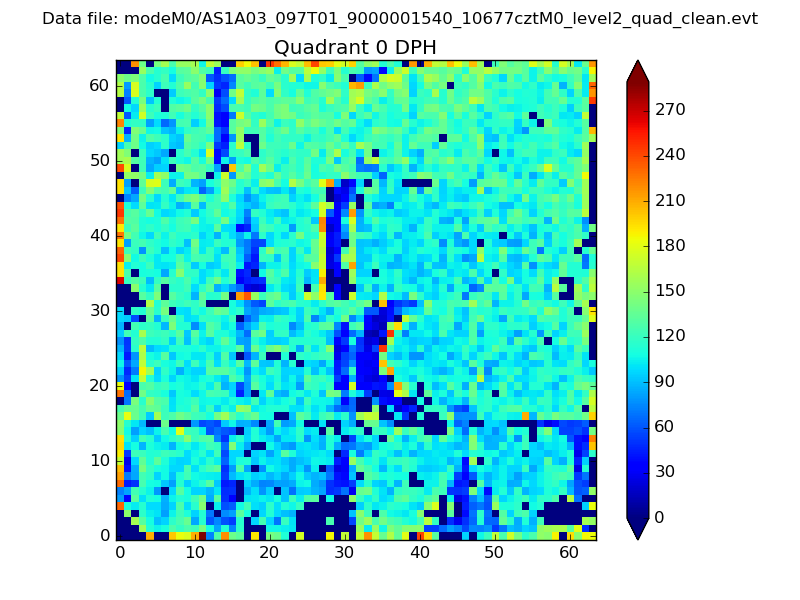 |
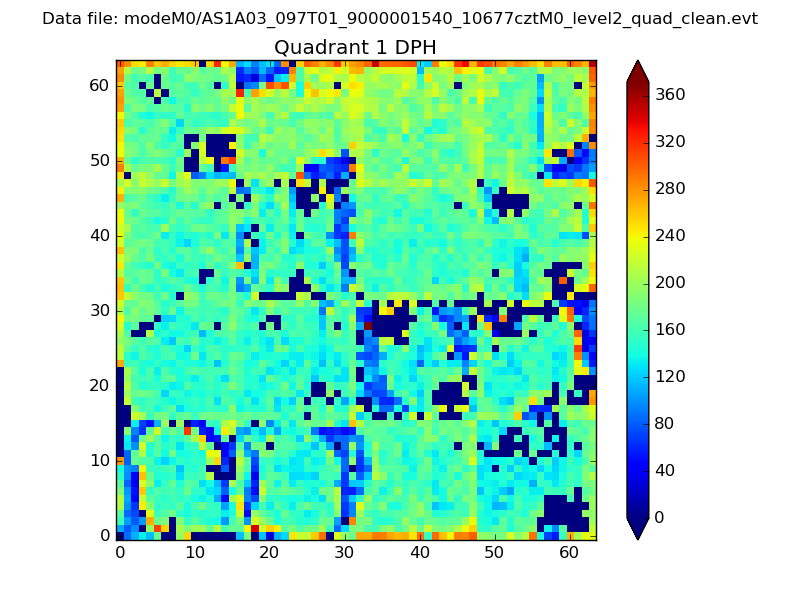 |
Quadrant B |
|---|---|---|---|
| Quadrant D | 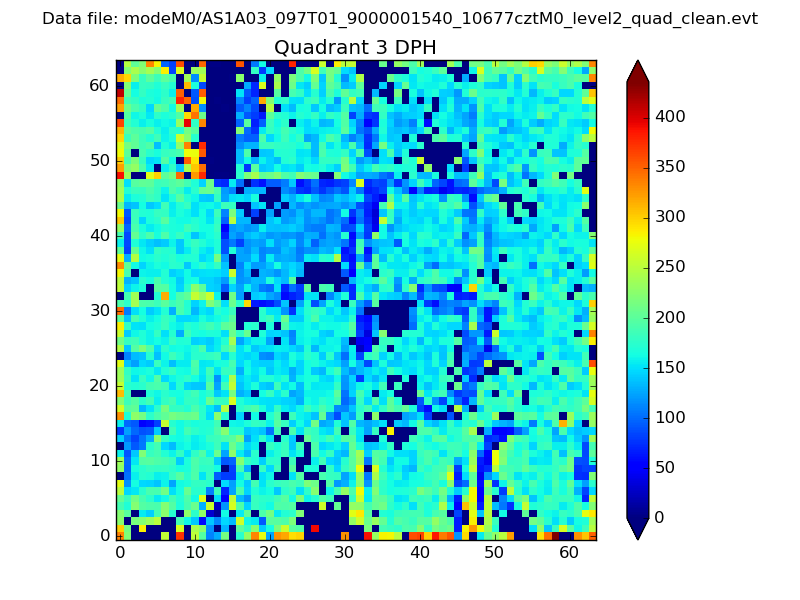 |
 |
Quadrant C |
| Plot type | Count rate plots | Images |
|---|---|---|
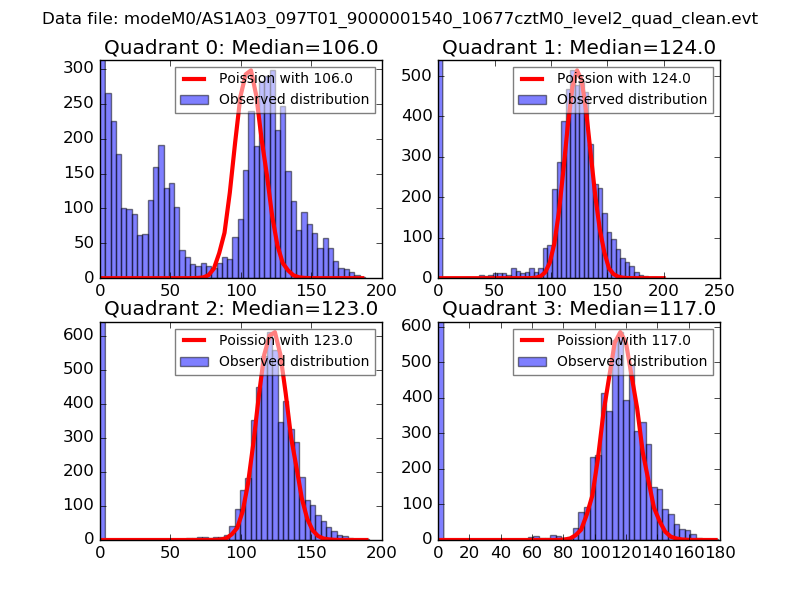
| Comparison with Poisson distribution Blue bars denote a histogram of data divided into 1 sec bins. Red curve is a Poisson curve with rate = median count rate of data. |
 |
 |
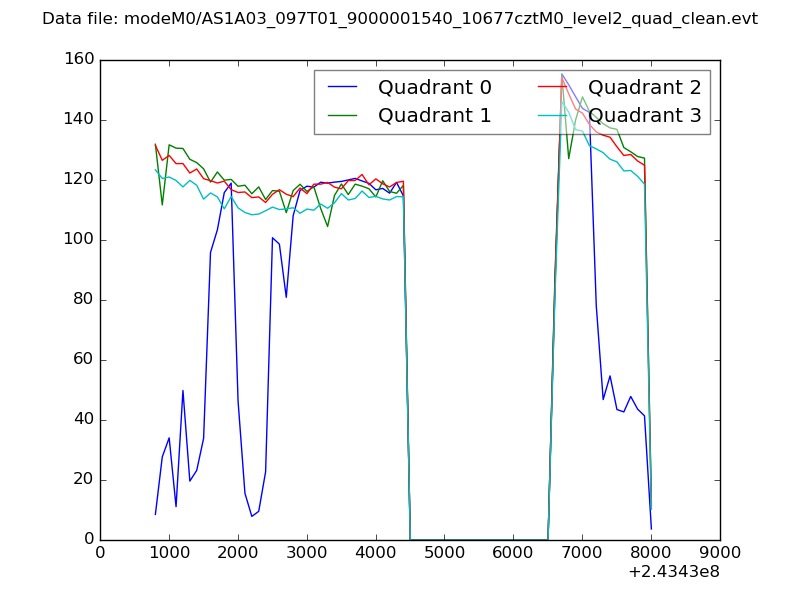
| Quadrant-wise count rates Data is divided into 100 sec bins |
 |
|
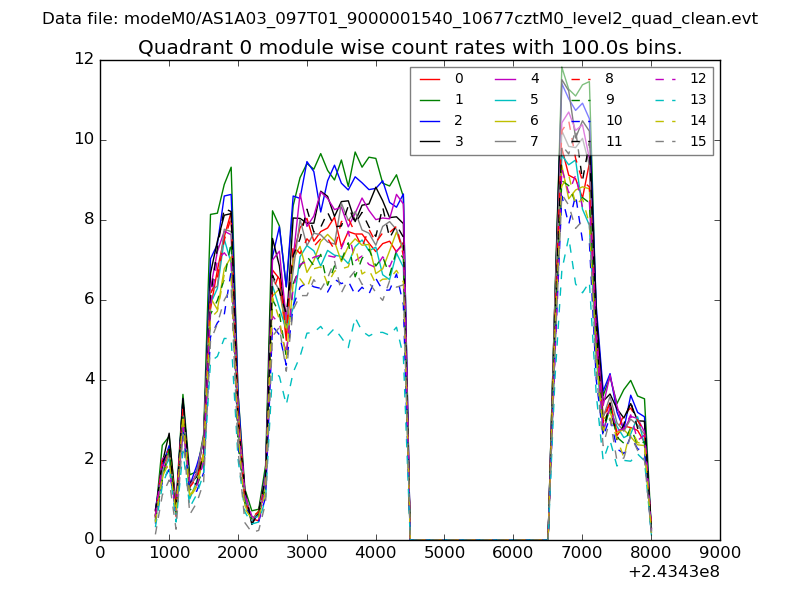
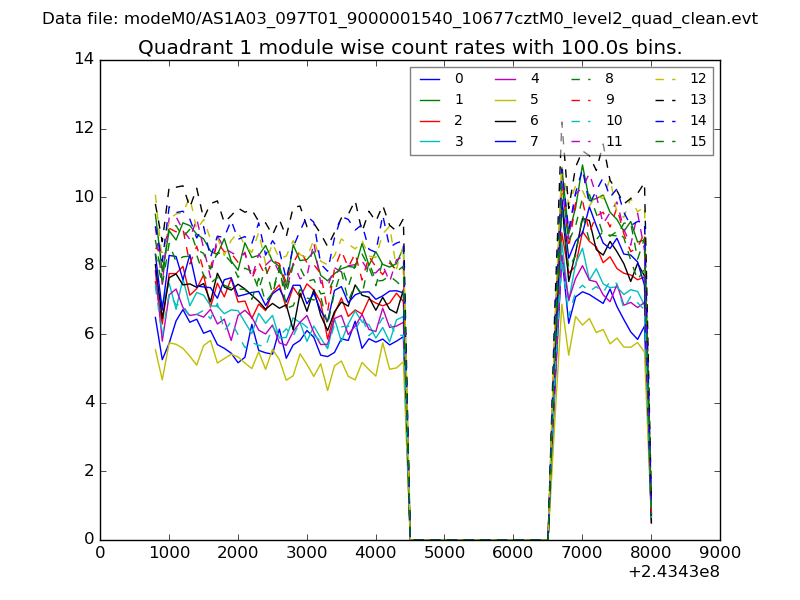
| Module-wise count rates for Quadrant A Data is divided into 100 sec bins |
 |
 |
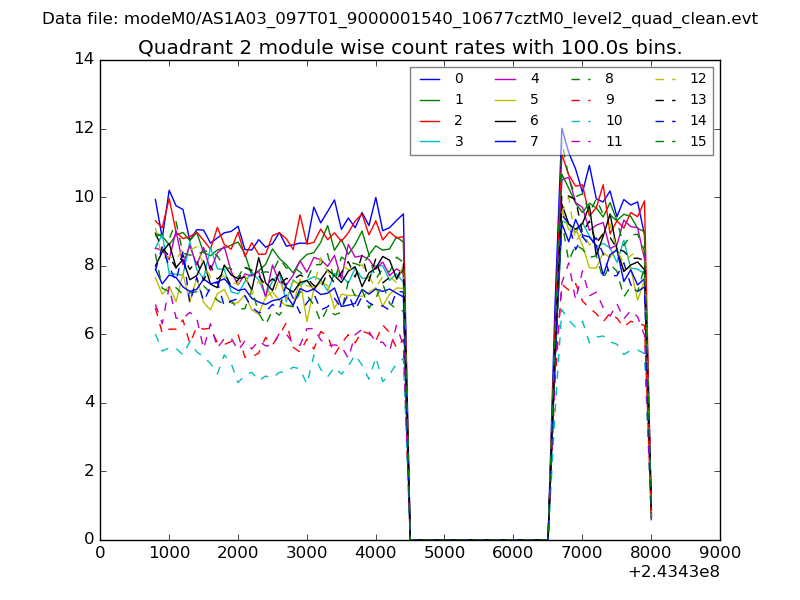
| Module-wise count rates for Quadrant B Data is divided into 100 sec bins |
 |
 |
| Module-wise count rates for Quadrant C Data is divided into 100 sec bins |
 |
 |
| Module-wise count rates for Quadrant D Data is divided into 100 sec bins |
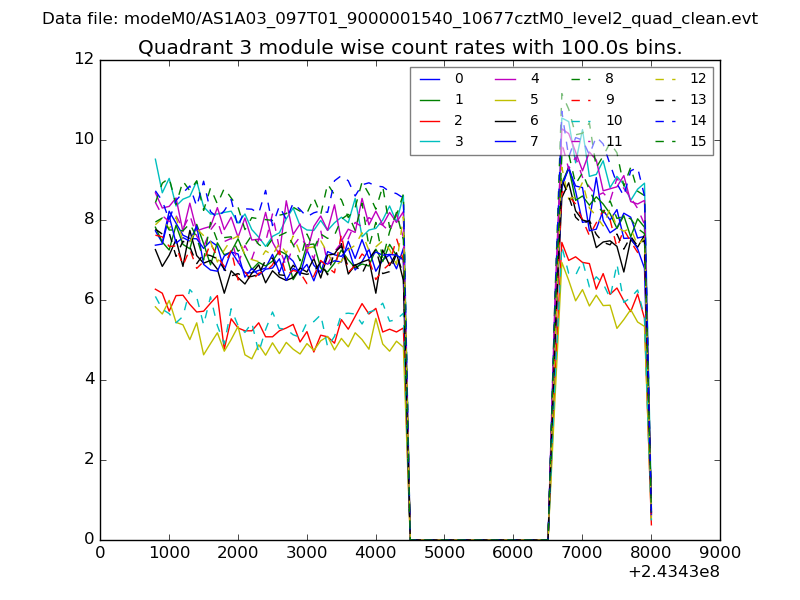 |
 |
| Parameter | Plot |
|---|---|
| CZT HV Monitor | 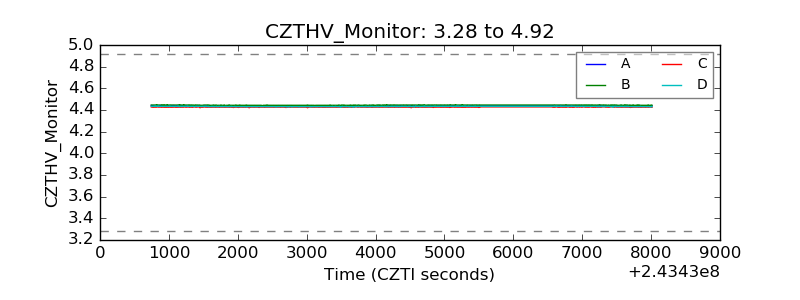 |
| D_VDD | 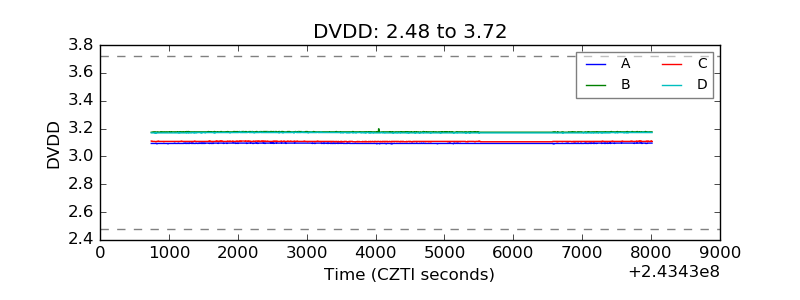 |
| Temperature 1 | 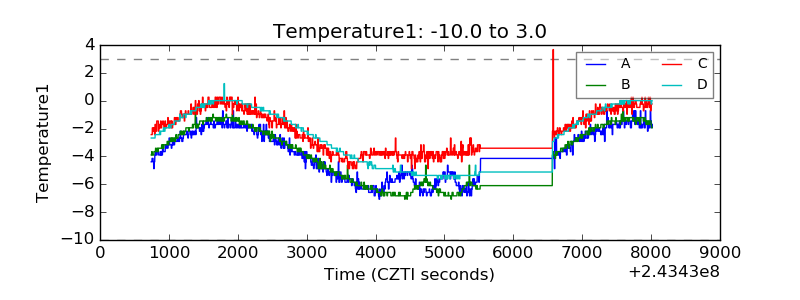 |
| Veto HV Monitor |  |
| Veto LLD | 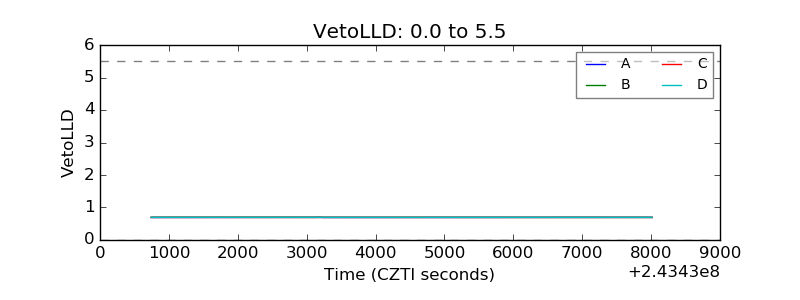 |
| Alpha Counter | 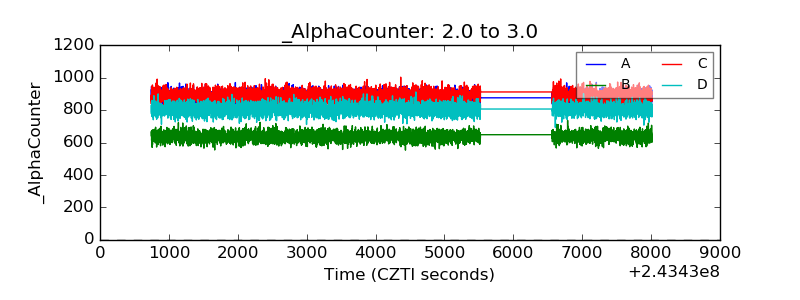 |
| _CPM_Rate | 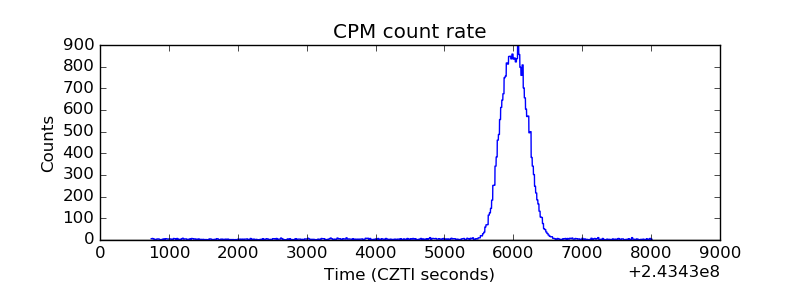 |
| CZT Counter | 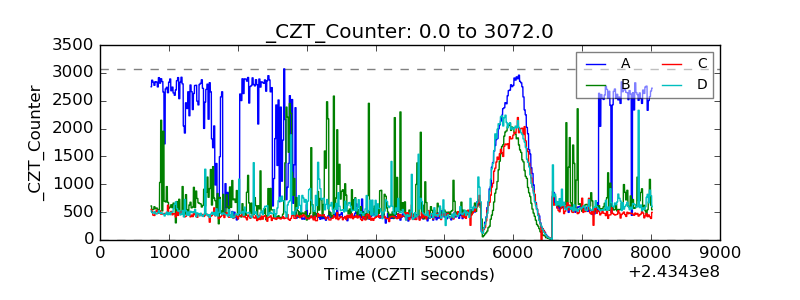 |
| +2.5 Volts monitor | 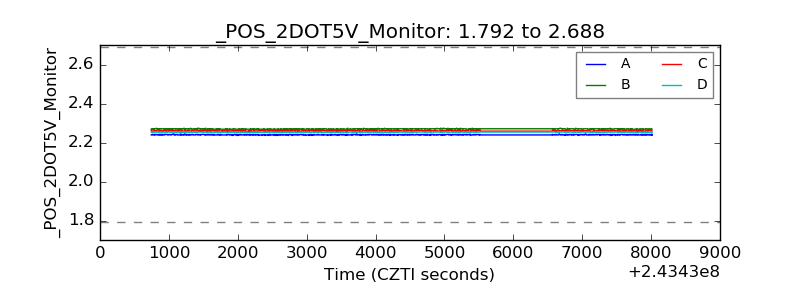 |
| +5 Volts monitor |  |
| _ROLL_ROT | 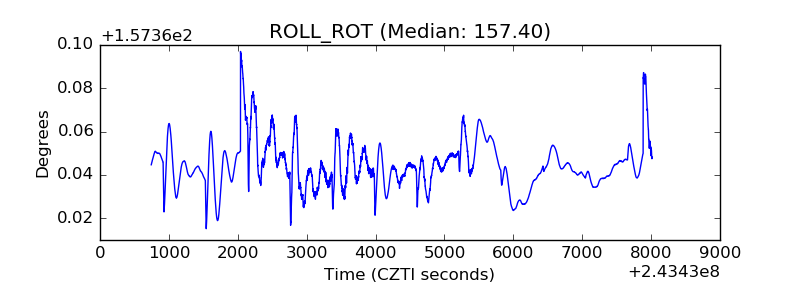 |
| _Roll_DEC | 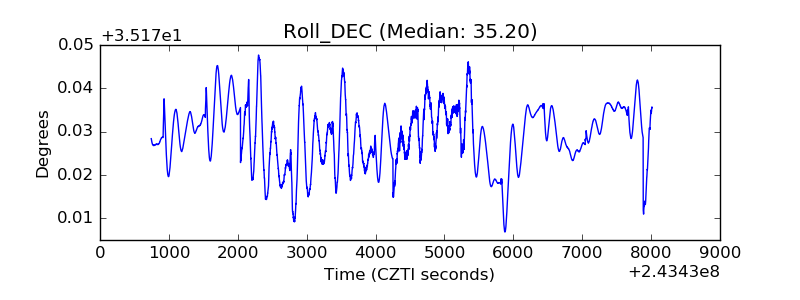 |
| _Roll_RA | 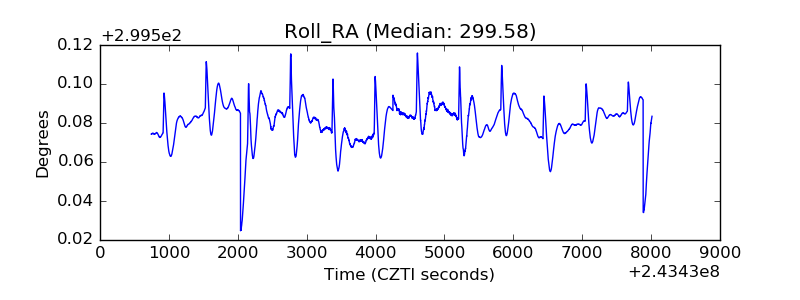 |
| Veto Counter | 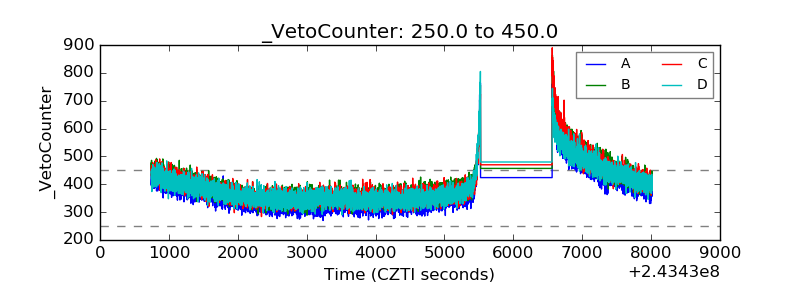 |