| Param | Original file | Final file |
|---|---|---|
| Filename | modeM0/AS1A03_097T01_9000001540_10679cztM0_level2.evt | modeM0/AS1A03_097T01_9000001540_10679cztM0_level2_quad_clean.evt |
| Size (bytes) | 634,236,480 | 92,600,640 |
| Size | 604.9 MB | 88.3 MB |
| Events in quadrant A | 7,299,960 | 507,582 |
| Events in quadrant B | 4,633,818 | 627,260 |
| Events in quadrant C | 2,857,295 | 636,328 |
| Events in quadrant D | 3,998,965 | 601,554 |
| Mode M9 | |||
|---|---|---|---|
| Quadrant | BADHDUFLAG | Total packets | Discarded packets |
| A | 0 | 11 | 0 |
| B | 0 | 11 | 0 |
| C | 0 | 11 | 0 |
| D | 0 | 11 | 0 |
| Mode M0 | |||
|---|---|---|---|
| Quadrant | BADHDUFLAG | Total packets | Discarded packets |
| A | 0 | 25961 | 2 |
| B | 0 | 17941 | 1 |
| C | 0 | 12718 | 1 |
| D | 0 | 16129 | 1 |
| Mode SS | |||
|---|---|---|---|
| Quadrant | BADHDUFLAG | Total packets | Discarded packets |
| A | 0 | 126 | 0 |
| B | 0 | 126 | 0 |
| C | 0 | 126 | 0 |
| D | 0 | 126 | 0 |
| Quadrant | Total seconds | Saturated seconds | Saturation percentage |
|---|---|---|---|
| A | 6166 | 2055 | 33.327927% |
| B | 6166 | 462 | 7.492702% |
| C | 6166 | 69 | 1.119040% |
| D | 6166 | 153 | 2.481349% |
Noise dominated data is calculated using 1-second bins in cleaned event files. If a bin has >2000 counts, and if more than 50% of those come from <1% of pixels, then it is considered to be noise-dominated and hence unusable.
| Quadrant | # 1 sec bins | Bins with >0 counts | Bins with >2000 counts | High rate bins dominated by noise | Noise dominated (total time) | Noise dominated (detector-on time) | Marked lightcurve |
|---|---|---|---|---|---|---|---|
| A | 7286 | 6166 | 1945 | 1945 | 26.70% | 31.54% | 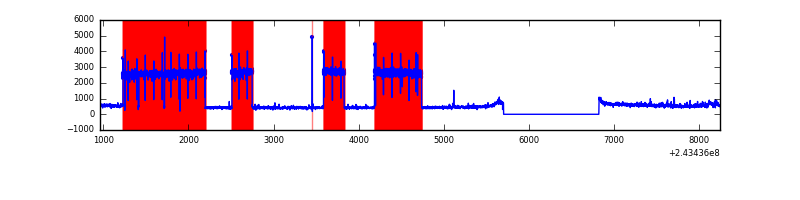 |
| B | 7286 | 6166 | 263 | 263 | 3.61% | 4.27% | 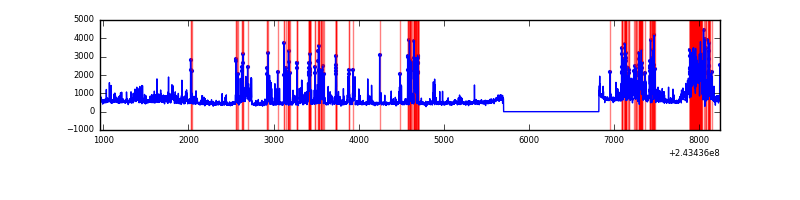 |
| C | 7286 | 6166 | 0 | 0 | 0.00% | 0.00% |  |
| D | 7286 | 6166 | 58 | 58 | 0.80% | 0.94% |  |
Top three noisy pixels from each quadrant. If the there are fewer than three noisy pixels in the level2.evt file, extra rows are filled as -1
| Pixel properties | Quadrant properties | ||||||
|---|---|---|---|---|---|---|---|
| Quadrant | DetID | PixID | Counts | Sigma | Mean | Median | Sigma |
| A | 15 | 239 | 4795214 | 37975.36 | 624 | 610 | 126.3 |
| A | 13 | 251 | 27467 | 212.72 | 624 | 610 | 126.3 |
| A | 1 | 162 | 24540 | 189.54 | 624 | 610 | 126.3 |
| B | 4 | 239 | 1376822 | 9995.74 | 730 | 713 | 137.7 |
| B | 0 | 85 | 148028 | 1070.06 | 730 | 713 | 137.7 |
| B | 4 | 81 | 104749 | 755.69 | 730 | 713 | 137.7 |
| C | 14 | 234 | 8154 | 43.93 | 728 | 732 | 168.9 |
| C | 13 | 61 | 5423 | 27.77 | 728 | 732 | 168.9 |
| C | 14 | 67 | 5075 | 25.71 | 728 | 732 | 168.9 |
| D | 2 | 16 | 437046 | 2514.25 | 725 | 706 | 173.5 |
| D | 8 | 195 | 334809 | 1925.14 | 725 | 706 | 173.5 |
| D | 10 | 199 | 181002 | 1038.89 | 725 | 706 | 173.5 |
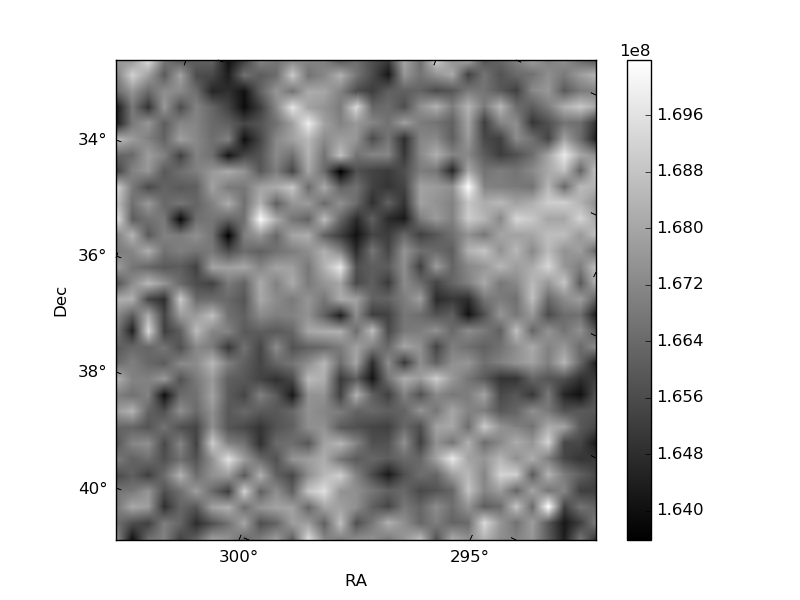
Histogram calculated using DETX and DETY for each event in the final _common_clean file
| Quadrant A | 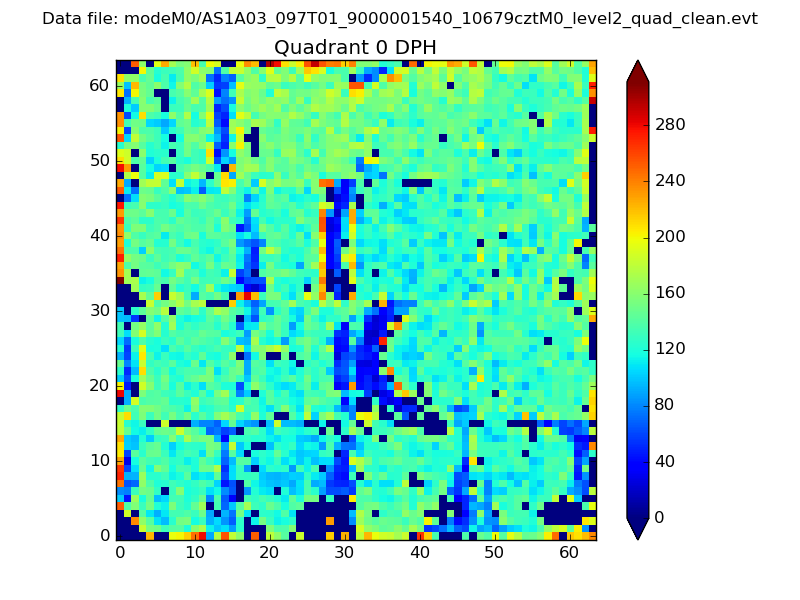 |
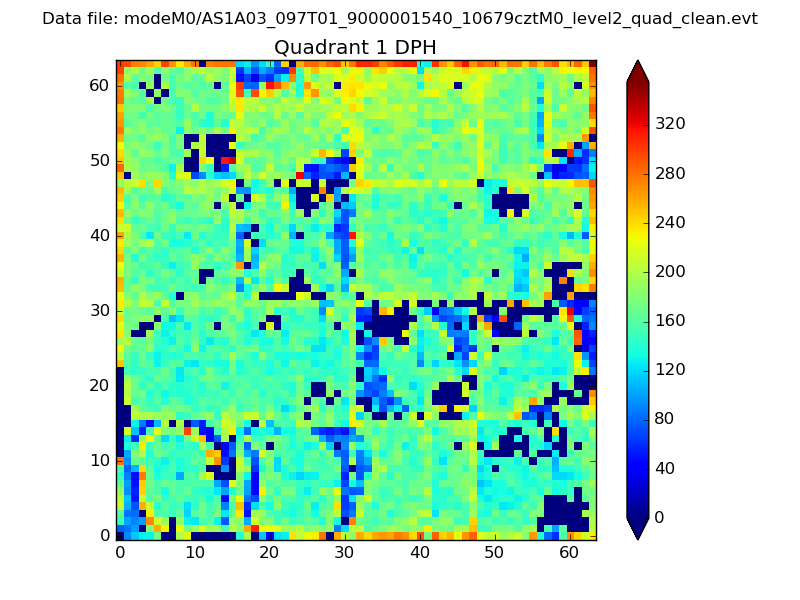 |
Quadrant B |
|---|---|---|---|
| Quadrant D |  |
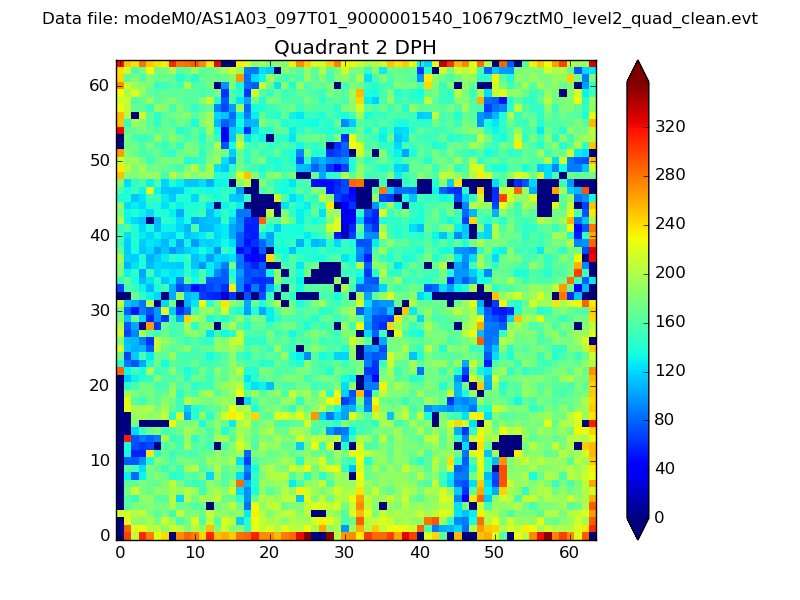 |
Quadrant C |
| Plot type | Count rate plots | Images |
|---|---|---|
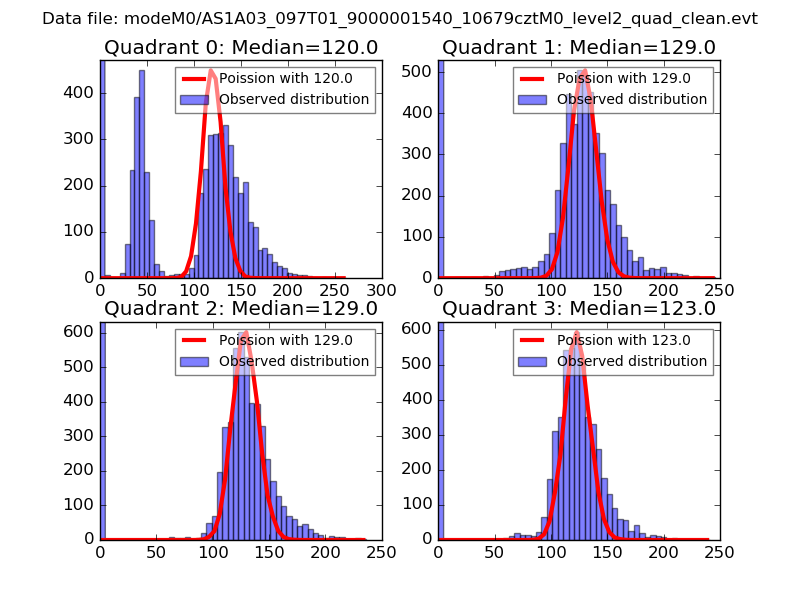
| Comparison with Poisson distribution Blue bars denote a histogram of data divided into 1 sec bins. Red curve is a Poisson curve with rate = median count rate of data. |
 |
 |
| Quadrant-wise count rates Data is divided into 100 sec bins |
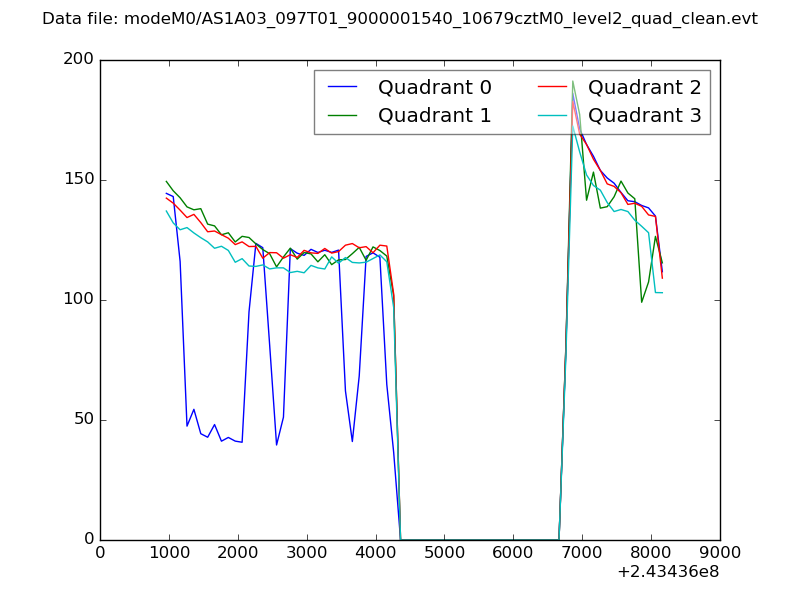 |
|
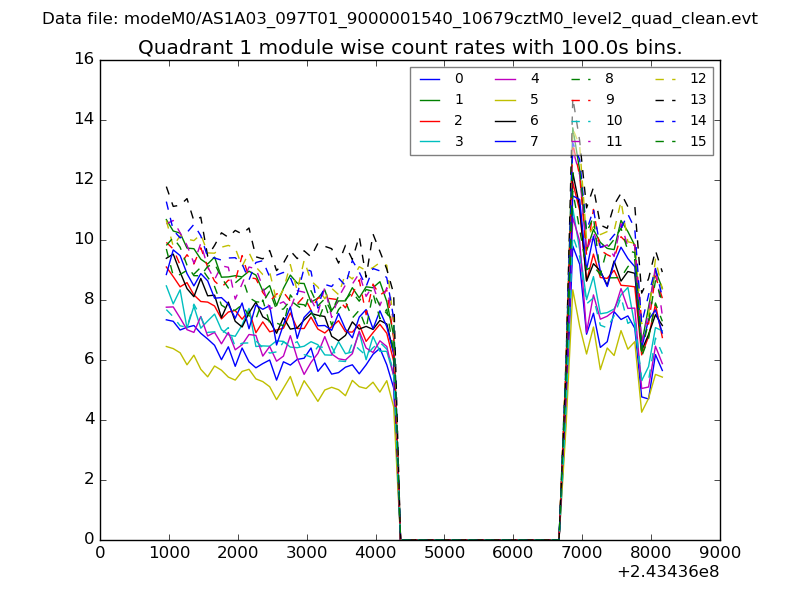
| Module-wise count rates for Quadrant A Data is divided into 100 sec bins |
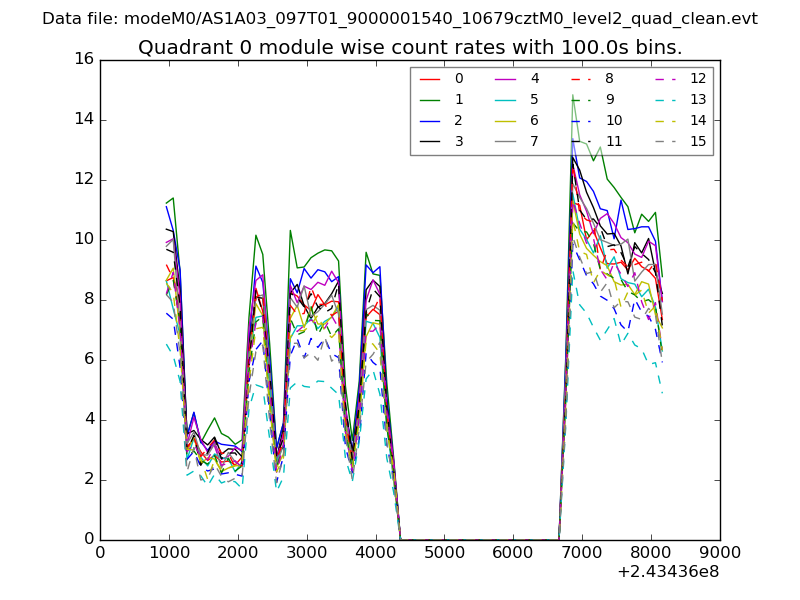 |
 |
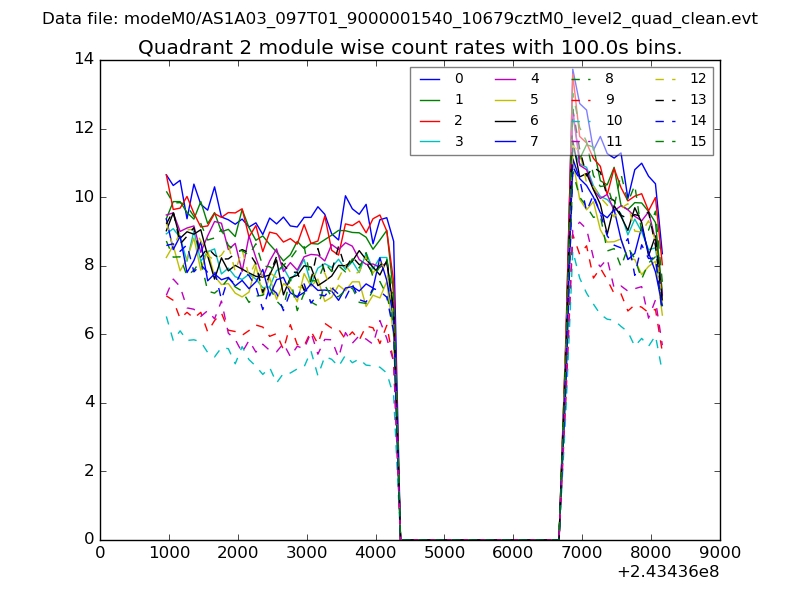
| Module-wise count rates for Quadrant B Data is divided into 100 sec bins |
 |
 |
| Module-wise count rates for Quadrant C Data is divided into 100 sec bins |
 |
 |
| Module-wise count rates for Quadrant D Data is divided into 100 sec bins |
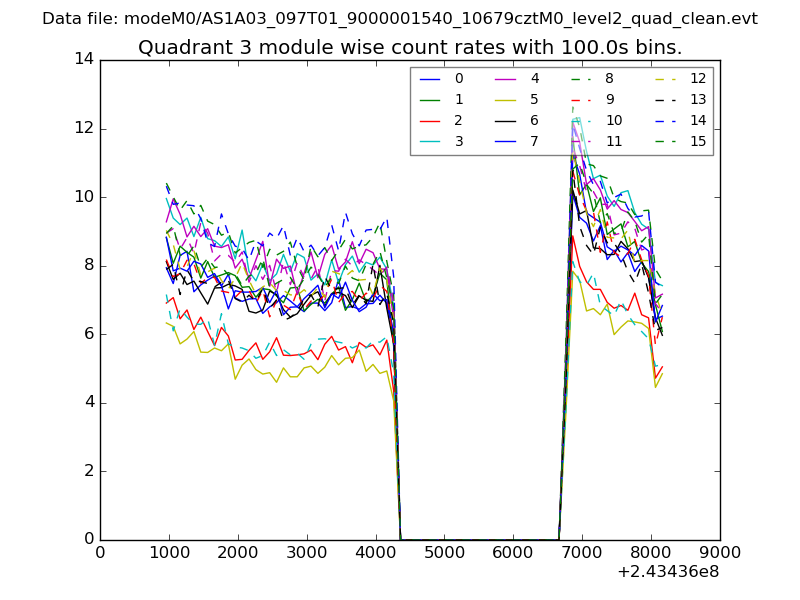 |
 |
| Parameter | Plot |
|---|---|
| CZT HV Monitor | 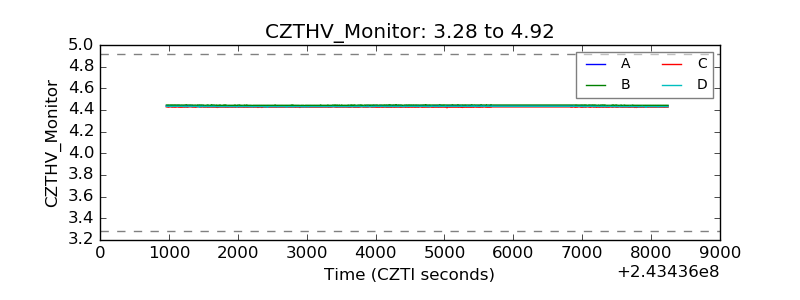 |
| D_VDD | 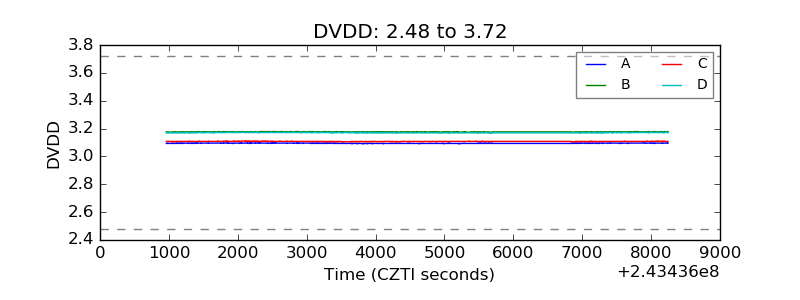 |
| Temperature 1 | 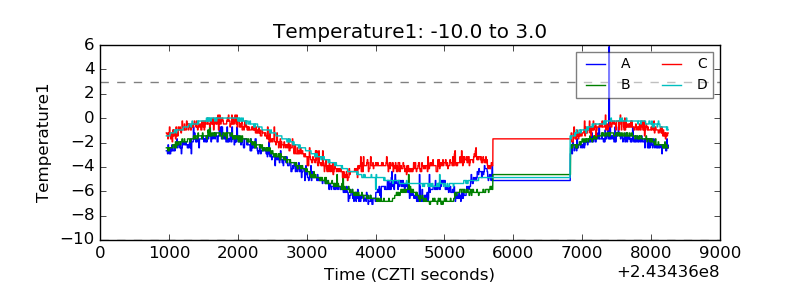 |
| Veto HV Monitor | 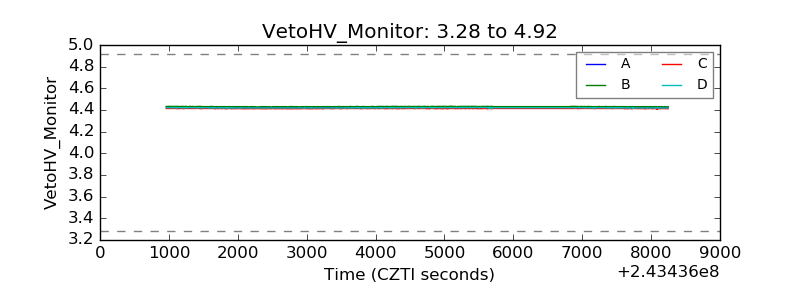 |
| Veto LLD | 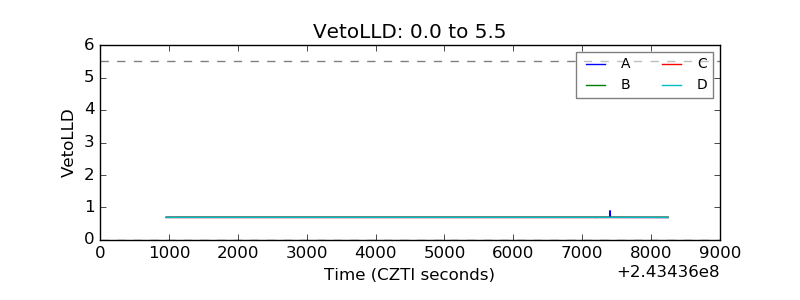 |
| Alpha Counter | 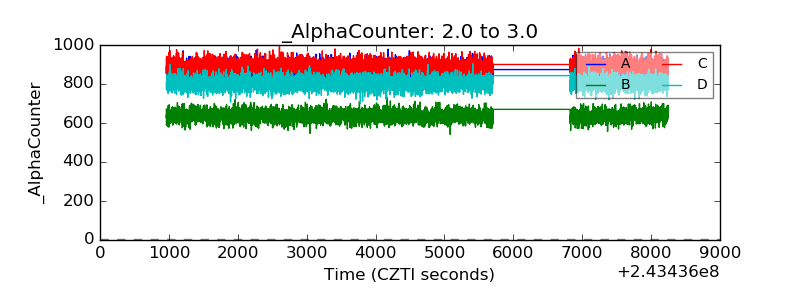 |
| _CPM_Rate | 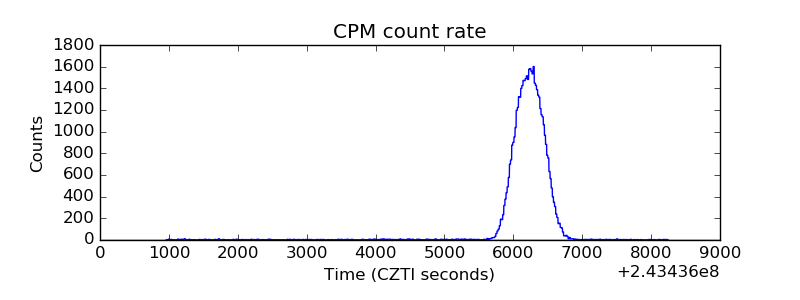 |
| CZT Counter | 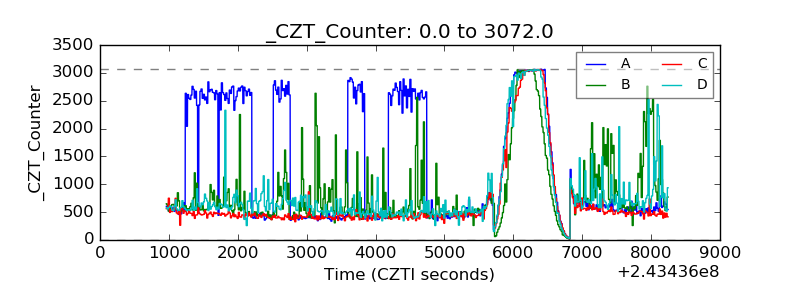 |
| +2.5 Volts monitor |  |
| +5 Volts monitor |  |
| _ROLL_ROT | 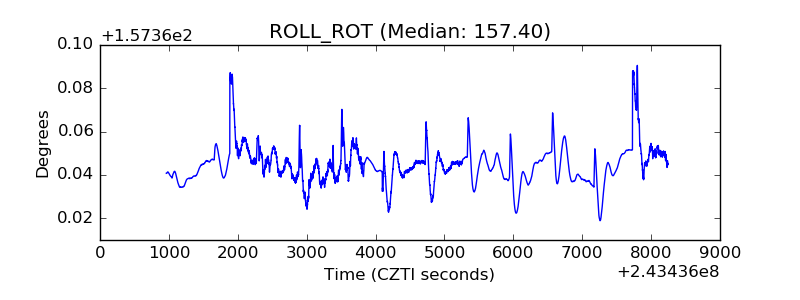 |
| _Roll_DEC | 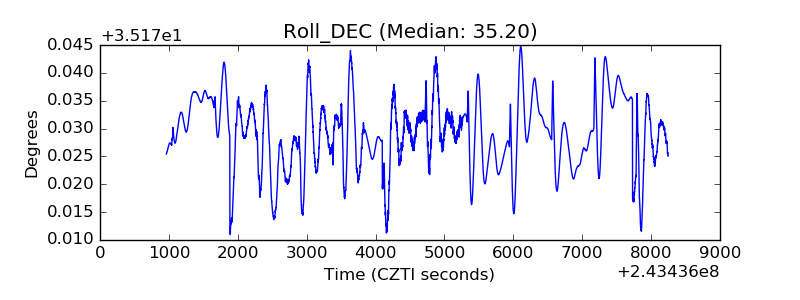 |
| _Roll_RA | 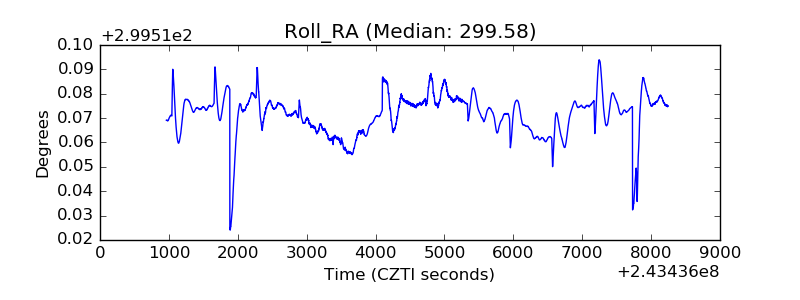 |
| Veto Counter | 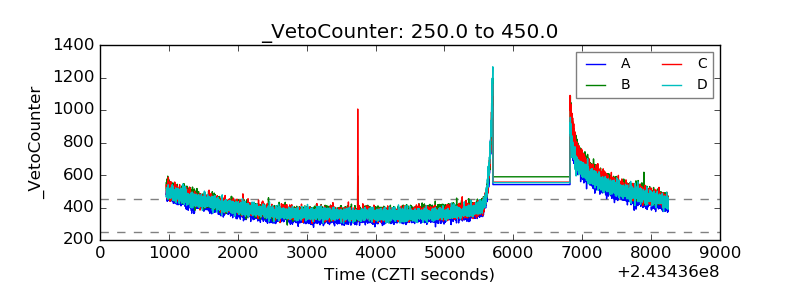 |