| Param | Original file | Final file |
|---|---|---|
| Filename | modeM0/AS1A03_097T01_9000001540_10680cztM0_level2.evt | modeM0/AS1A03_097T01_9000001540_10680cztM0_level2_quad_clean.evt |
| Size (bytes) | 536,198,400 | 87,534,720 |
| Size | 511.4 MB | 83.5 MB |
| Events in quadrant A | 3,517,016 | 568,049 |
| Events in quadrant B | 5,158,190 | 552,781 |
| Events in quadrant C | 2,754,373 | 581,453 |
| Events in quadrant D | 4,414,182 | 540,878 |
| Mode M9 | |||
|---|---|---|---|
| Quadrant | BADHDUFLAG | Total packets | Discarded packets |
| A | 0 | 13 | 0 |
| B | 0 | 13 | 0 |
| C | 0 | 13 | 0 |
| D | 0 | 13 | 0 |
| Mode M0 | |||
|---|---|---|---|
| Quadrant | BADHDUFLAG | Total packets | Discarded packets |
| A | 0 | 14232 | 2 |
| B | 0 | 19259 | 1 |
| C | 0 | 12100 | 1 |
| D | 0 | 17252 | 1 |
| Mode SS | |||
|---|---|---|---|
| Quadrant | BADHDUFLAG | Total packets | Discarded packets |
| A | 0 | 118 | 0 |
| B | 0 | 118 | 0 |
| C | 0 | 118 | 0 |
| D | 0 | 118 | 0 |
| Quadrant | Total seconds | Saturated seconds | Saturation percentage |
|---|---|---|---|
| A | 5831 | 226 | 3.875836% |
| B | 5831 | 664 | 11.387412% |
| C | 5831 | 38 | 0.651689% |
| D | 5831 | 150 | 2.572458% |
Noise dominated data is calculated using 1-second bins in cleaned event files. If a bin has >2000 counts, and if more than 50% of those come from <1% of pixels, then it is considered to be noise-dominated and hence unusable.
| Quadrant | # 1 sec bins | Bins with >0 counts | Bins with >2000 counts | High rate bins dominated by noise | Noise dominated (total time) | Noise dominated (detector-on time) | Marked lightcurve |
|---|---|---|---|---|---|---|---|
| A | 7111 | 5831 | 206 | 206 | 2.90% | 3.53% | 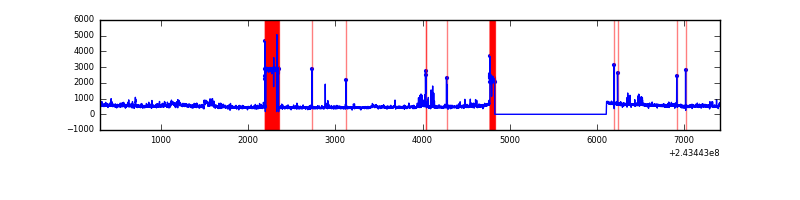 |
| B | 7111 | 5832 | 449 | 449 | 6.31% | 7.70% | 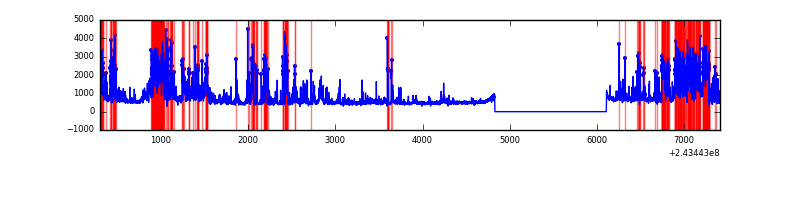 |
| C | 7111 | 5832 | 4 | 4 | 0.06% | 0.07% | 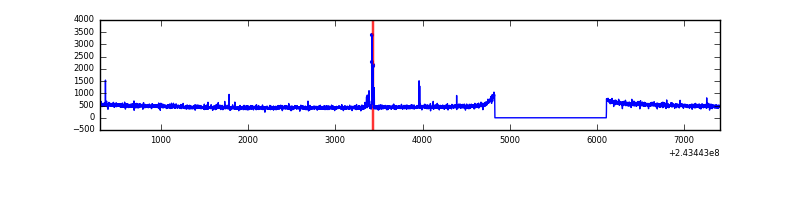 |
| D | 7111 | 5832 | 92 | 92 | 1.29% | 1.58% | 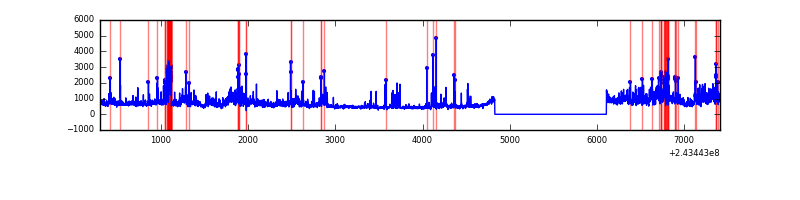 |
Top three noisy pixels from each quadrant. If the there are fewer than three noisy pixels in the level2.evt file, extra rows are filled as -1
| Pixel properties | Quadrant properties | ||||||
|---|---|---|---|---|---|---|---|
| Quadrant | DetID | PixID | Counts | Sigma | Mean | Median | Sigma |
| A | 15 | 239 | 545894 | 3911.58 | 692 | 678 | 139.4 |
| A | 13 | 251 | 104041 | 741.56 | 692 | 678 | 139.4 |
| A | 0 | 167 | 60070 | 426.1 | 692 | 678 | 139.4 |
| B | 4 | 239 | 1939376 | 15174.92 | 686 | 671 | 127.8 |
| B | 4 | 81 | 222192 | 1733.92 | 686 | 671 | 127.8 |
| B | 0 | 85 | 172891 | 1348.03 | 686 | 671 | 127.8 |
| C | 9 | 236 | 36161 | 224.39 | 694 | 700 | 158.0 |
| C | 14 | 234 | 5302 | 29.12 | 694 | 700 | 158.0 |
| C | 13 | 61 | 5280 | 28.98 | 694 | 700 | 158.0 |
| D | 2 | 16 | 797904 | 4905.4 | 687 | 670 | 162.5 |
| D | 10 | 199 | 243842 | 1496.24 | 687 | 670 | 162.5 |
| D | 8 | 195 | 226295 | 1388.28 | 687 | 670 | 162.5 |
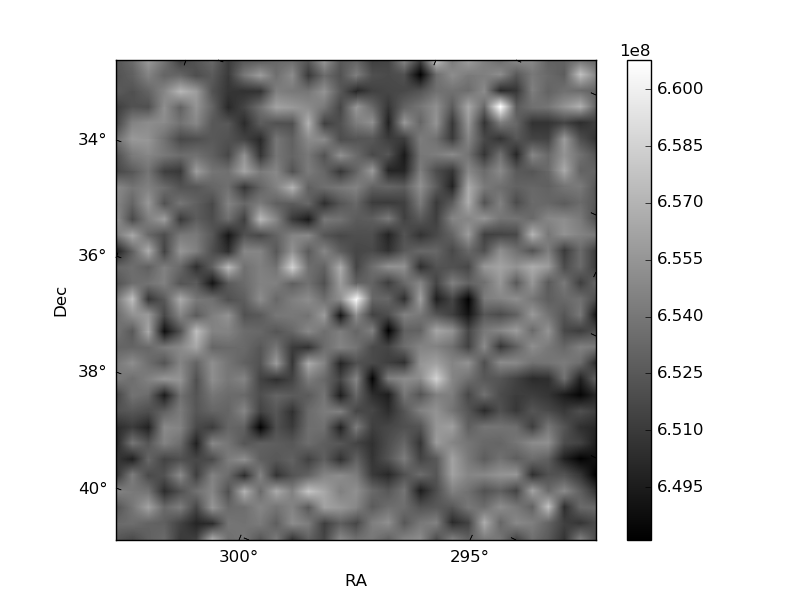
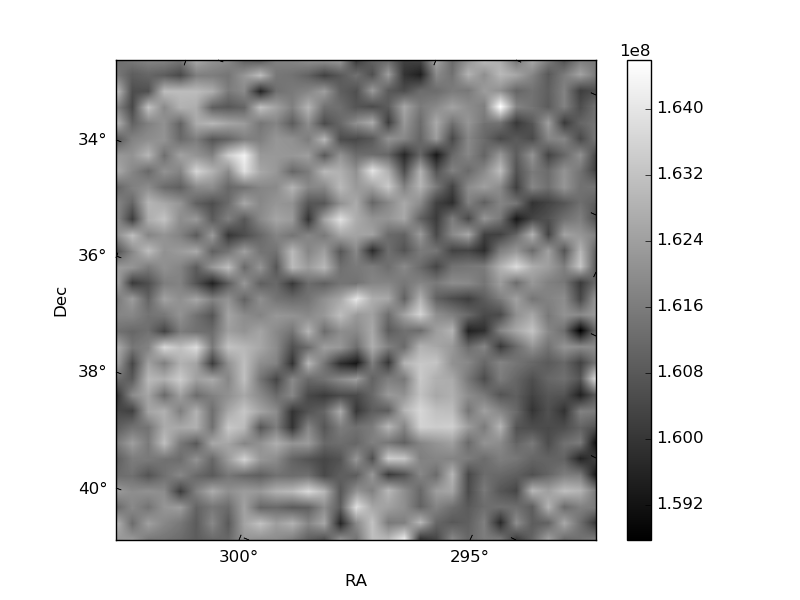
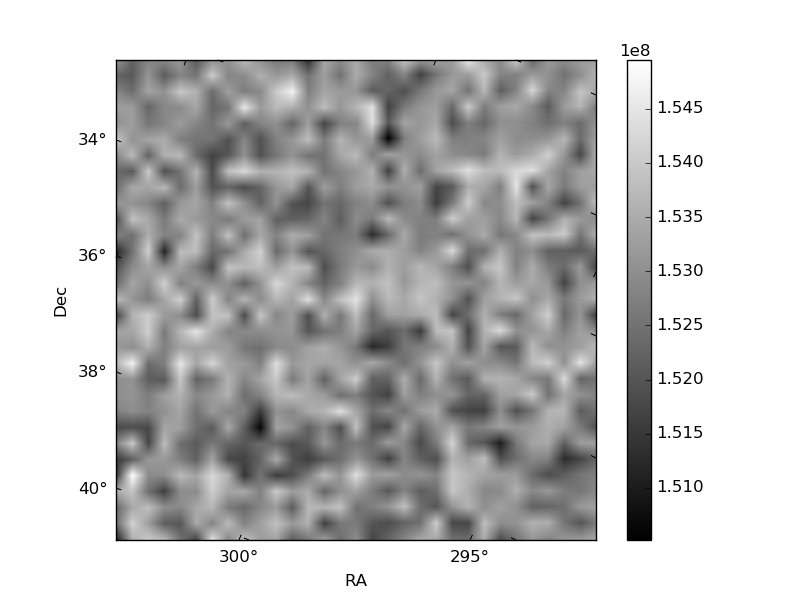
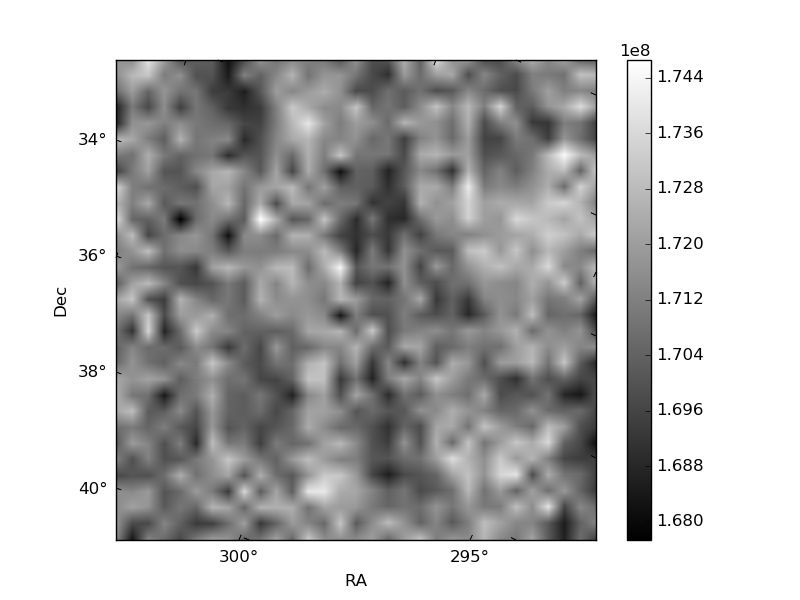
Histogram calculated using DETX and DETY for each event in the final _common_clean file
| Quadrant A | 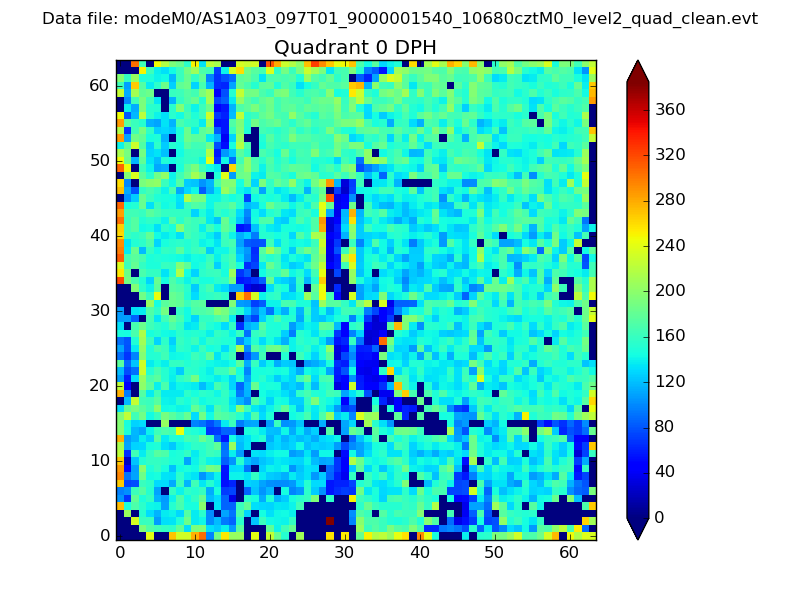 |
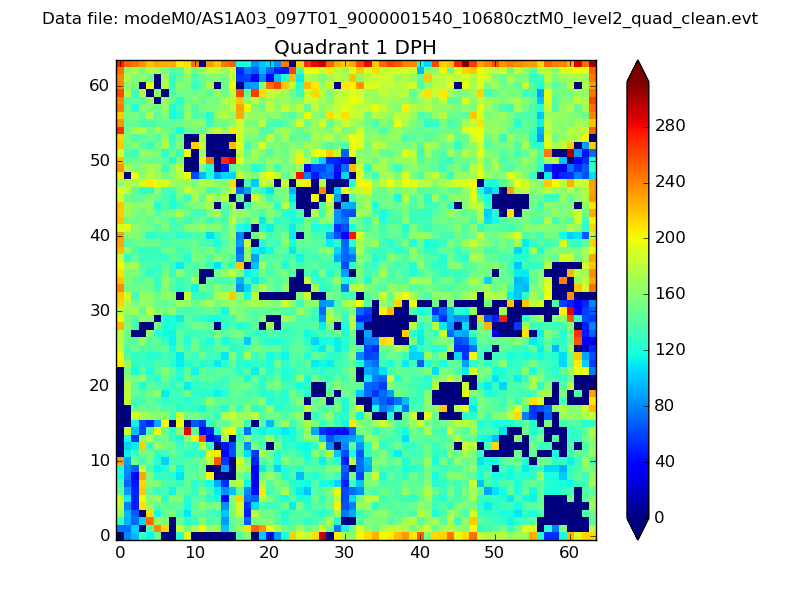 |
Quadrant B |
|---|---|---|---|
| Quadrant D | 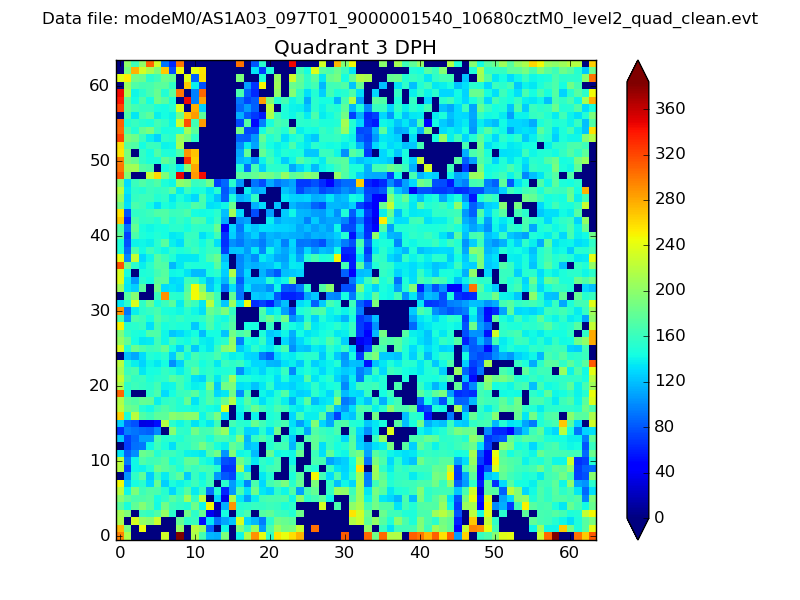 |
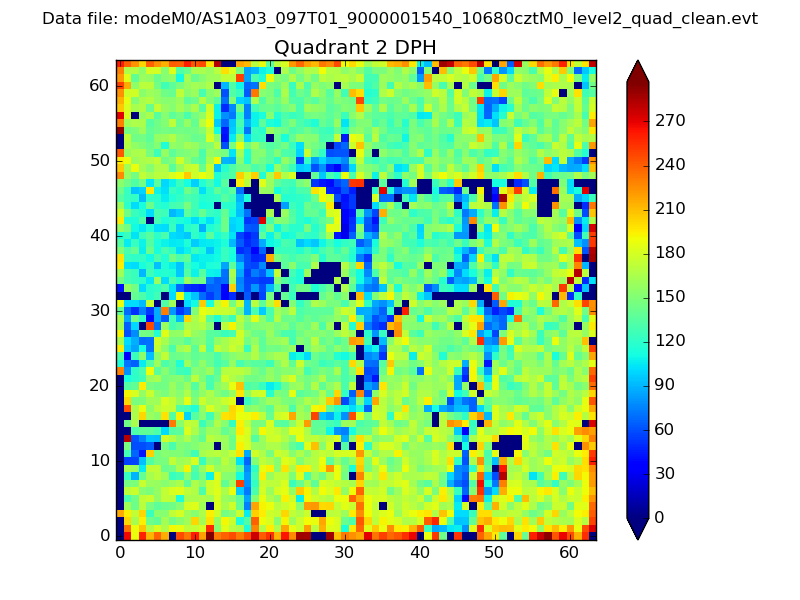 |
Quadrant C |
| Plot type | Count rate plots | Images |
|---|---|---|
| Comparison with Poisson distribution Blue bars denote a histogram of data divided into 1 sec bins. Red curve is a Poisson curve with rate = median count rate of data. |
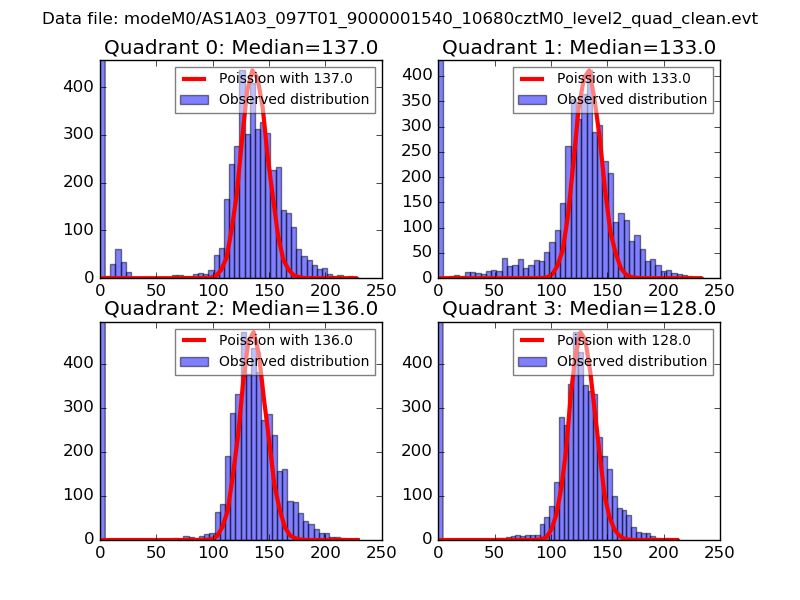 |
 |
| Quadrant-wise count rates Data is divided into 100 sec bins |
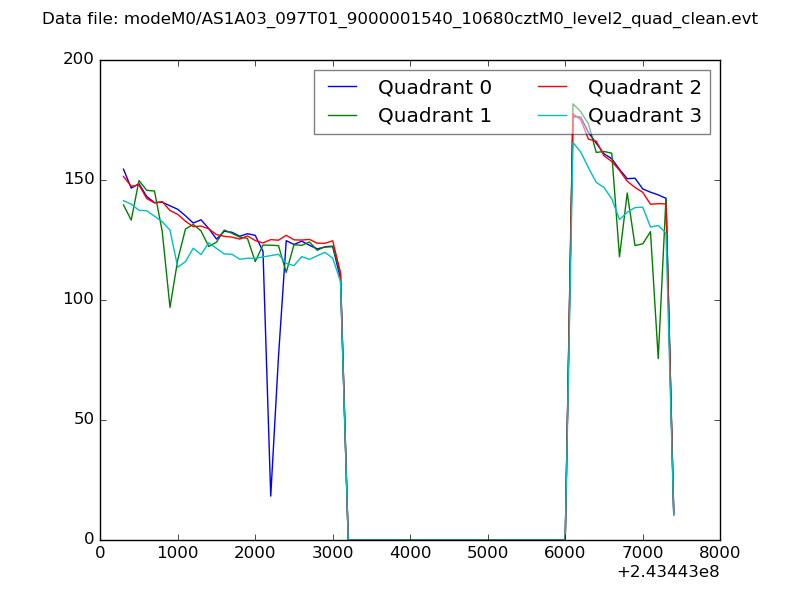 |
|
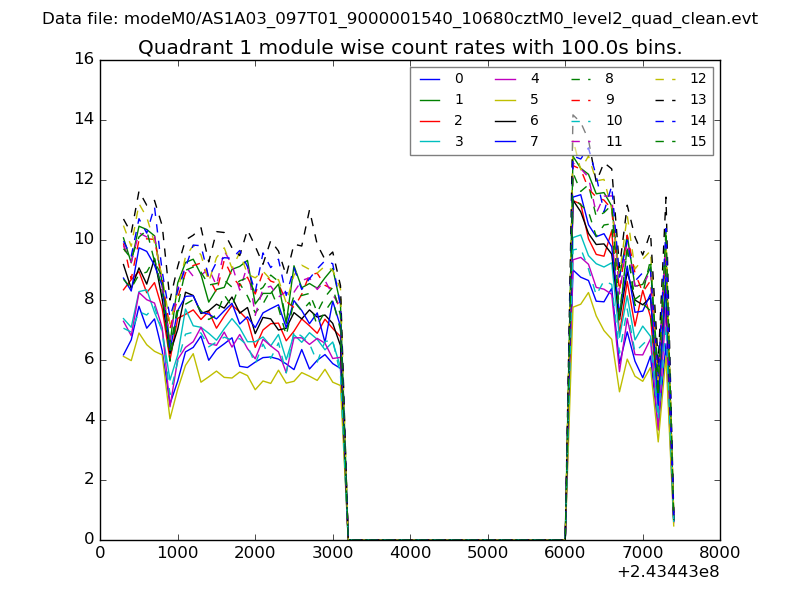
| Module-wise count rates for Quadrant A Data is divided into 100 sec bins |
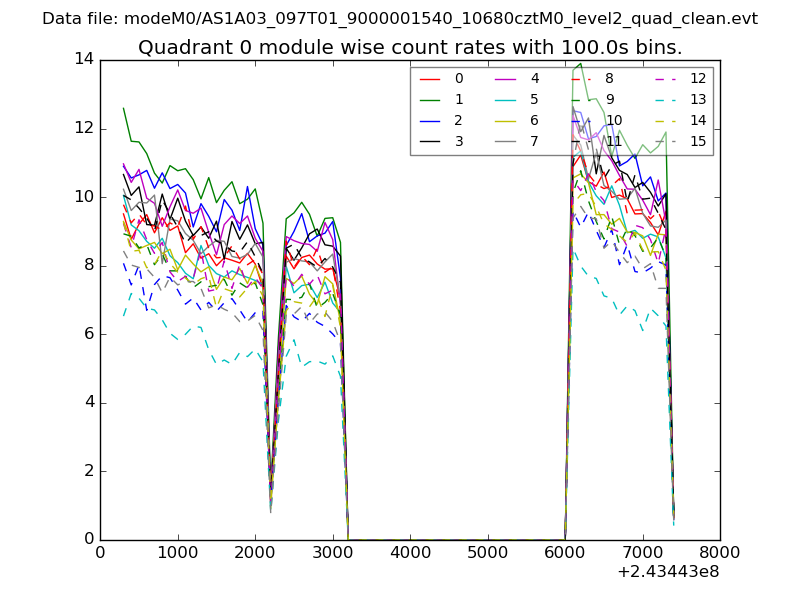 |
 |
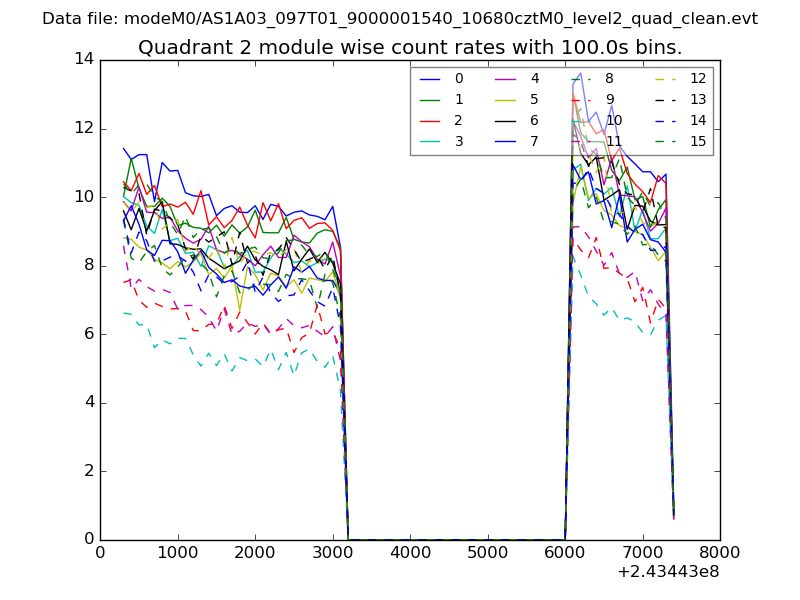
| Module-wise count rates for Quadrant B Data is divided into 100 sec bins |
 |
 |
| Module-wise count rates for Quadrant C Data is divided into 100 sec bins |
 |
 |
| Module-wise count rates for Quadrant D Data is divided into 100 sec bins |
 |
 |
| Parameter | Plot |
|---|---|
| CZT HV Monitor | 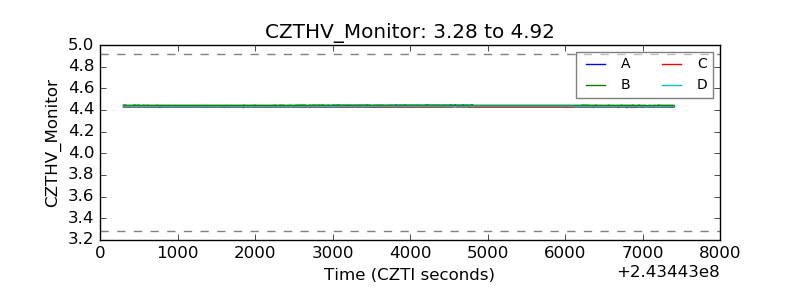 |
| D_VDD | 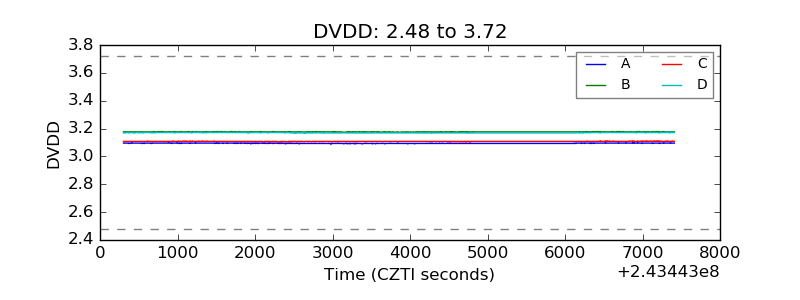 |
| Temperature 1 | 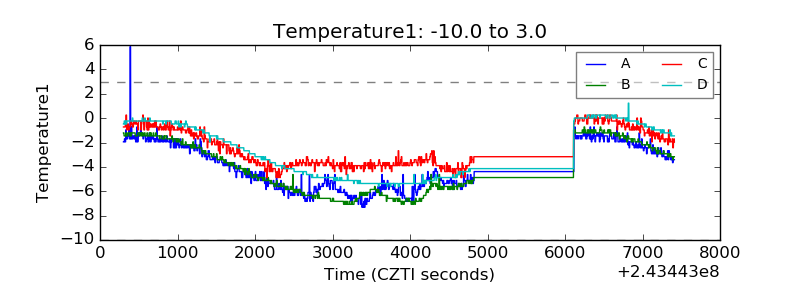 |
| Veto HV Monitor | 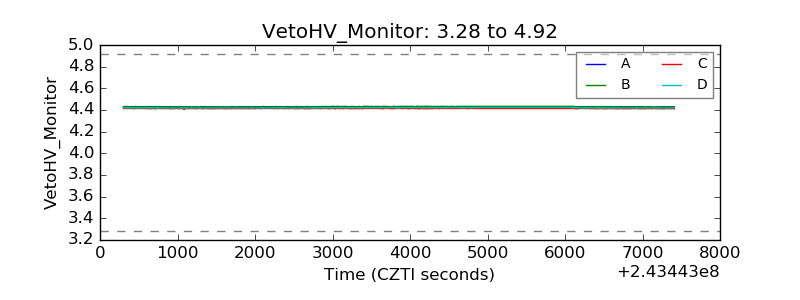 |
| Veto LLD | 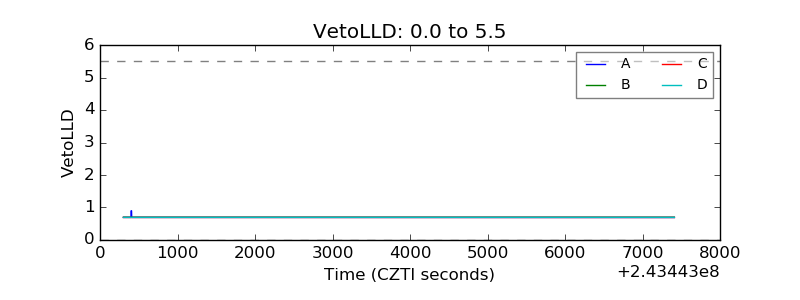 |
| Alpha Counter | 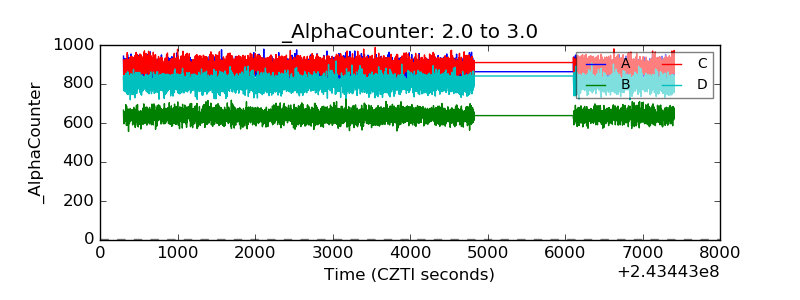 |
| _CPM_Rate | 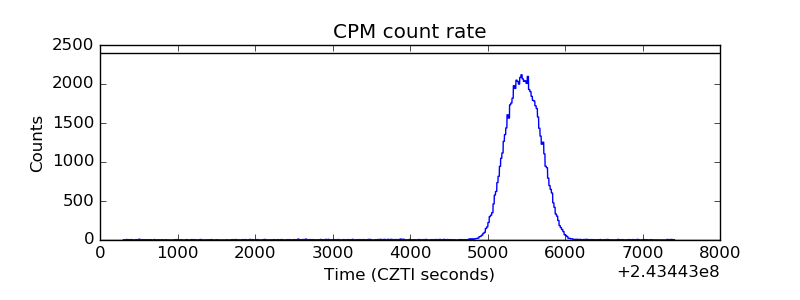 |
| CZT Counter | 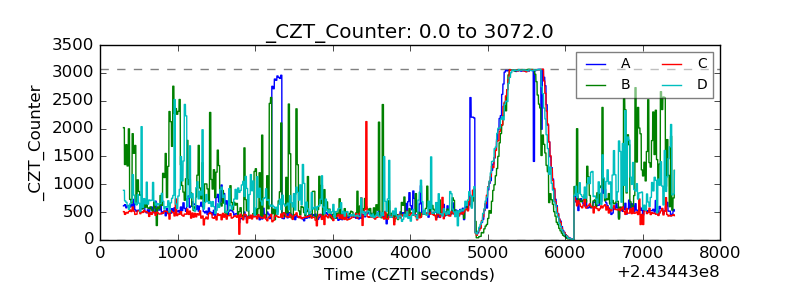 |
| +2.5 Volts monitor |  |
| +5 Volts monitor | 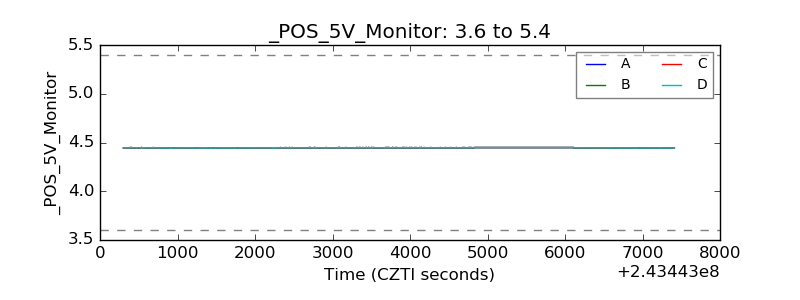 |
| _ROLL_ROT |  |
| _Roll_DEC |  |
| _Roll_RA | 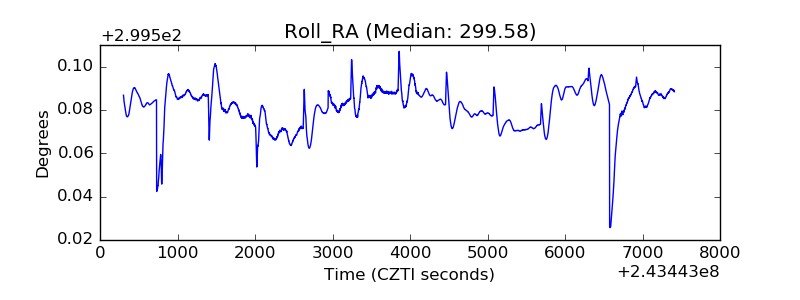 |
| Veto Counter | 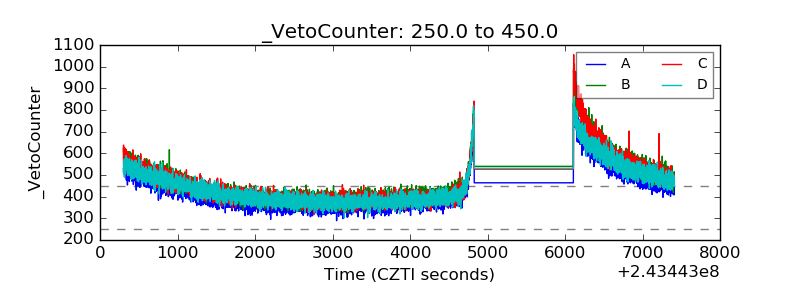 |