| Param | Original file | Final file |
|---|---|---|
| Filename | modeM0/AS1A03_097T01_9000001540_10681cztM0_level2.evt | modeM0/AS1A03_097T01_9000001540_10681cztM0_level2_quad_clean.evt |
| Size (bytes) | 573,324,480 | 90,054,720 |
| Size | 546.8 MB | 85.9 MB |
| Events in quadrant A | 3,709,739 | 581,161 |
| Events in quadrant B | 5,469,742 | 569,509 |
| Events in quadrant C | 2,955,629 | 598,527 |
| Events in quadrant D | 4,814,726 | 551,160 |
| Mode M9 | |||
|---|---|---|---|
| Quadrant | BADHDUFLAG | Total packets | Discarded packets |
| A | 0 | 13 | 0 |
| B | 0 | 13 | 0 |
| C | 0 | 13 | 0 |
| D | 0 | 13 | 0 |
| Mode M0 | |||
|---|---|---|---|
| Quadrant | BADHDUFLAG | Total packets | Discarded packets |
| A | 0 | 15045 | 2 |
| B | 0 | 20406 | 1 |
| C | 0 | 12762 | 1 |
| D | 0 | 18402 | 1 |
| Mode SS | |||
|---|---|---|---|
| Quadrant | BADHDUFLAG | Total packets | Discarded packets |
| A | 0 | 124 | 0 |
| B | 0 | 124 | 0 |
| C | 0 | 124 | 0 |
| D | 0 | 124 | 0 |
| Quadrant | Total seconds | Saturated seconds | Saturation percentage |
|---|---|---|---|
| A | 6107 | 241 | 3.946291% |
| B | 6107 | 686 | 11.233011% |
| C | 6107 | 46 | 0.753234% |
| D | 6107 | 195 | 3.193057% |
Noise dominated data is calculated using 1-second bins in cleaned event files. If a bin has >2000 counts, and if more than 50% of those come from <1% of pixels, then it is considered to be noise-dominated and hence unusable.
| Quadrant | # 1 sec bins | Bins with >0 counts | Bins with >2000 counts | High rate bins dominated by noise | Noise dominated (total time) | Noise dominated (detector-on time) | Marked lightcurve |
|---|---|---|---|---|---|---|---|
| A | 7427 | 6108 | 183 | 183 | 2.46% | 3.00% | 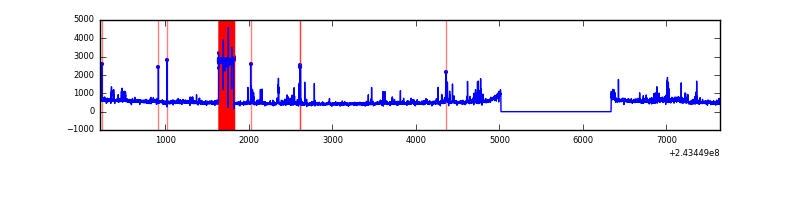 |
| B | 7427 | 6108 | 464 | 464 | 6.25% | 7.60% | 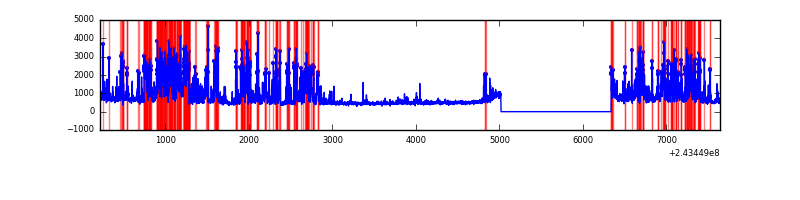 |
| C | 7427 | 6108 | 1 | 1 | 0.01% | 0.02% | 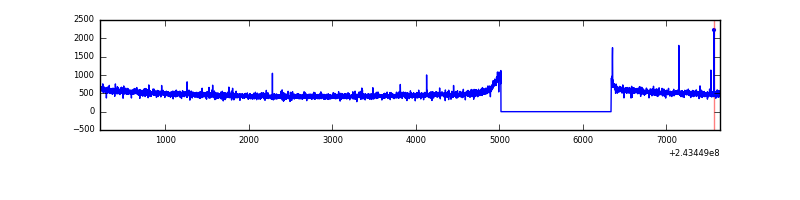 |
| D | 7427 | 6108 | 123 | 123 | 1.66% | 2.01% | 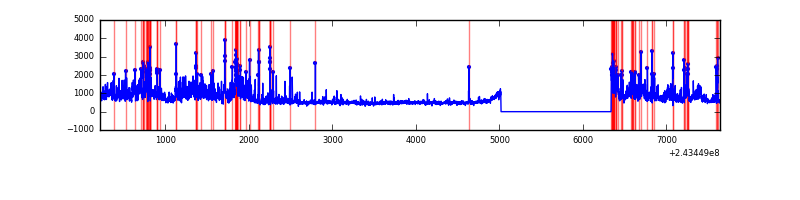 |
Top three noisy pixels from each quadrant. If the there are fewer than three noisy pixels in the level2.evt file, extra rows are filled as -1
| Pixel properties | Quadrant properties | ||||||
|---|---|---|---|---|---|---|---|
| Quadrant | DetID | PixID | Counts | Sigma | Mean | Median | Sigma |
| A | 15 | 239 | 519715 | 3485.72 | 749 | 735 | 148.9 |
| A | 4 | 2 | 124748 | 832.93 | 749 | 735 | 148.9 |
| A | 13 | 251 | 75212 | 500.22 | 749 | 735 | 148.9 |
| B | 4 | 239 | 1684133 | 12214.34 | 741 | 724 | 137.8 |
| B | 0 | 85 | 517041 | 3746.25 | 741 | 724 | 137.8 |
| B | 4 | 81 | 187043 | 1351.88 | 741 | 724 | 137.8 |
| C | 14 | 234 | 10314 | 55.46 | 750 | 756 | 172.4 |
| C | 4 | 175 | 8624 | 45.65 | 750 | 756 | 172.4 |
| C | 13 | 61 | 5665 | 28.48 | 750 | 756 | 172.4 |
| D | 2 | 16 | 936013 | 5305.82 | 738 | 720 | 176.3 |
| D | 8 | 195 | 298695 | 1690.38 | 738 | 720 | 176.3 |
| D | 10 | 199 | 173893 | 982.39 | 738 | 720 | 176.3 |
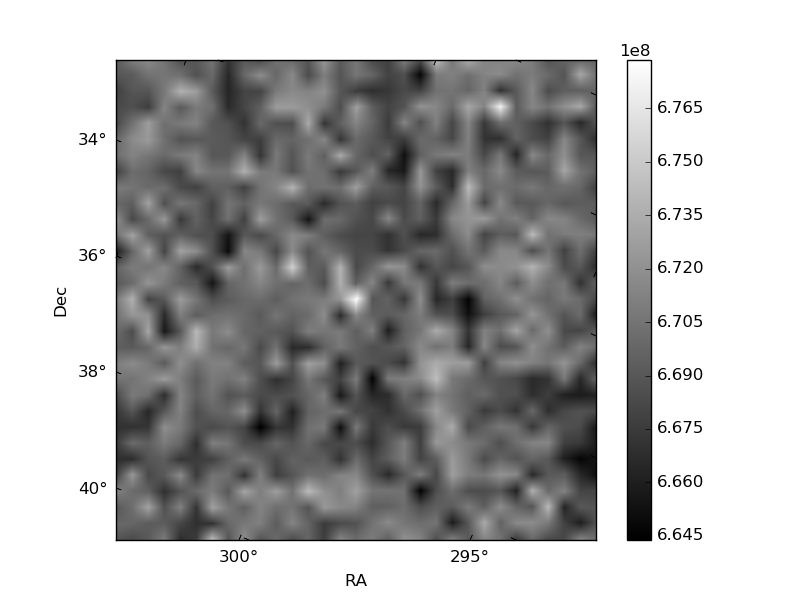
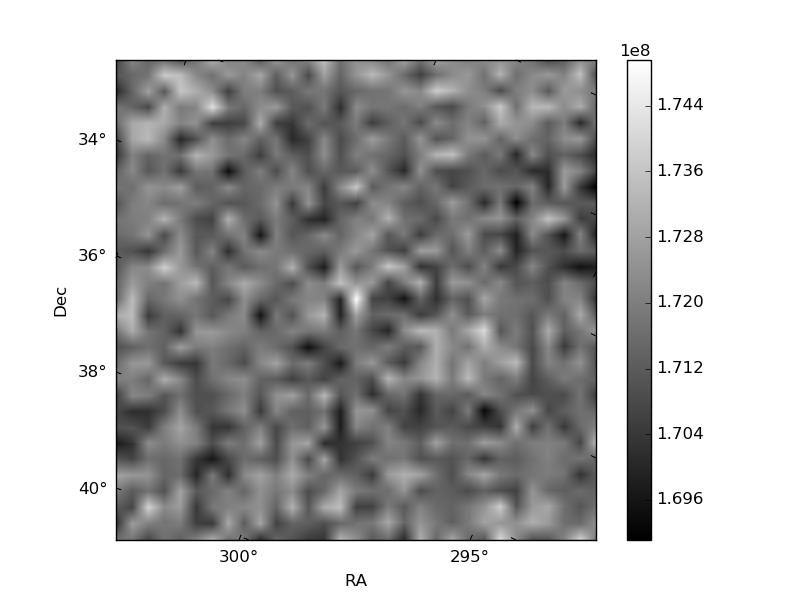
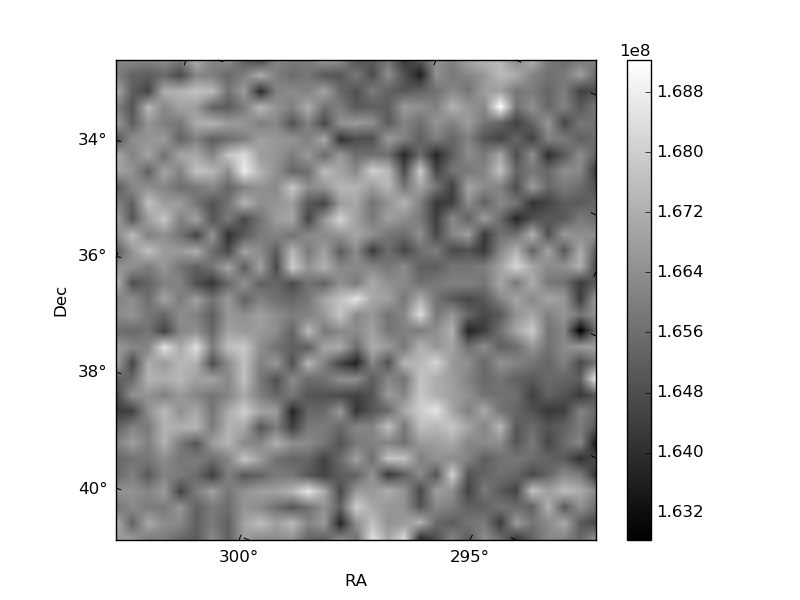
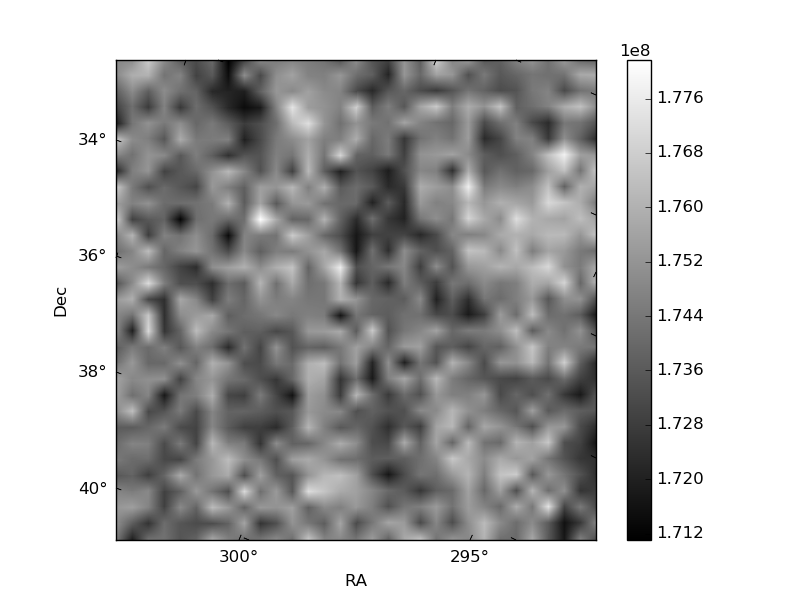
Histogram calculated using DETX and DETY for each event in the final _common_clean file
| Quadrant A | 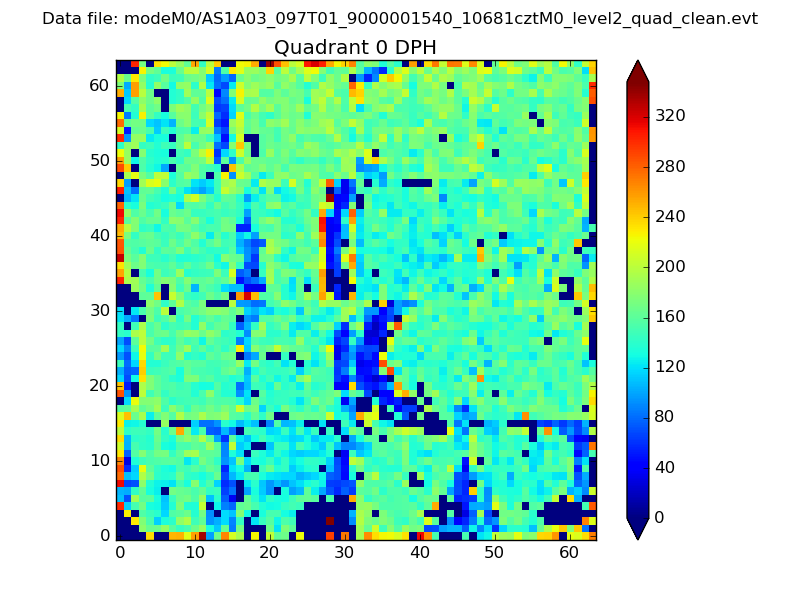 |
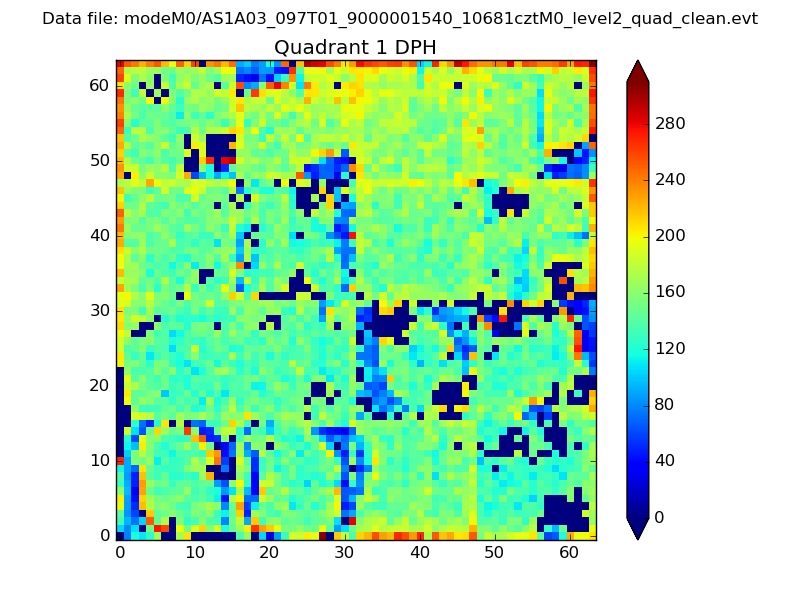 |
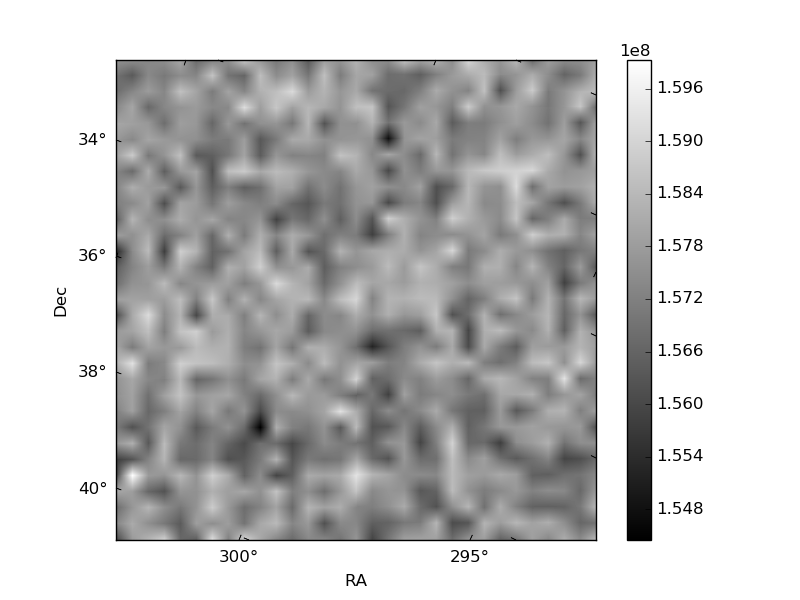
Quadrant B |
|---|---|---|---|
| Quadrant D |  |
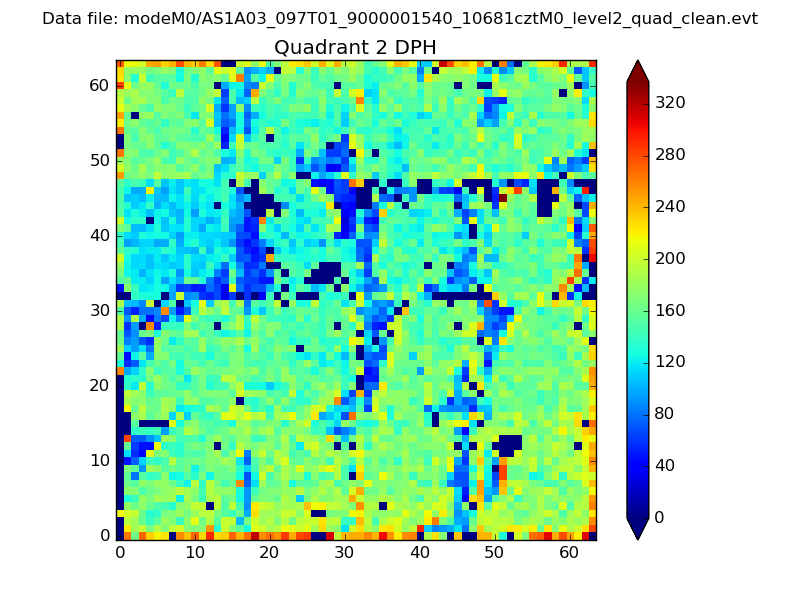 |
Quadrant C |
| Plot type | Count rate plots | Images |
|---|---|---|
| Comparison with Poisson distribution Blue bars denote a histogram of data divided into 1 sec bins. Red curve is a Poisson curve with rate = median count rate of data. |
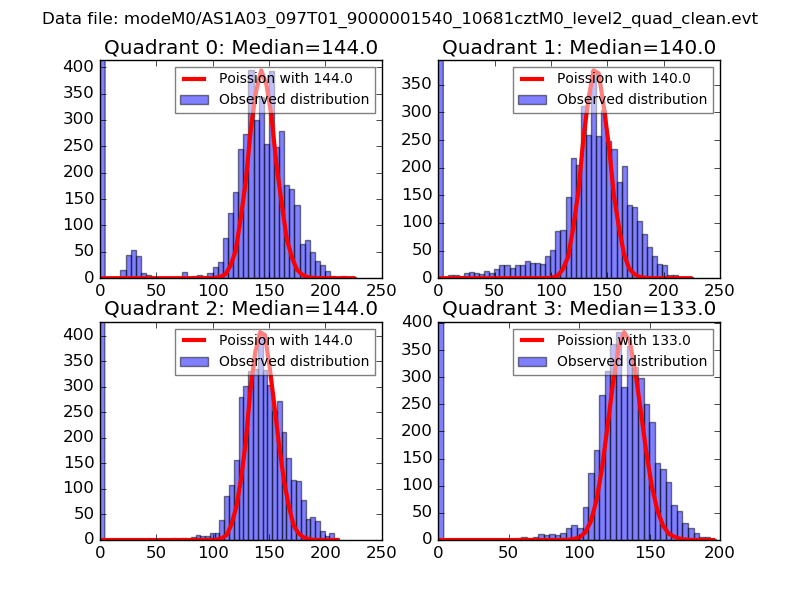 |
 |
| Quadrant-wise count rates Data is divided into 100 sec bins |
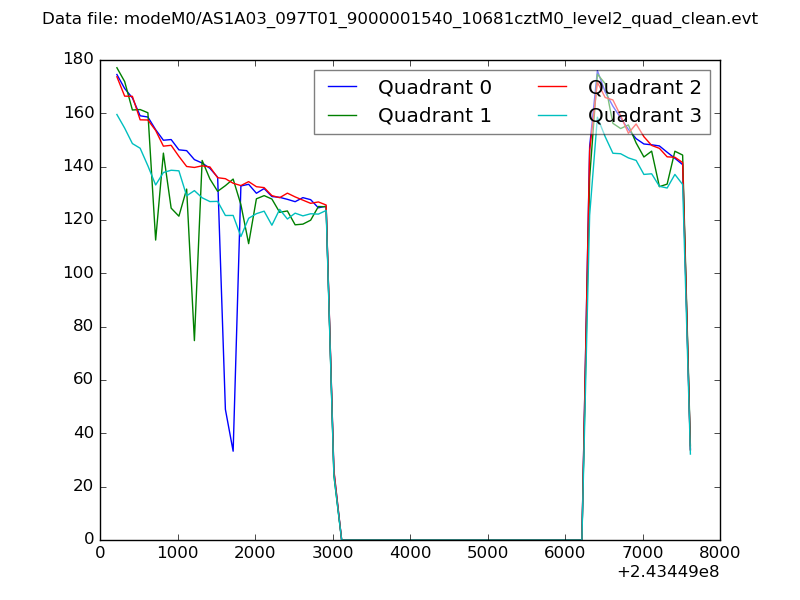 |
|
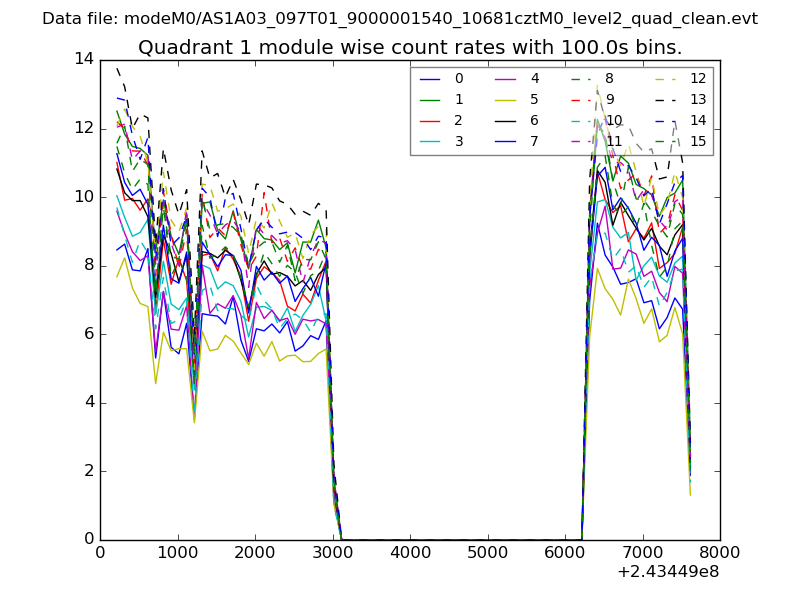
| Module-wise count rates for Quadrant A Data is divided into 100 sec bins |
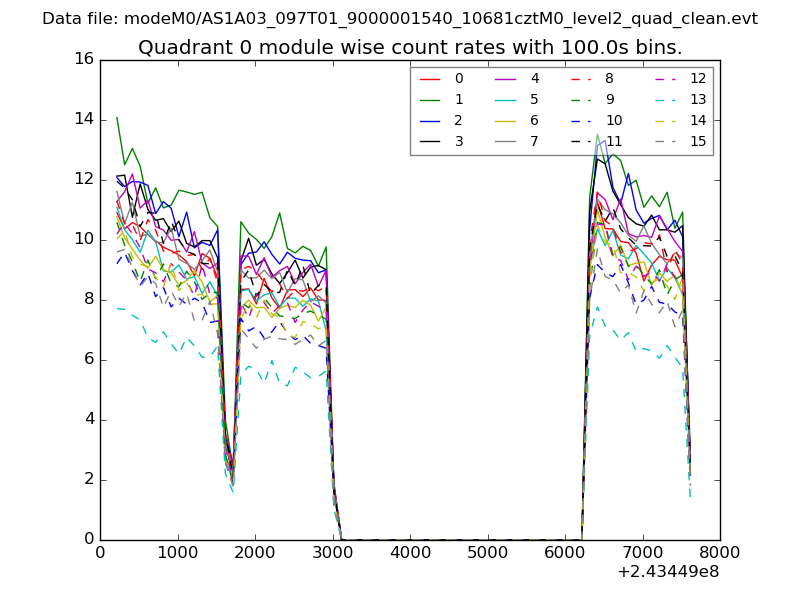 |
 |
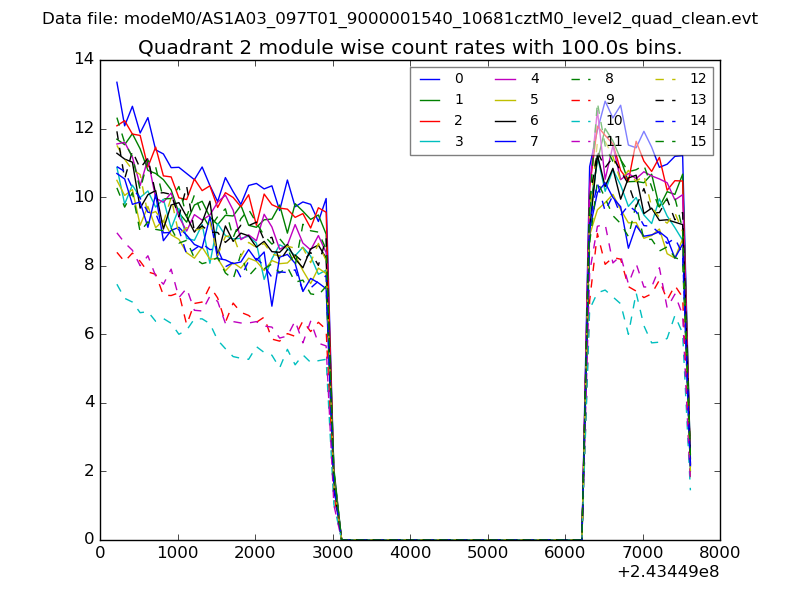
| Module-wise count rates for Quadrant B Data is divided into 100 sec bins |
 |
 |
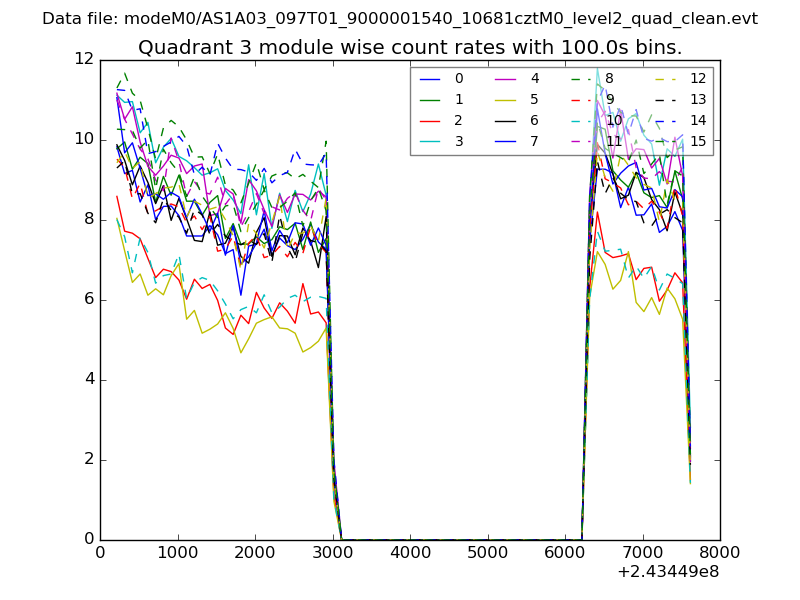
| Module-wise count rates for Quadrant C Data is divided into 100 sec bins |
 |
 |
| Module-wise count rates for Quadrant D Data is divided into 100 sec bins |
 |
 |
| Parameter | Plot |
|---|---|
| CZT HV Monitor | 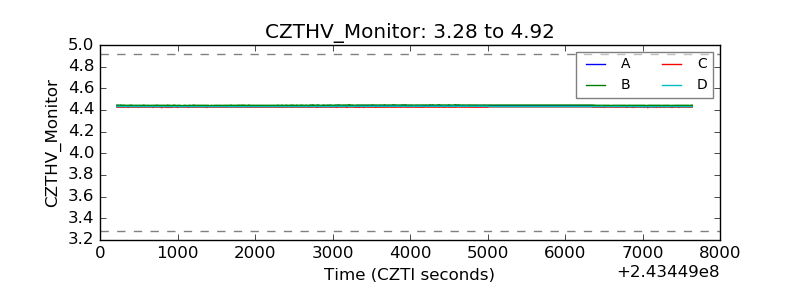 |
| D_VDD | 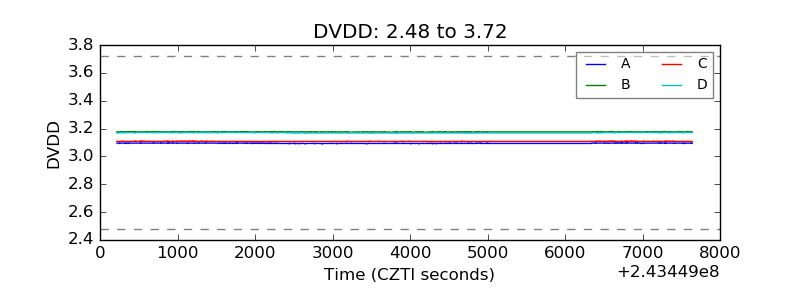 |
| Temperature 1 | 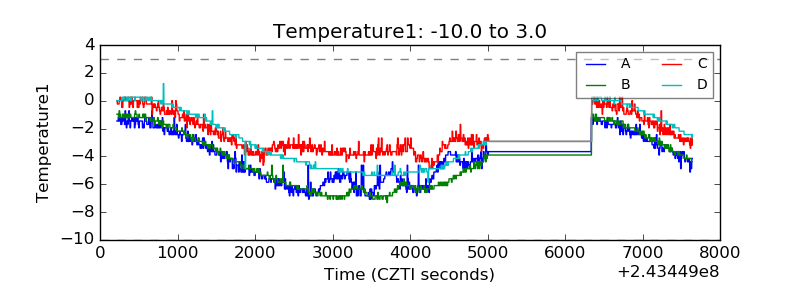 |
| Veto HV Monitor | 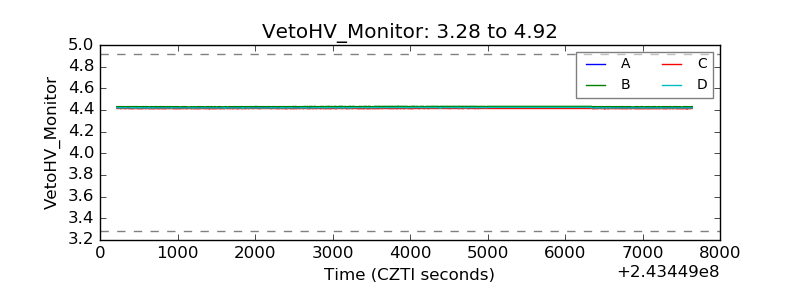 |
| Veto LLD | 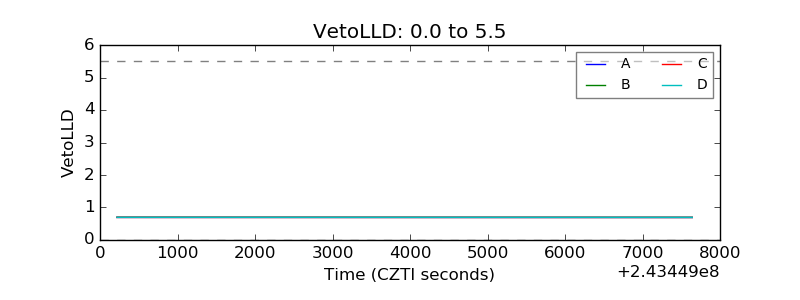 |
| Alpha Counter | 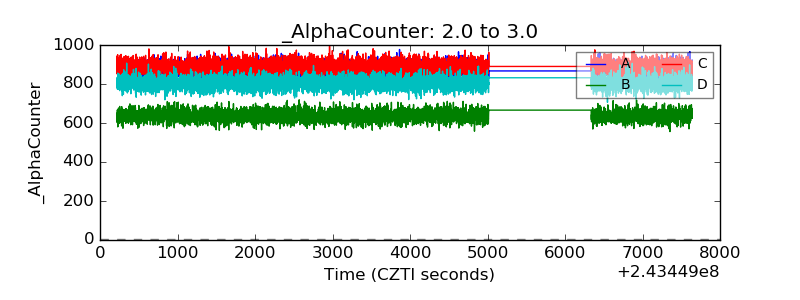 |
| _CPM_Rate | 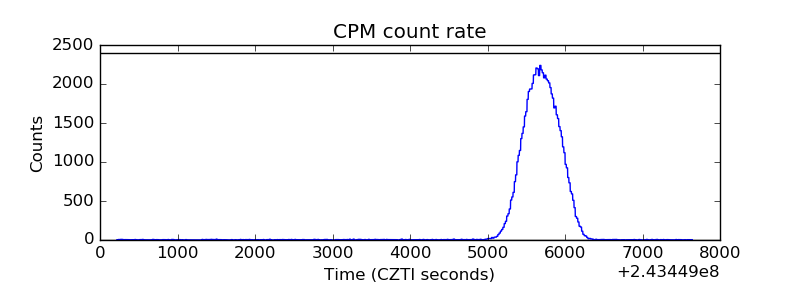 |
| CZT Counter | 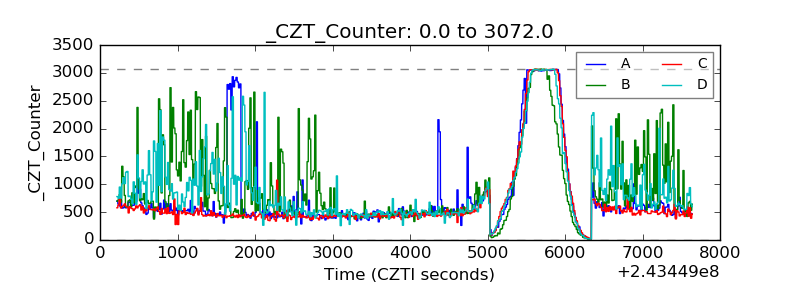 |
| +2.5 Volts monitor |  |
| +5 Volts monitor |  |
| _ROLL_ROT | 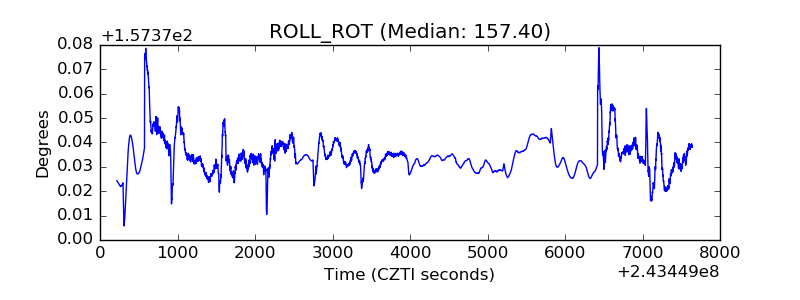 |
| _Roll_DEC | 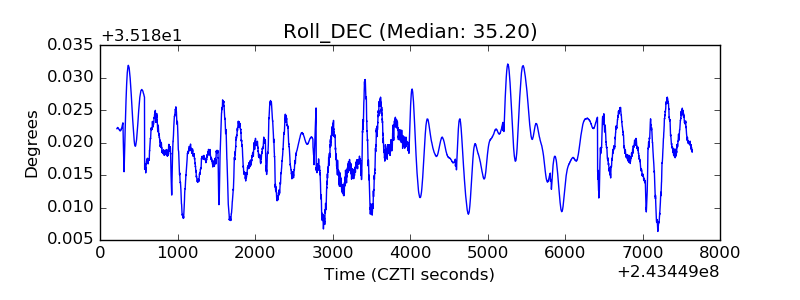 |
| _Roll_RA | 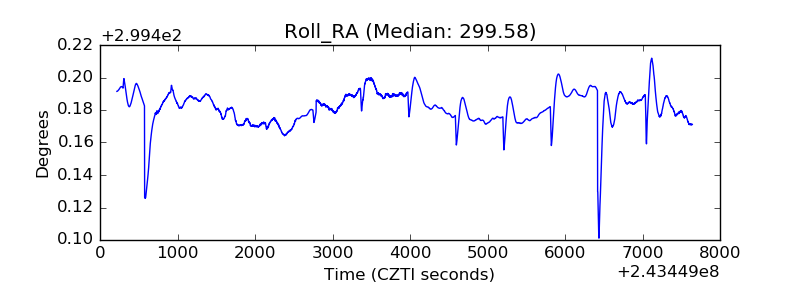 |
| Veto Counter | 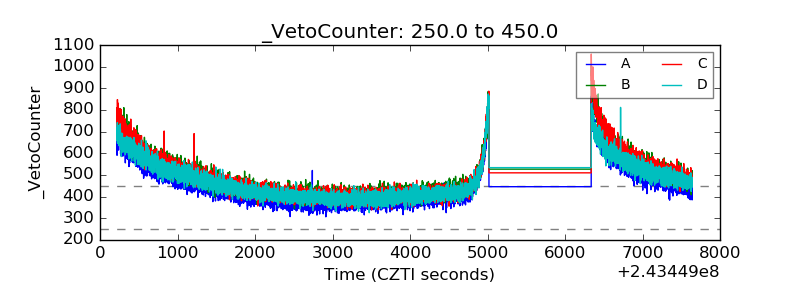 |