| Param | Original file | Final file |
|---|---|---|
| Filename | modeM0/AS1A03_097T01_9000001540_10682cztM0_level2.evt | modeM0/AS1A03_097T01_9000001540_10682cztM0_level2_quad_clean.evt |
| Size (bytes) | 548,510,400 | 88,018,560 |
| Size | 523.1 MB | 83.9 MB |
| Events in quadrant A | 3,301,263 | 570,153 |
| Events in quadrant B | 5,202,809 | 570,591 |
| Events in quadrant C | 2,960,642 | 576,018 |
| Events in quadrant D | 4,732,449 | 520,941 |
| Mode M9 | |||
|---|---|---|---|
| Quadrant | BADHDUFLAG | Total packets | Discarded packets |
| A | 0 | 17 | 0 |
| B | 0 | 17 | 0 |
| C | 0 | 17 | 0 |
| D | 0 | 18 | 0 |
| Mode M0 | |||
|---|---|---|---|
| Quadrant | BADHDUFLAG | Total packets | Discarded packets |
| A | 0 | 13846 | 3 |
| B | 0 | 19575 | 2 |
| C | 0 | 12802 | 2 |
| D | 0 | 18198 | 2 |
| Mode SS | |||
|---|---|---|---|
| Quadrant | BADHDUFLAG | Total packets | Discarded packets |
| A | 0 | 126 | 0 |
| B | 0 | 126 | 0 |
| C | 0 | 126 | 0 |
| D | 0 | 126 | 0 |
| Quadrant | Total seconds | Saturated seconds | Saturation percentage |
|---|---|---|---|
| A | 6117 | 62 | 1.013569% |
| B | 6117 | 439 | 7.176721% |
| C | 6117 | 32 | 0.523132% |
| D | 6117 | 279 | 4.561059% |
Noise dominated data is calculated using 1-second bins in cleaned event files. If a bin has >2000 counts, and if more than 50% of those come from <1% of pixels, then it is considered to be noise-dominated and hence unusable.
| Quadrant | # 1 sec bins | Bins with >0 counts | Bins with >2000 counts | High rate bins dominated by noise | Noise dominated (total time) | Noise dominated (detector-on time) | Marked lightcurve |
|---|---|---|---|---|---|---|---|
| A | 7467 | 6118 | 18 | 18 | 0.24% | 0.29% | 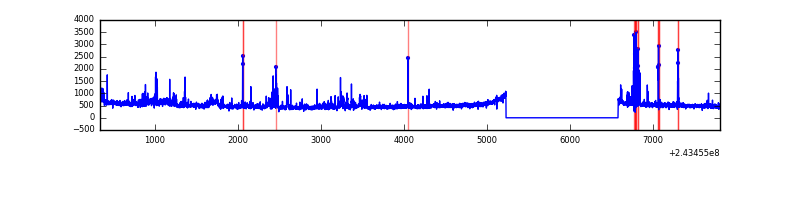 |
| B | 7467 | 6118 | 269 | 269 | 3.60% | 4.40% | 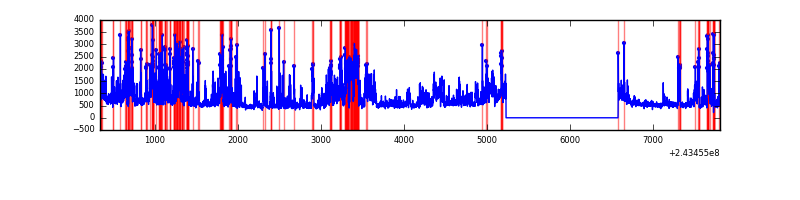 |
| C | 7467 | 6118 | 6 | 6 | 0.08% | 0.10% | 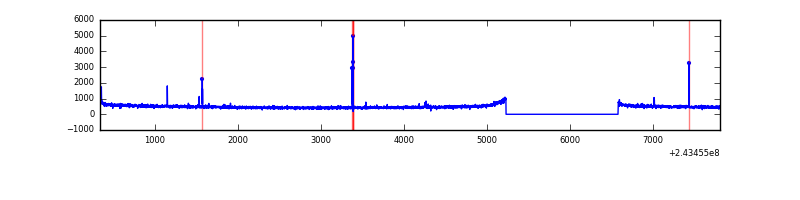 |
| D | 7467 | 6118 | 218 | 218 | 2.92% | 3.56% | 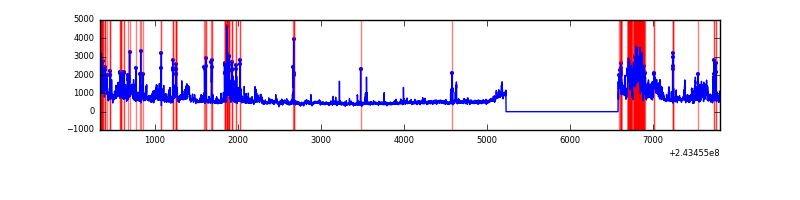 |
Top three noisy pixels from each quadrant. If the there are fewer than three noisy pixels in the level2.evt file, extra rows are filled as -1
| Pixel properties | Quadrant properties | ||||||
|---|---|---|---|---|---|---|---|
| Quadrant | DetID | PixID | Counts | Sigma | Mean | Median | Sigma |
| A | 0 | 167 | 108092 | 710.84 | 754 | 739 | 151.0 |
| A | 15 | 174 | 91430 | 600.51 | 754 | 739 | 151.0 |
| A | 15 | 239 | 85990 | 564.49 | 754 | 739 | 151.0 |
| B | 0 | 85 | 1248412 | 8867.5 | 751 | 734 | 140.7 |
| B | 4 | 239 | 783095 | 5560.4 | 751 | 734 | 140.7 |
| B | 4 | 81 | 74228 | 522.34 | 751 | 734 | 140.7 |
| C | 14 | 234 | 29629 | 167.49 | 745 | 749 | 172.4 |
| C | 4 | 175 | 9885 | 52.99 | 745 | 749 | 172.4 |
| C | 13 | 61 | 5660 | 28.48 | 745 | 749 | 172.4 |
| D | 2 | 16 | 741527 | 4261.23 | 725 | 708 | 173.9 |
| D | 10 | 199 | 547980 | 3147.94 | 725 | 708 | 173.9 |
| D | 8 | 195 | 366815 | 2105.87 | 725 | 708 | 173.9 |
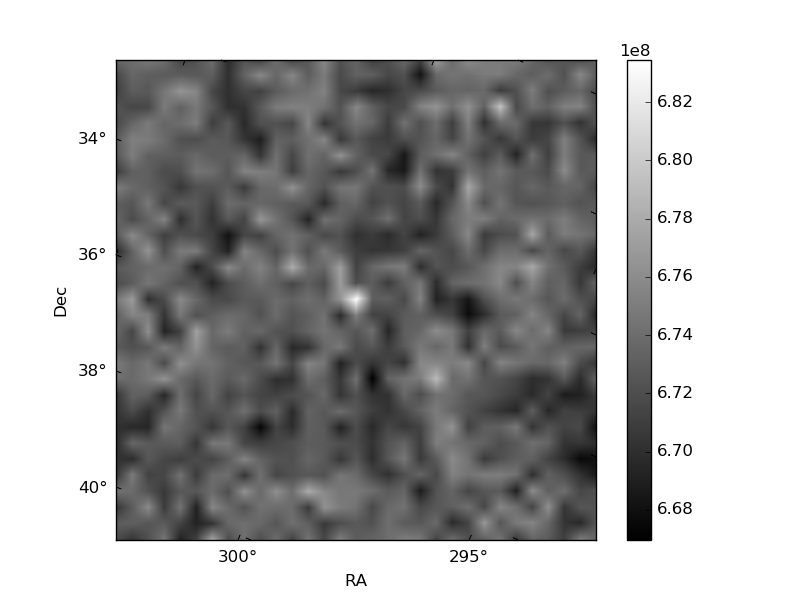
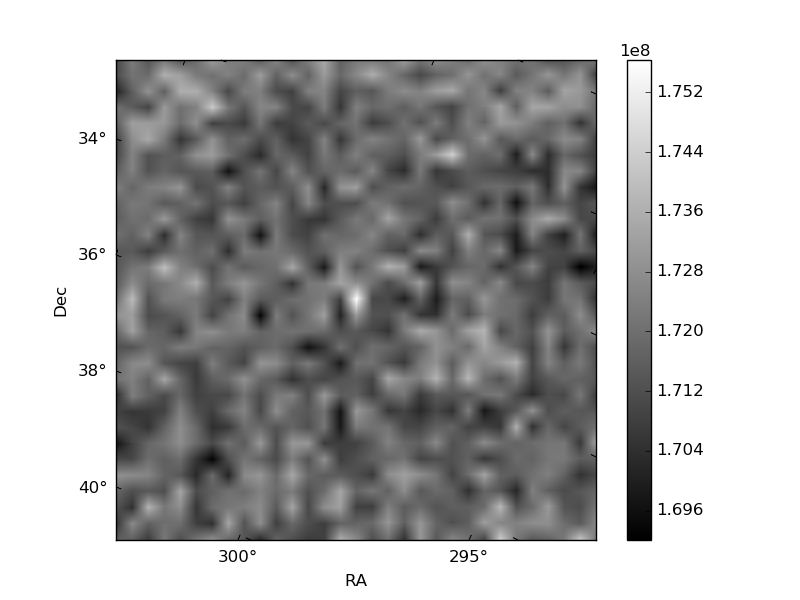
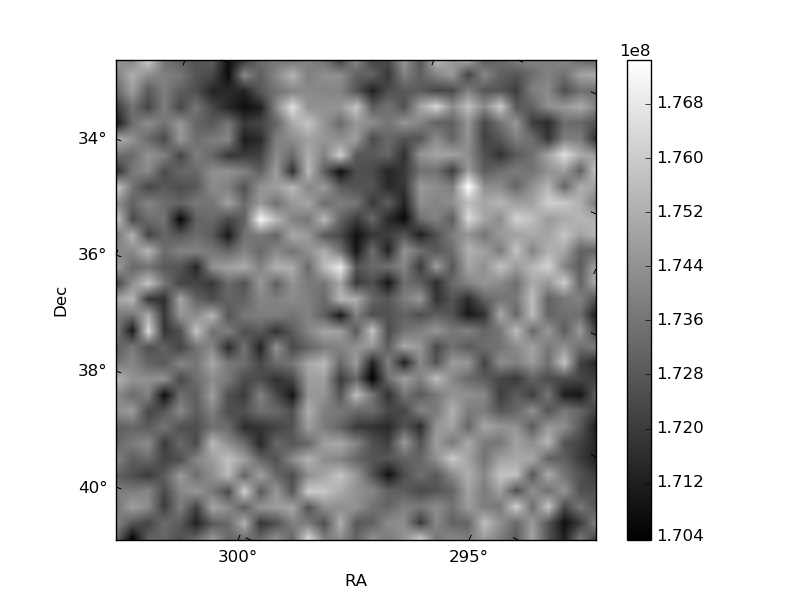
Histogram calculated using DETX and DETY for each event in the final _common_clean file
| Quadrant A | 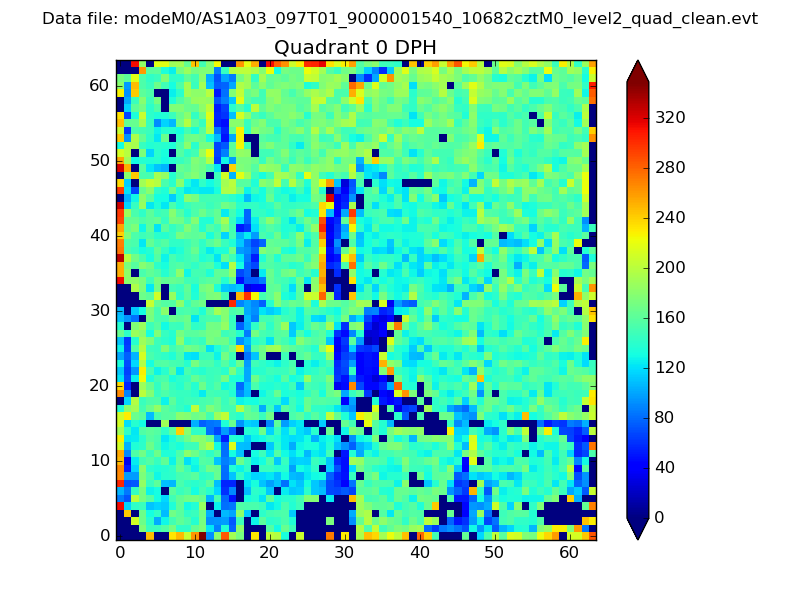 |
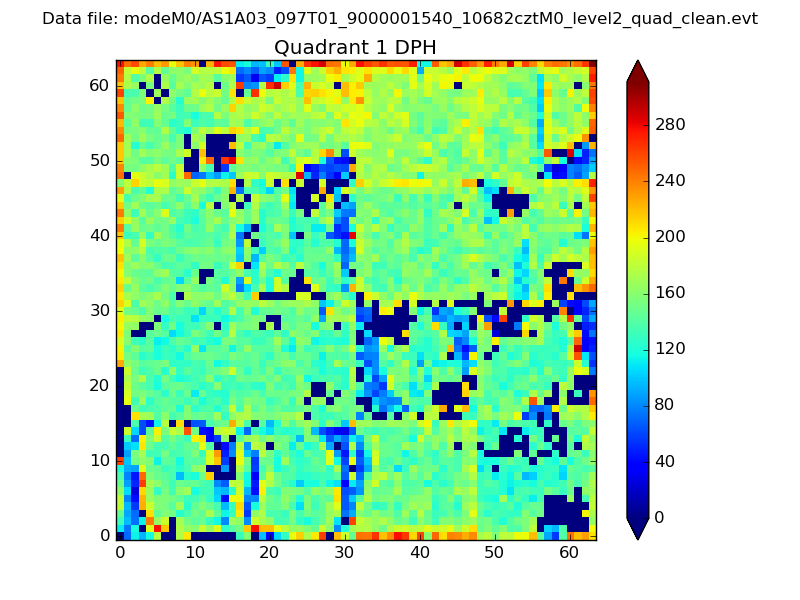 |
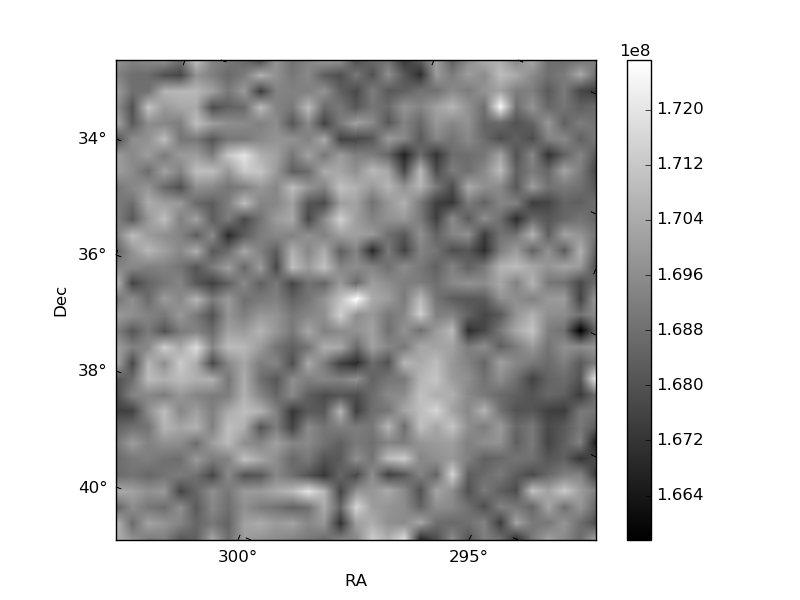
Quadrant B |
|---|---|---|---|
| Quadrant D | 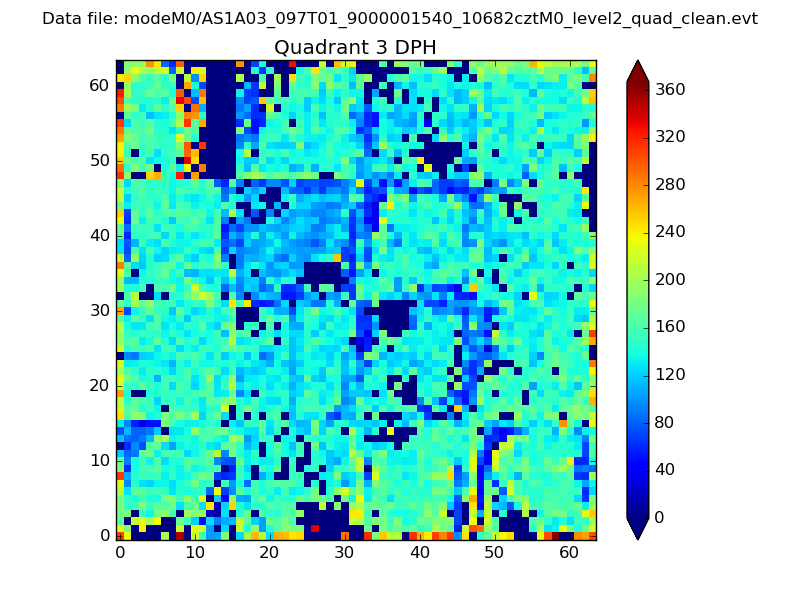 |
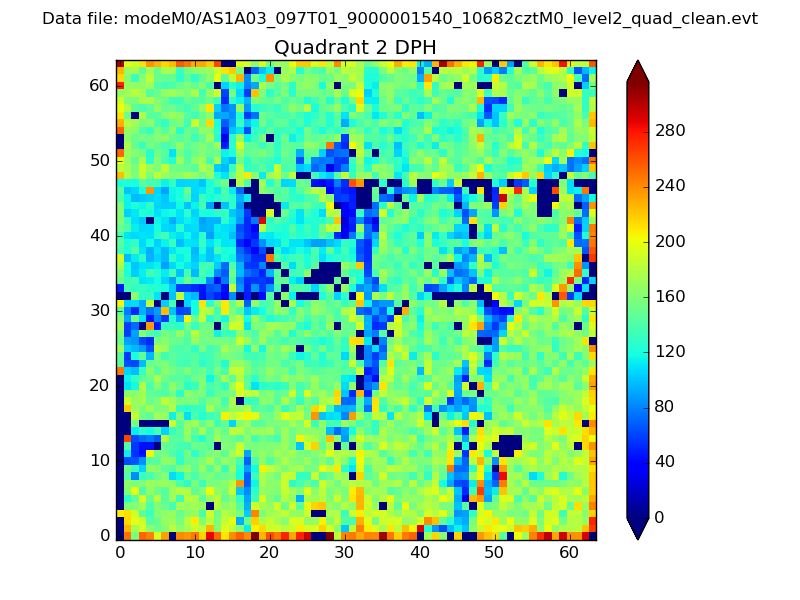 |
Quadrant C |
| Plot type | Count rate plots | Images |
|---|---|---|
| Comparison with Poisson distribution Blue bars denote a histogram of data divided into 1 sec bins. Red curve is a Poisson curve with rate = median count rate of data. |
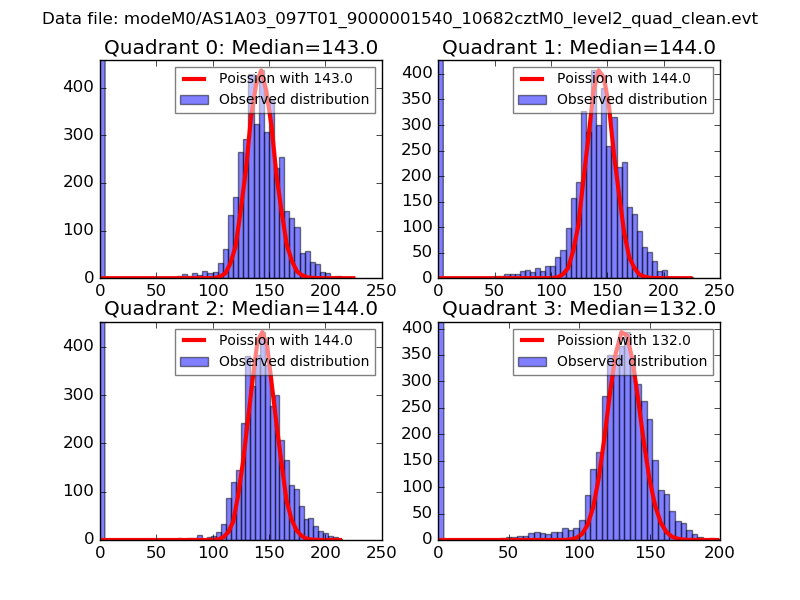 |
 |
| Quadrant-wise count rates Data is divided into 100 sec bins |
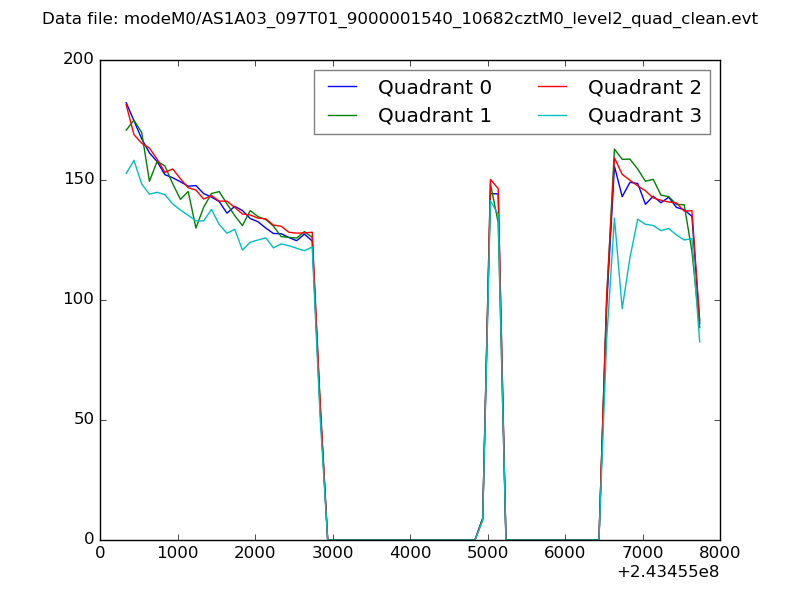 |
|
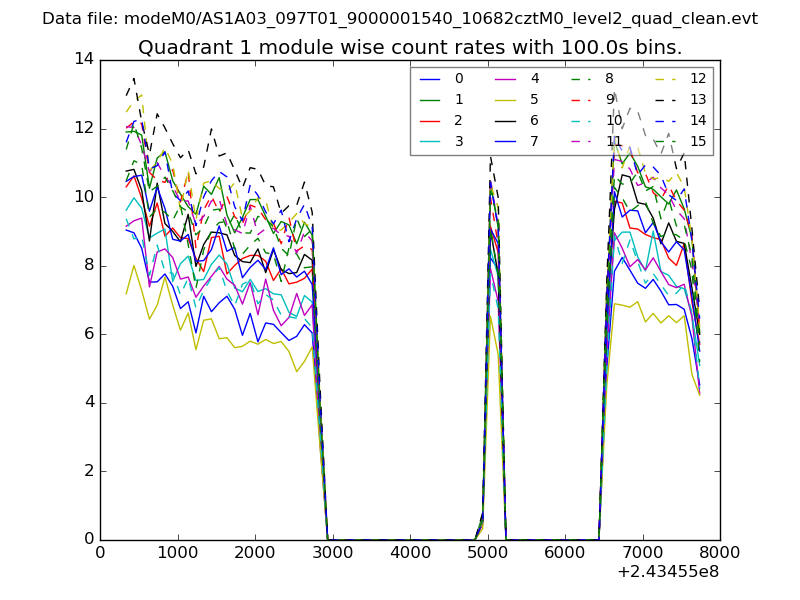
| Module-wise count rates for Quadrant A Data is divided into 100 sec bins |
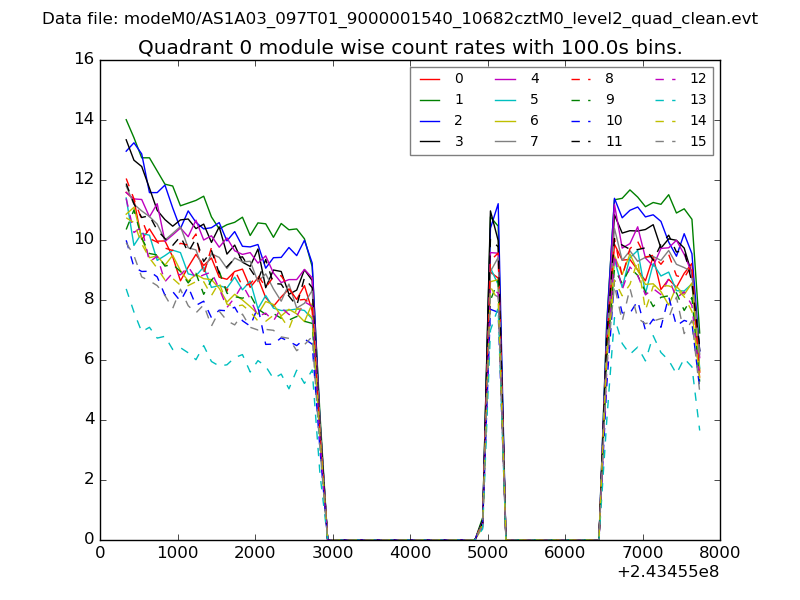 |
 |
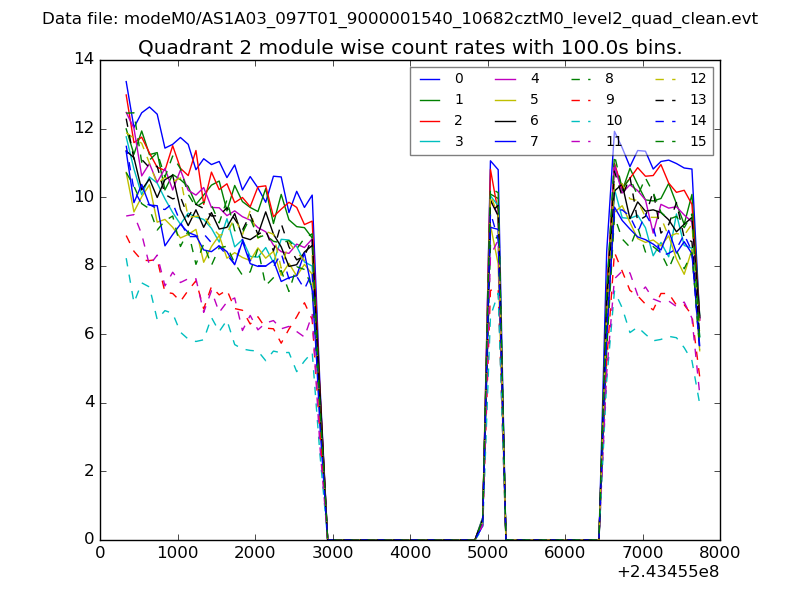
| Module-wise count rates for Quadrant B Data is divided into 100 sec bins |
 |
 |
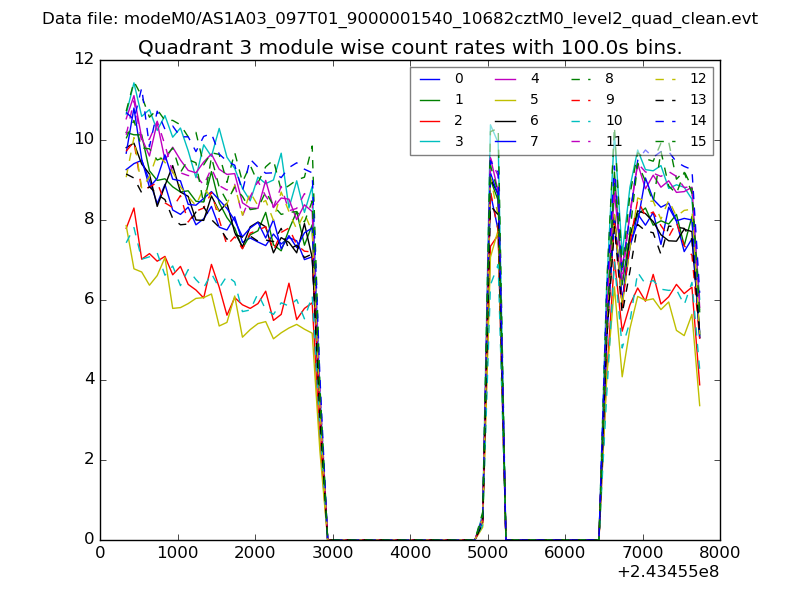
| Module-wise count rates for Quadrant C Data is divided into 100 sec bins |
 |
 |
| Module-wise count rates for Quadrant D Data is divided into 100 sec bins |
 |
 |
| Parameter | Plot |
|---|---|
| CZT HV Monitor | 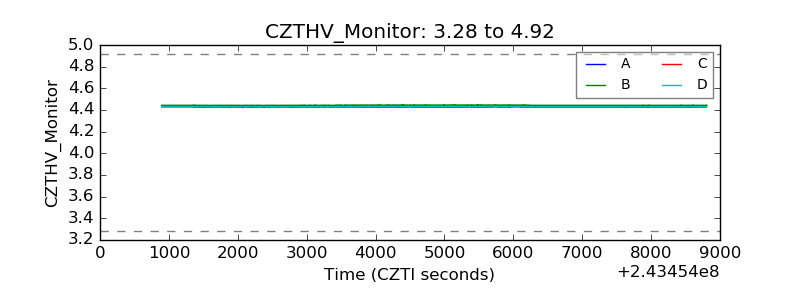 |
| D_VDD | 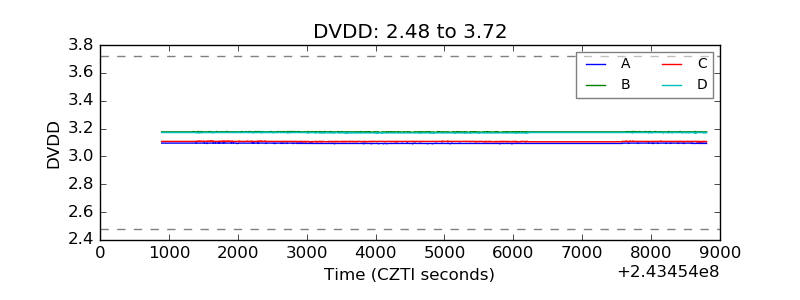 |
| Temperature 1 | 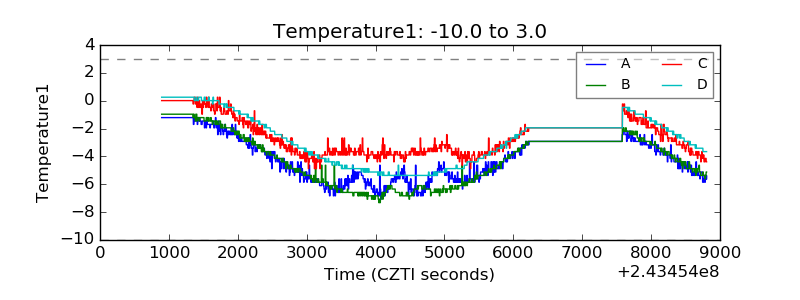 |
| Veto HV Monitor | 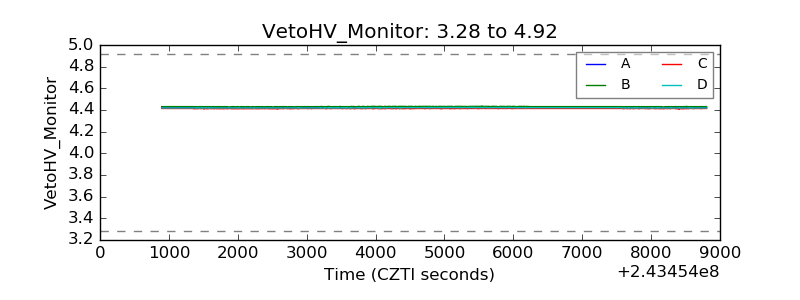 |
| Veto LLD |  |
| Alpha Counter | 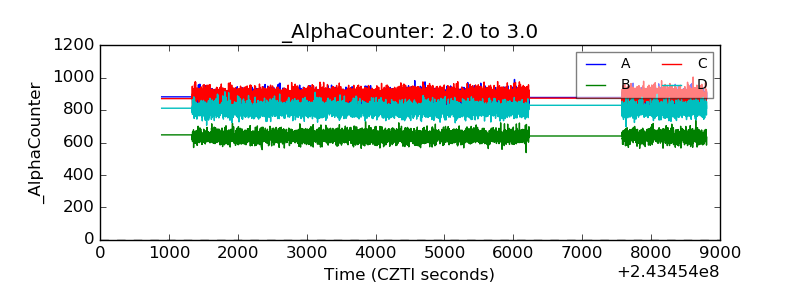 |
| _CPM_Rate | 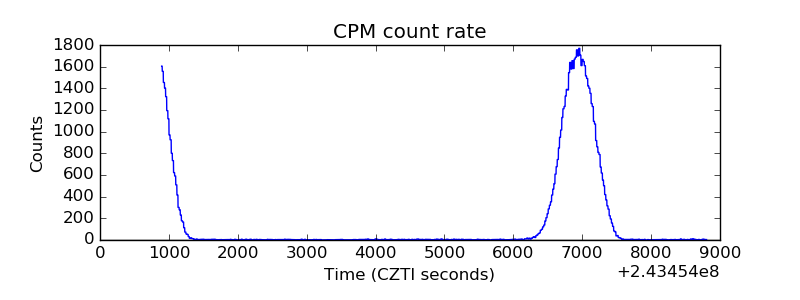 |
| CZT Counter | 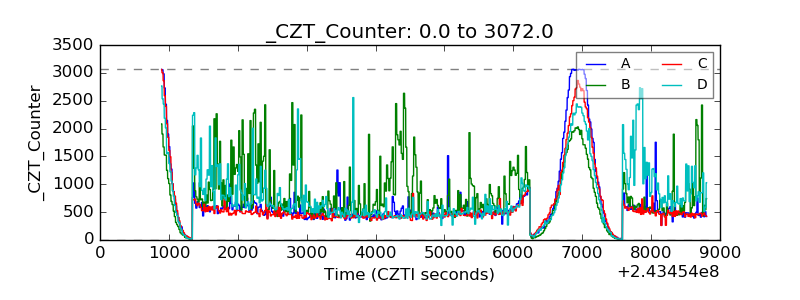 |
| +2.5 Volts monitor |  |
| +5 Volts monitor | 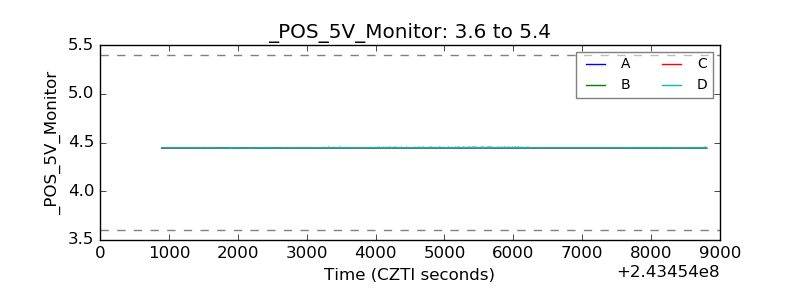 |
| _ROLL_ROT | 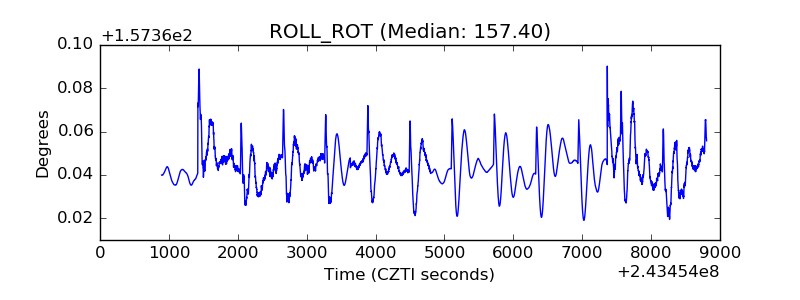 |
| _Roll_DEC | 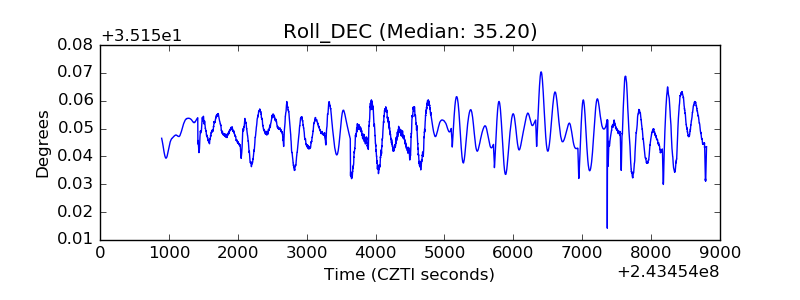 |
| _Roll_RA |  |
| Veto Counter | 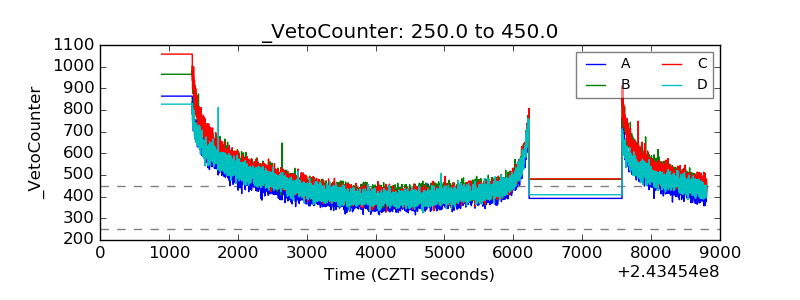 |