| Param | Original file | Final file |
|---|---|---|
| Filename | modeM0/AS1A03_097T01_9000001540_10683cztM0_level2.evt | modeM0/AS1A03_097T01_9000001540_10683cztM0_level2_quad_clean.evt |
| Size (bytes) | 496,244,160 | 82,722,240 |
| Size | 473.3 MB | 78.9 MB |
| Events in quadrant A | 2,908,875 | 532,428 |
| Events in quadrant B | 4,120,837 | 529,259 |
| Events in quadrant C | 2,788,952 | 537,721 |
| Events in quadrant D | 4,796,262 | 479,323 |
| Mode M9 | |||
|---|---|---|---|
| Quadrant | BADHDUFLAG | Total packets | Discarded packets |
| A | 0 | 13 | 0 |
| B | 0 | 13 | 0 |
| C | 0 | 13 | 0 |
| D | 0 | 13 | 0 |
| Mode M0 | |||
|---|---|---|---|
| Quadrant | BADHDUFLAG | Total packets | Discarded packets |
| A | 0 | 12789 | 2 |
| B | 0 | 16255 | 1 |
| C | 0 | 12482 | 1 |
| D | 0 | 18437 | 1 |
| Mode SS | |||
|---|---|---|---|
| Quadrant | BADHDUFLAG | Total packets | Discarded packets |
| A | 0 | 124 | 0 |
| B | 0 | 124 | 0 |
| C | 0 | 124 | 0 |
| D | 0 | 124 | 0 |
| Quadrant | Total seconds | Saturated seconds | Saturation percentage |
|---|---|---|---|
| A | 6101 | 33 | 0.540895% |
| B | 6101 | 292 | 4.786101% |
| C | 6101 | 6 | 0.098345% |
| D | 6101 | 337 | 5.523685% |
Noise dominated data is calculated using 1-second bins in cleaned event files. If a bin has >2000 counts, and if more than 50% of those come from <1% of pixels, then it is considered to be noise-dominated and hence unusable.
| Quadrant | # 1 sec bins | Bins with >0 counts | Bins with >2000 counts | High rate bins dominated by noise | Noise dominated (total time) | Noise dominated (detector-on time) | Marked lightcurve |
|---|---|---|---|---|---|---|---|
| A | 7381 | 6102 | 14 | 14 | 0.19% | 0.23% | 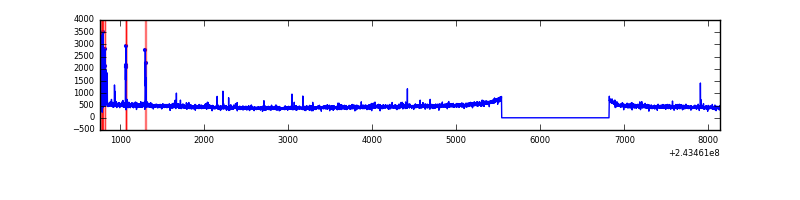 |
| B | 7381 | 6102 | 175 | 175 | 2.37% | 2.87% | 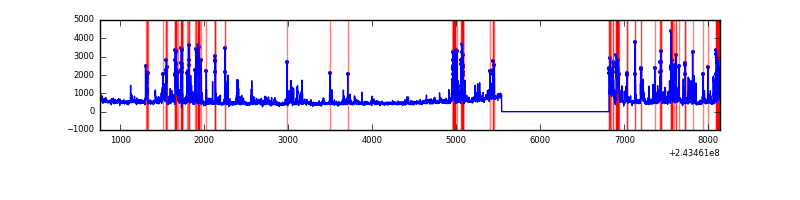 |
| C | 7381 | 6102 | 1 | 1 | 0.01% | 0.02% | 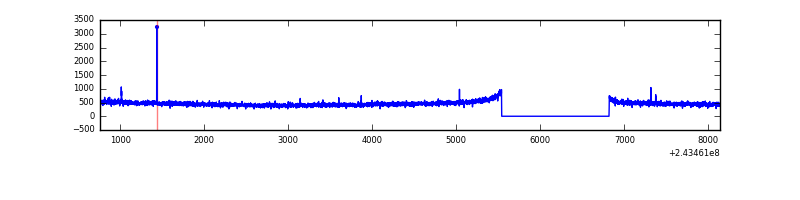 |
| D | 7381 | 6102 | 312 | 312 | 4.23% | 5.11% | 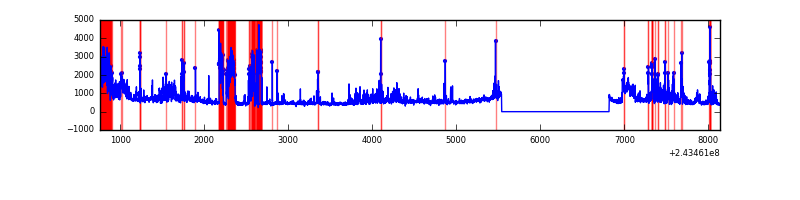 |
Top three noisy pixels from each quadrant. If the there are fewer than three noisy pixels in the level2.evt file, extra rows are filled as -1
| Pixel properties | Quadrant properties | ||||||
|---|---|---|---|---|---|---|---|
| Quadrant | DetID | PixID | Counts | Sigma | Mean | Median | Sigma |
| A | 15 | 174 | 78697 | 537.84 | 718 | 704 | 145.0 |
| A | 15 | 239 | 21789 | 145.4 | 718 | 704 | 145.0 |
| A | 1 | 162 | 13901 | 91.01 | 718 | 704 | 145.0 |
| B | 4 | 239 | 1025054 | 7527.43 | 718 | 699 | 136.1 |
| B | 0 | 85 | 106232 | 775.5 | 718 | 699 | 136.1 |
| B | 0 | 219 | 60157 | 436.92 | 718 | 699 | 136.1 |
| C | 14 | 234 | 7411 | 40.4 | 712 | 716 | 165.7 |
| C | 13 | 61 | 5285 | 27.57 | 712 | 716 | 165.7 |
| C | 9 | 68 | 3752 | 18.32 | 712 | 716 | 165.7 |
| D | 2 | 16 | 612810 | 3747.56 | 684 | 668 | 163.3 |
| D | 2 | 14 | 570444 | 3488.2 | 684 | 668 | 163.3 |
| D | 10 | 199 | 355901 | 2174.75 | 684 | 668 | 163.3 |
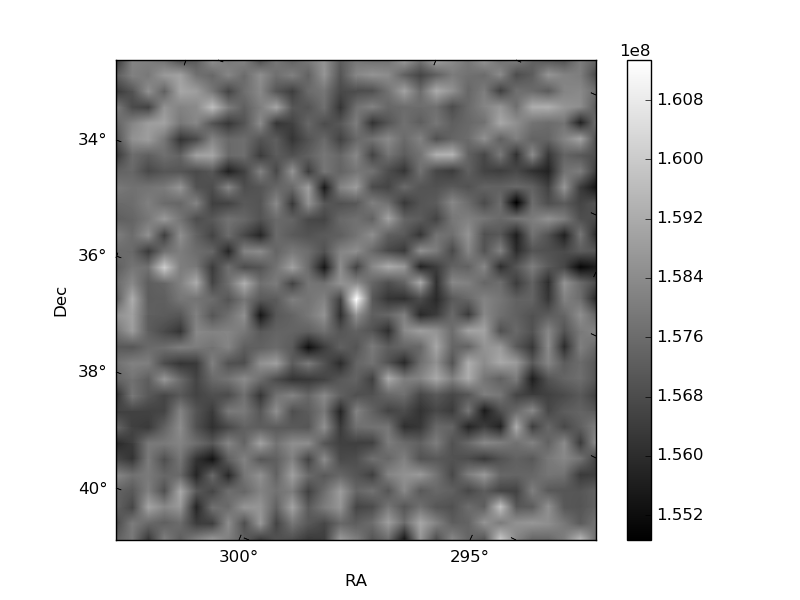
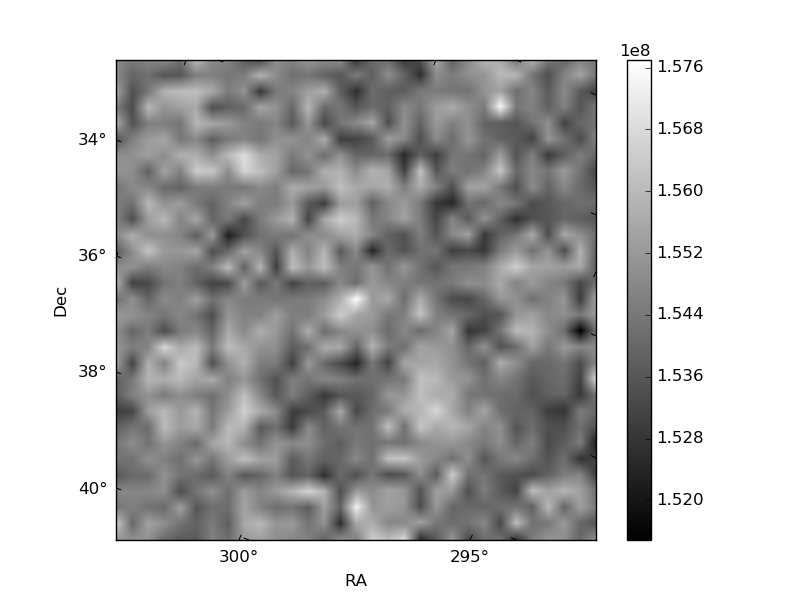
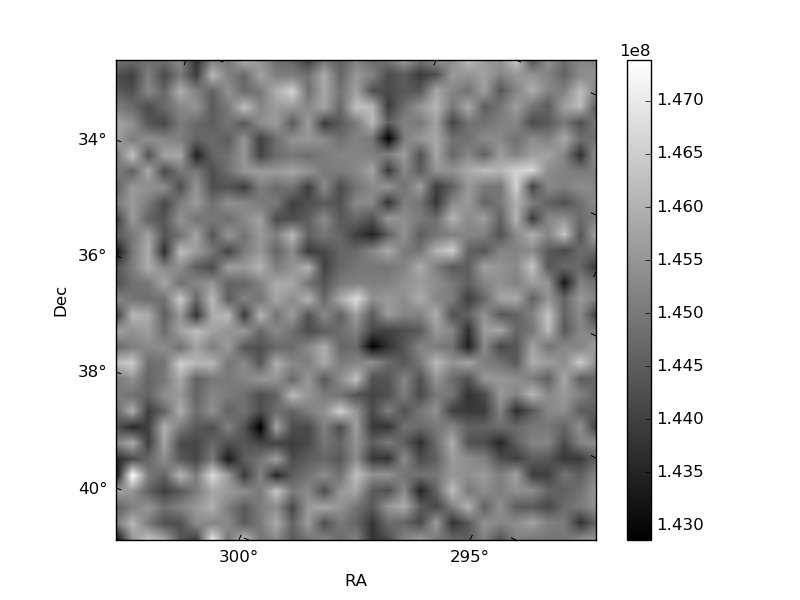
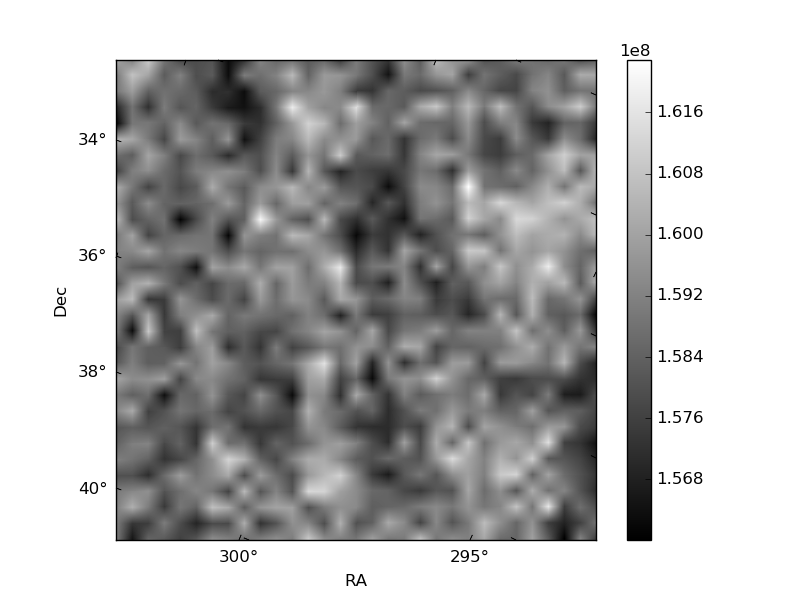
Histogram calculated using DETX and DETY for each event in the final _common_clean file
| Quadrant A | 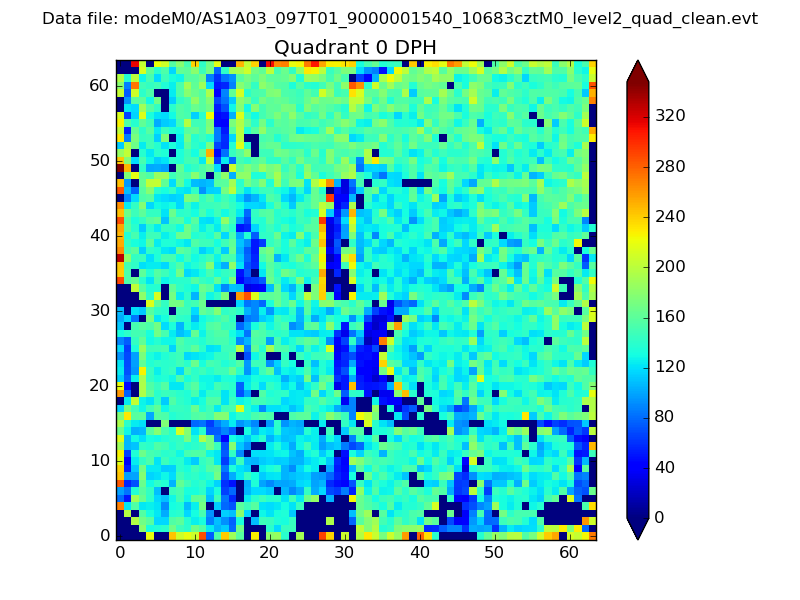 |
 |
Quadrant B |
|---|---|---|---|
| Quadrant D | 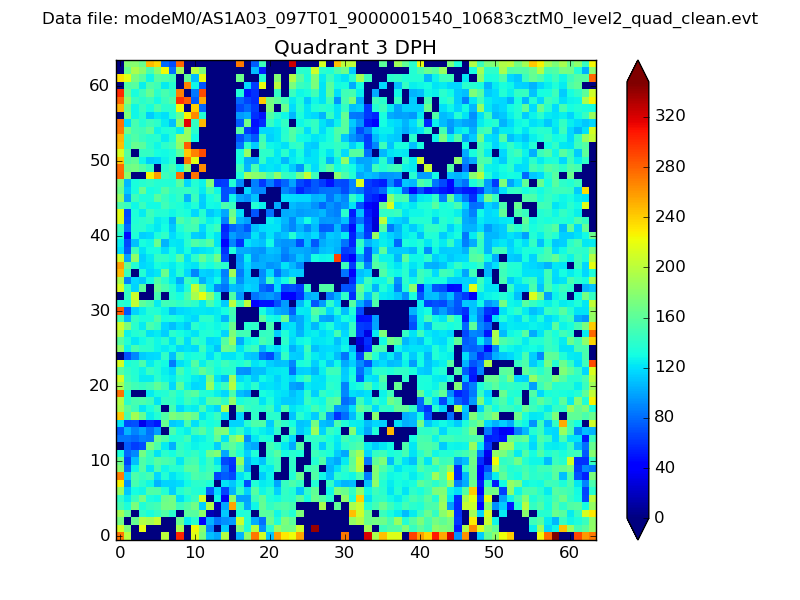 |
 |
Quadrant C |
| Plot type | Count rate plots | Images |
|---|---|---|
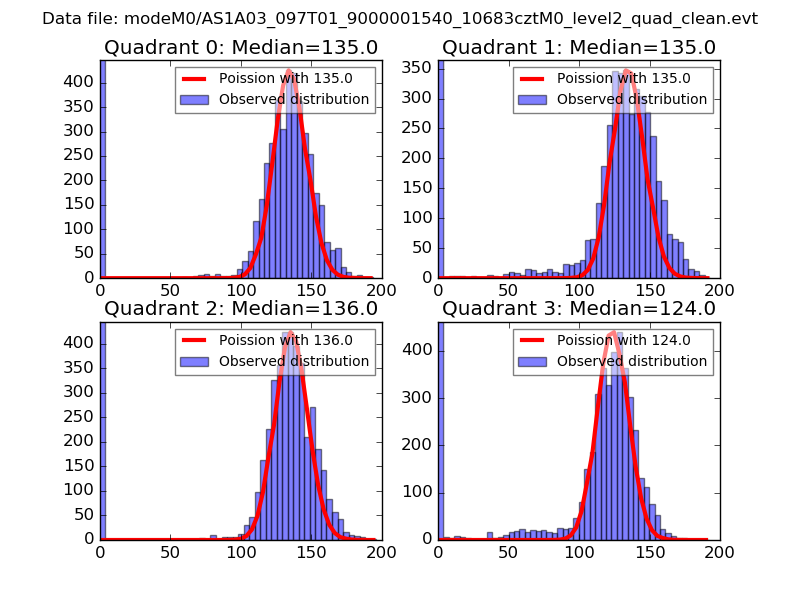
| Comparison with Poisson distribution Blue bars denote a histogram of data divided into 1 sec bins. Red curve is a Poisson curve with rate = median count rate of data. |
 |
 |
| Quadrant-wise count rates Data is divided into 100 sec bins |
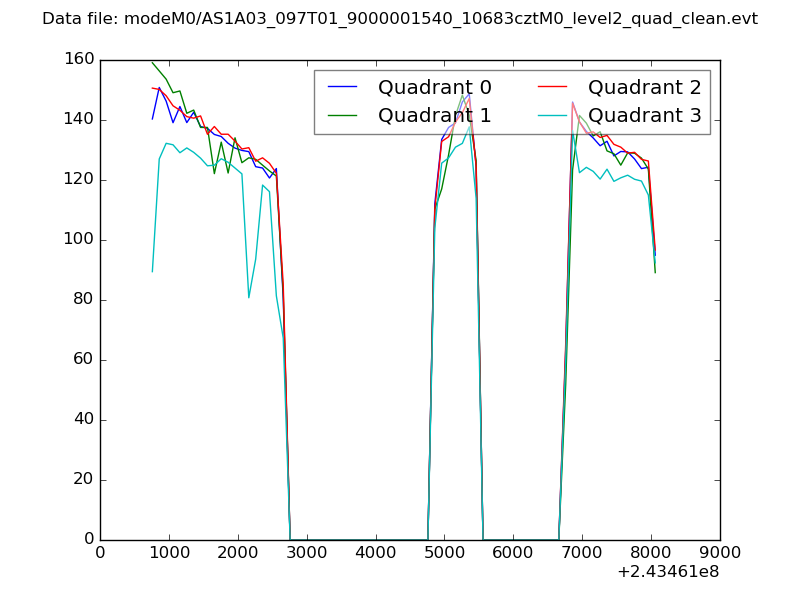 |
|
| Module-wise count rates for Quadrant A Data is divided into 100 sec bins |
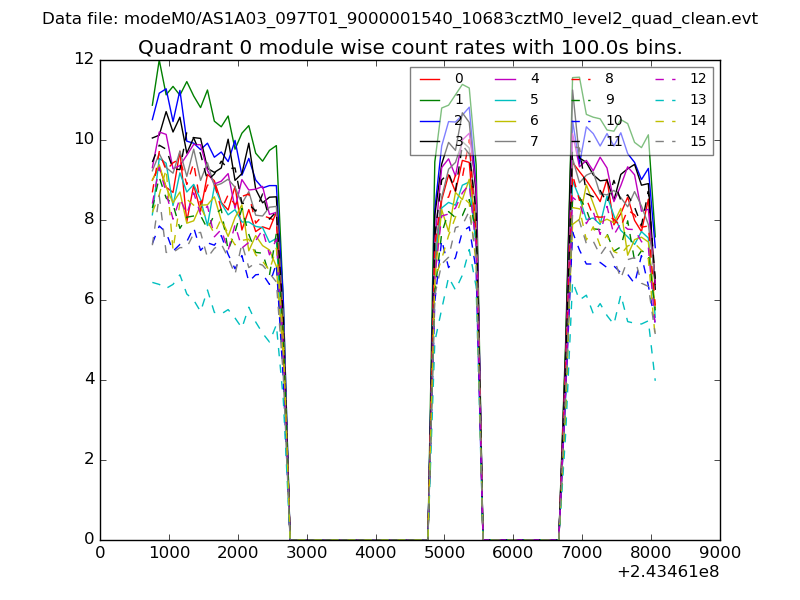 |
 |
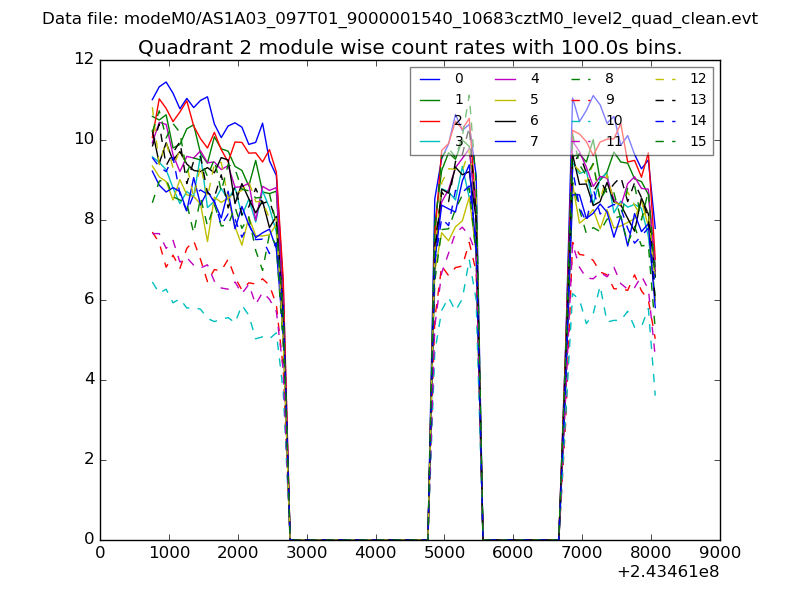
| Module-wise count rates for Quadrant B Data is divided into 100 sec bins |
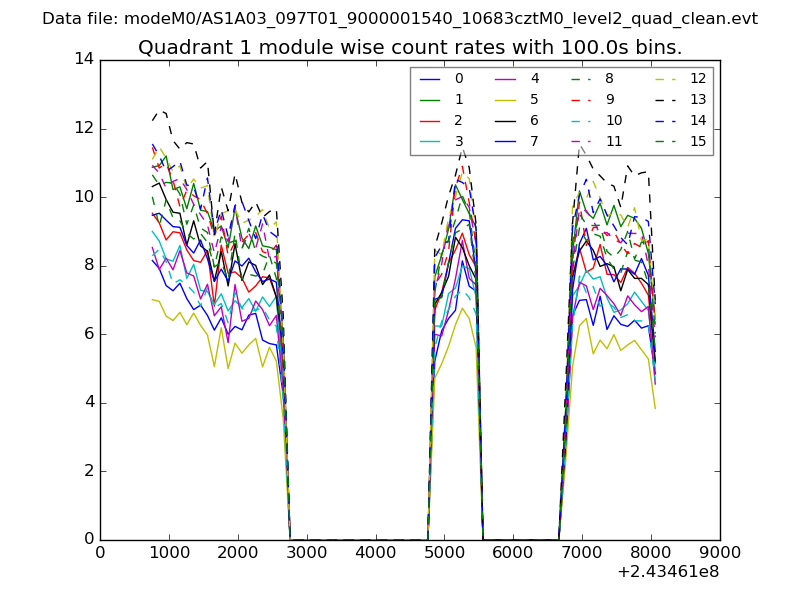 |
 |
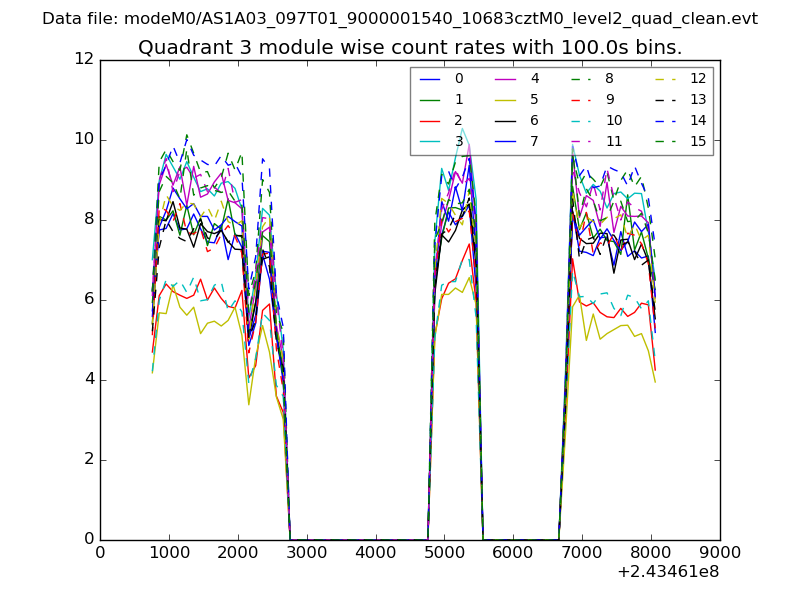
| Module-wise count rates for Quadrant C Data is divided into 100 sec bins |
 |
 |
| Module-wise count rates for Quadrant D Data is divided into 100 sec bins |
 |
 |
| Parameter | Plot |
|---|---|
| CZT HV Monitor | 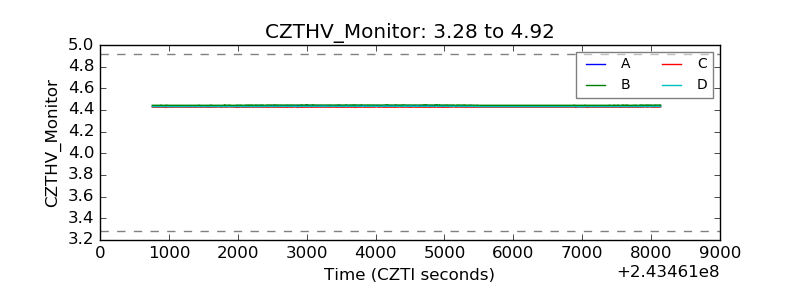 |
| D_VDD | 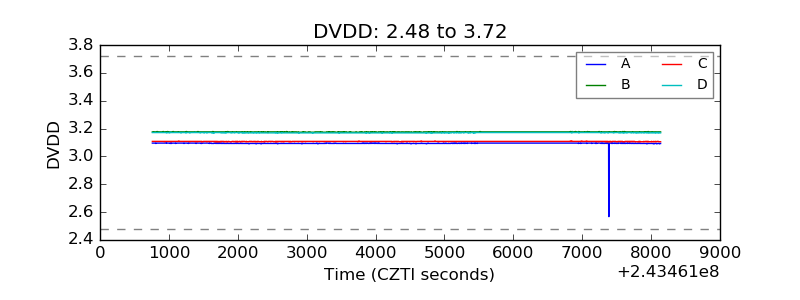 |
| Temperature 1 |  |
| Veto HV Monitor | 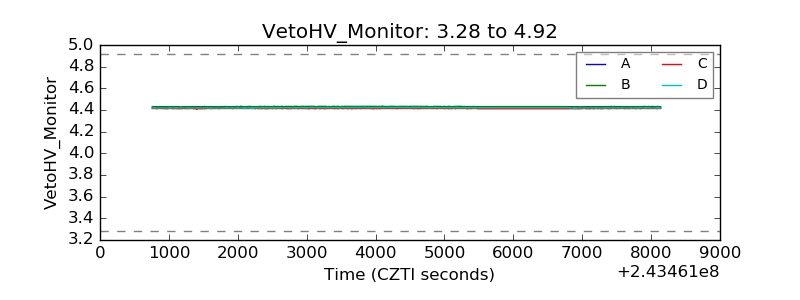 |
| Veto LLD | 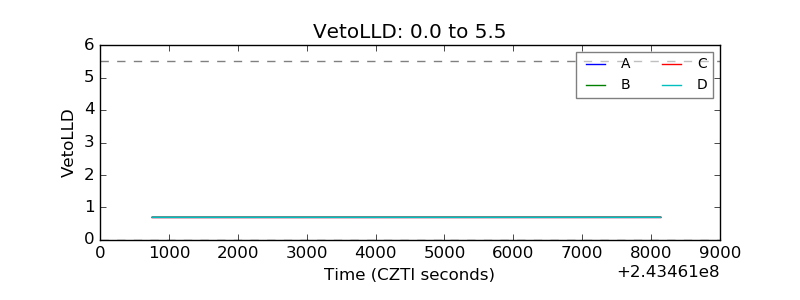 |
| Alpha Counter | 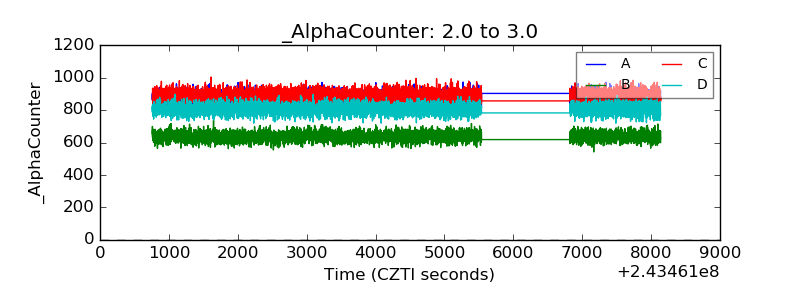 |
| _CPM_Rate | 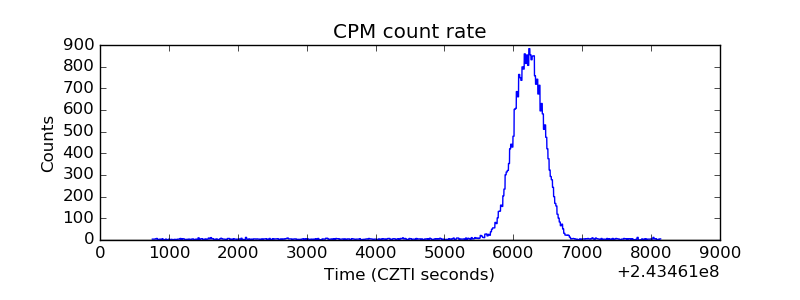 |
| CZT Counter | 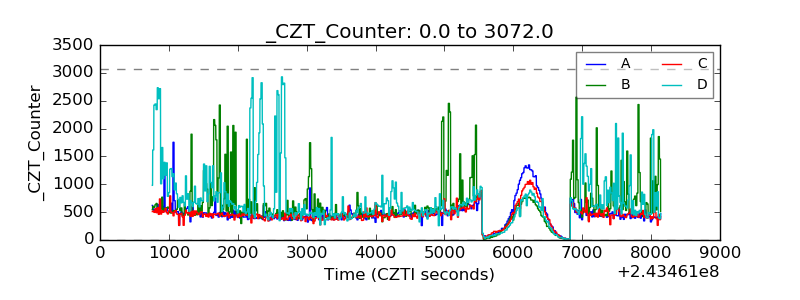 |
| +2.5 Volts monitor |  |
| +5 Volts monitor | 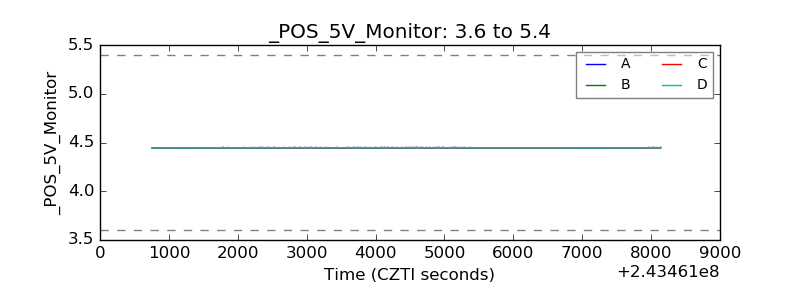 |
| _ROLL_ROT | 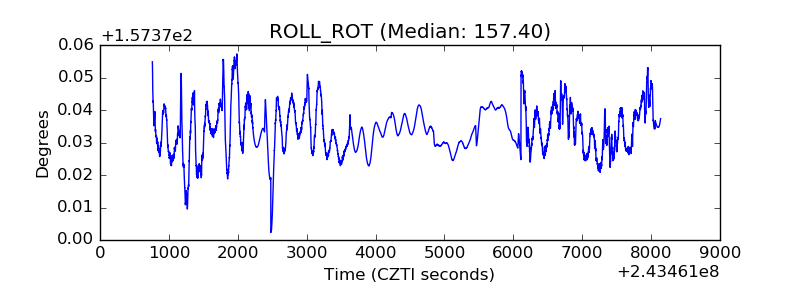 |
| _Roll_DEC | 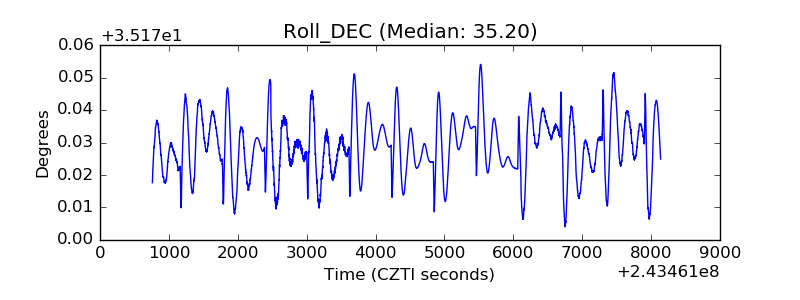 |
| _Roll_RA | 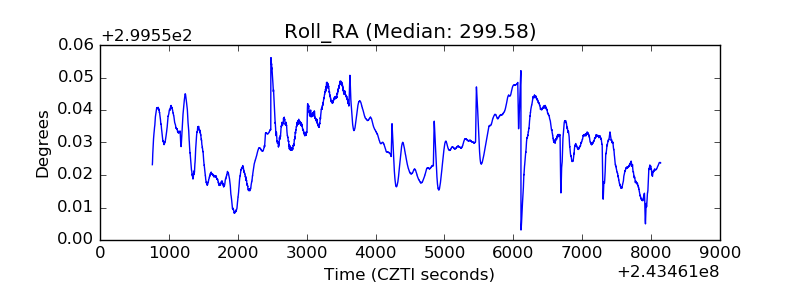 |
| Veto Counter | 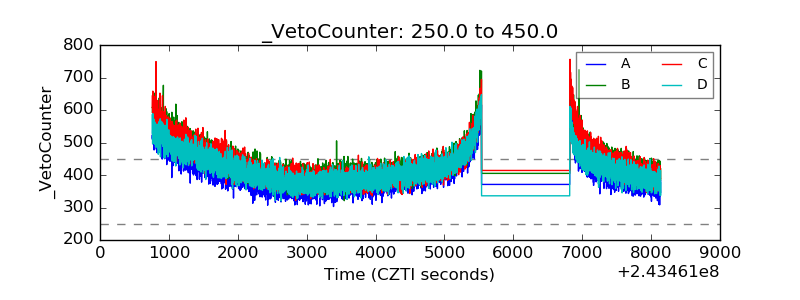 |