| Param | Original file | Final file |
|---|---|---|
| Filename | modeM0/AS1A03_097T01_9000001540_10685cztM0_level2.evt | modeM0/AS1A03_097T01_9000001540_10685cztM0_level2_quad_clean.evt |
| Size (bytes) | 1,000,802,880 | 157,190,400 |
| Size | 954.4 MB | 149.9 MB |
| Events in quadrant A | 5,911,926 | 1,000,966 |
| Events in quadrant B | 9,712,896 | 990,824 |
| Events in quadrant C | 5,597,926 | 1,002,458 |
| Events in quadrant D | 8,239,866 | 900,392 |
| Mode M9 | |||
|---|---|---|---|
| Quadrant | BADHDUFLAG | Total packets | Discarded packets |
| A | 0 | 20 | 0 |
| B | 0 | 20 | 0 |
| C | 0 | 20 | 0 |
| D | 0 | 21 | 0 |
| Mode M0 | |||
|---|---|---|---|
| Quadrant | BADHDUFLAG | Total packets | Discarded packets |
| A | 0 | 26337 | 4 |
| B | 0 | 37290 | 10 |
| C | 0 | 25602 | 3 |
| D | 0 | 33274 | 3 |
| Mode SS | |||
|---|---|---|---|
| Quadrant | BADHDUFLAG | Total packets | Discarded packets |
| A | 0 | 252 | 0 |
| B | 0 | 252 | 0 |
| C | 0 | 252 | 0 |
| D | 0 | 252 | 0 |
| Quadrant | Total seconds | Saturated seconds | Saturation percentage |
|---|---|---|---|
| A | 12531 | 74 | 0.590535% |
| B | 12530 | 1461 | 11.660016% |
| C | 12531 | 43 | 0.343149% |
| D | 12531 | 677 | 5.402602% |
Noise dominated data is calculated using 1-second bins in cleaned event files. If a bin has >2000 counts, and if more than 50% of those come from <1% of pixels, then it is considered to be noise-dominated and hence unusable.
| Quadrant | # 1 sec bins | Bins with >0 counts | Bins with >2000 counts | High rate bins dominated by noise | Noise dominated (total time) | Noise dominated (detector-on time) | Marked lightcurve |
|---|---|---|---|---|---|---|---|
| A | 13946 | 12533 | 2 | 2 | 0.01% | 0.02% | 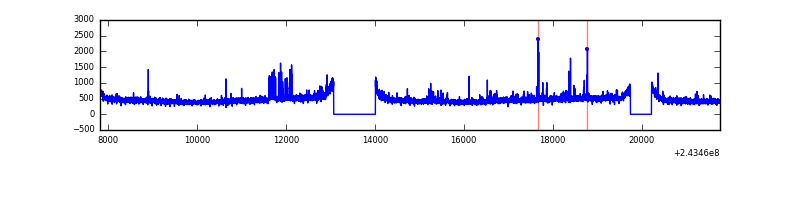 |
| B | 13946 | 12533 | 996 | 996 | 7.14% | 7.95% | 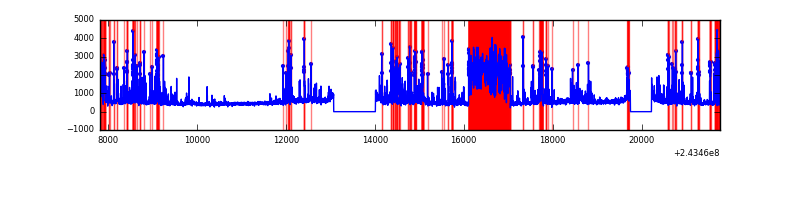 |
| C | 13946 | 12533 | 1 | 1 | 0.01% | 0.01% | 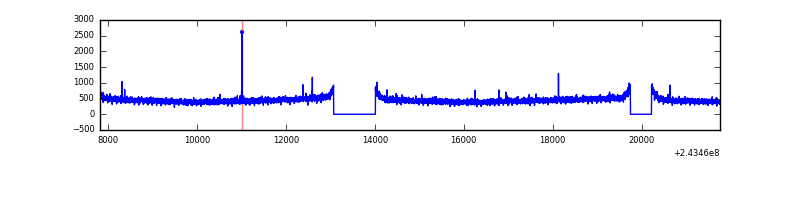 |
| D | 13946 | 12532 | 537 | 537 | 3.85% | 4.29% | 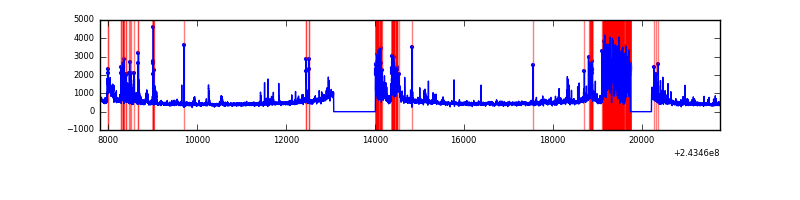 |
Top three noisy pixels from each quadrant. If the there are fewer than three noisy pixels in the level2.evt file, extra rows are filled as -1
| Pixel properties | Quadrant properties | ||||||
|---|---|---|---|---|---|---|---|
| Quadrant | DetID | PixID | Counts | Sigma | Mean | Median | Sigma |
| A | 15 | 239 | 252298 | 852.48 | 1459 | 1428 | 294.3 |
| A | 11 | 29 | 16563 | 51.43 | 1459 | 1428 | 294.3 |
| A | 0 | 226 | 13511 | 41.06 | 1459 | 1428 | 294.3 |
| B | 4 | 239 | 1920189 | 7221.63 | 1400 | 1364 | 265.7 |
| B | 0 | 85 | 1790468 | 6733.42 | 1400 | 1364 | 265.7 |
| B | 4 | 81 | 200698 | 750.21 | 1400 | 1364 | 265.7 |
| C | 14 | 234 | 15594 | 42.96 | 1430 | 1438 | 329.5 |
| C | 13 | 61 | 10694 | 28.09 | 1430 | 1438 | 329.5 |
| C | 8 | 222 | 5412 | 12.06 | 1430 | 1438 | 329.5 |
| D | 10 | 199 | 1578219 | 4849.36 | 1364 | 1327 | 325.2 |
| D | 2 | 16 | 474050 | 1453.75 | 1364 | 1327 | 325.2 |
| D | 8 | 195 | 320313 | 980.96 | 1364 | 1327 | 325.2 |
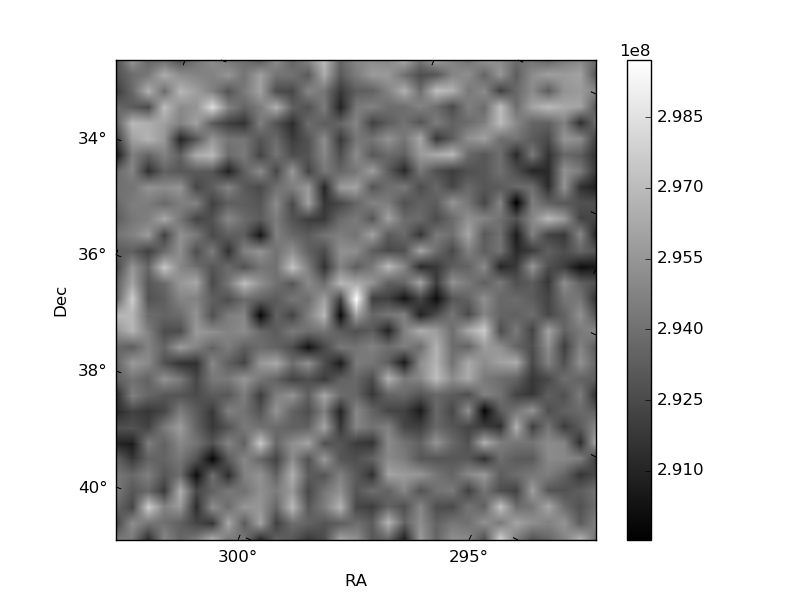
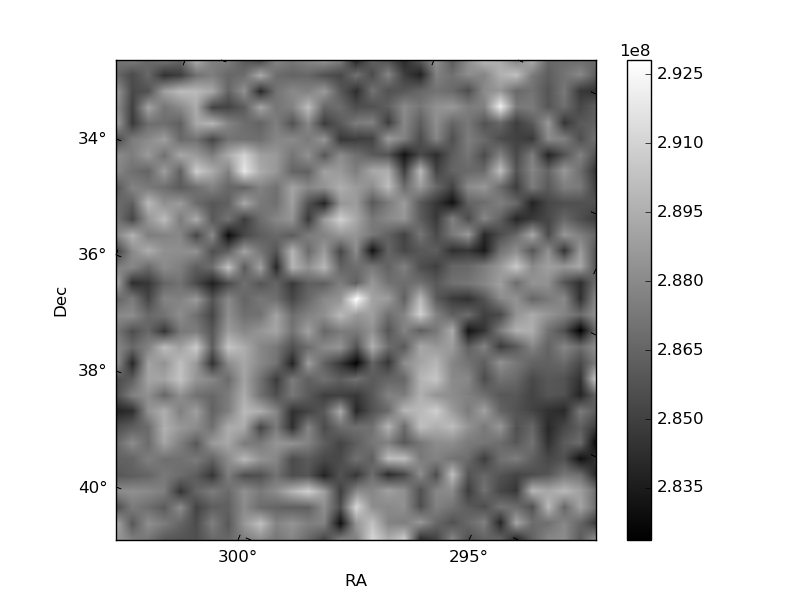
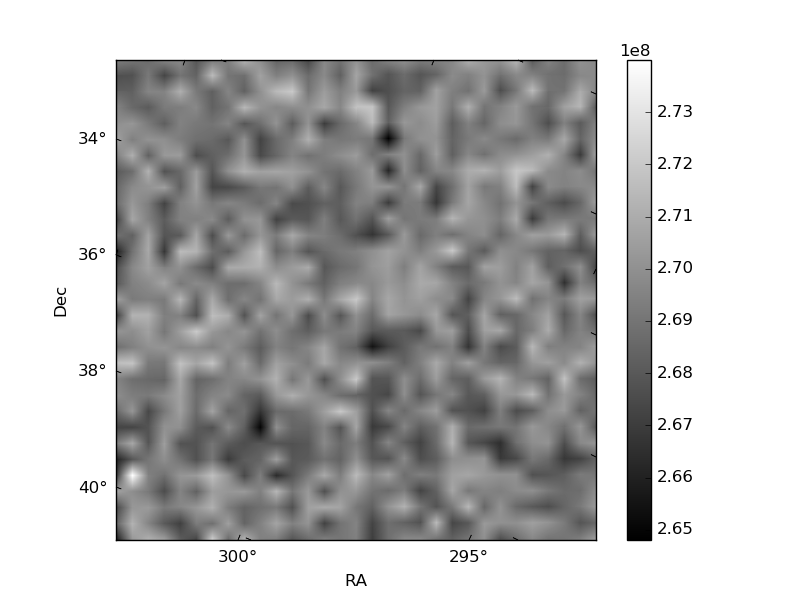
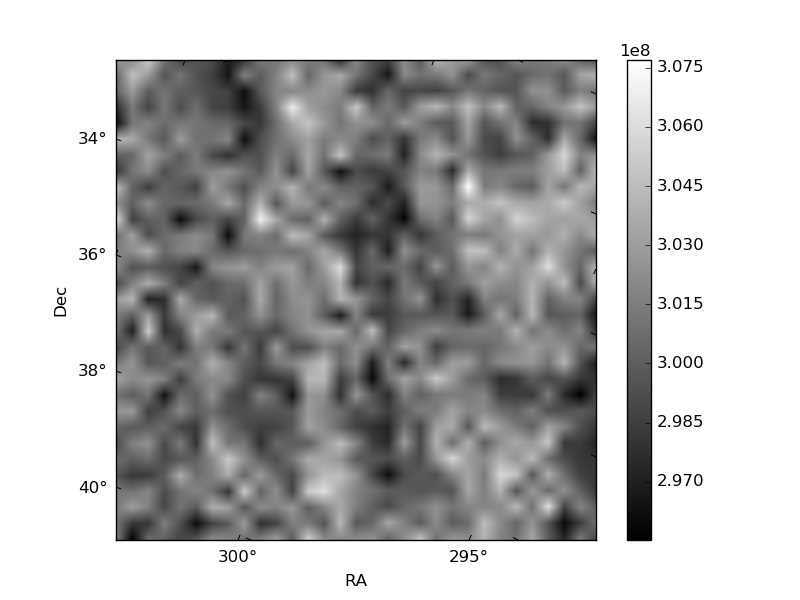
Histogram calculated using DETX and DETY for each event in the final _common_clean file
| Quadrant A | 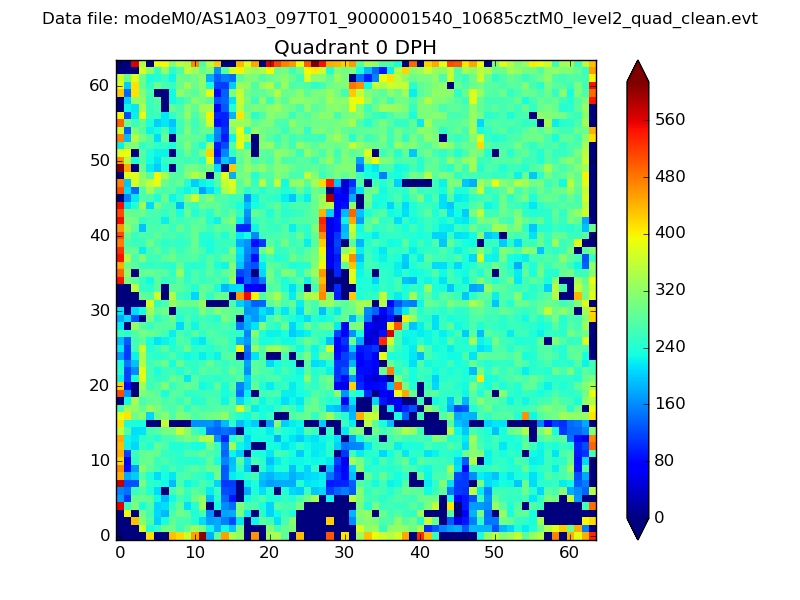 |
 |
Quadrant B |
|---|---|---|---|
| Quadrant D | 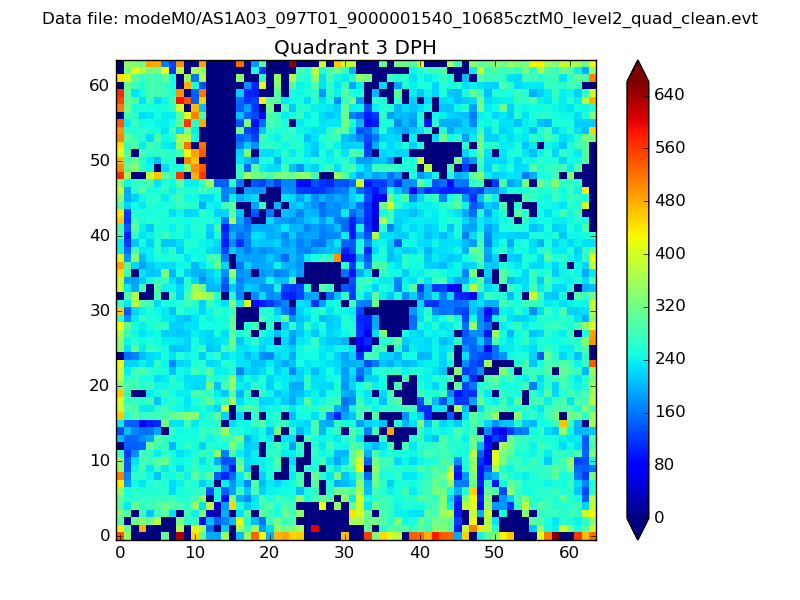 |
 |
Quadrant C |
| Plot type | Count rate plots | Images |
|---|---|---|
| Comparison with Poisson distribution Blue bars denote a histogram of data divided into 1 sec bins. Red curve is a Poisson curve with rate = median count rate of data. |
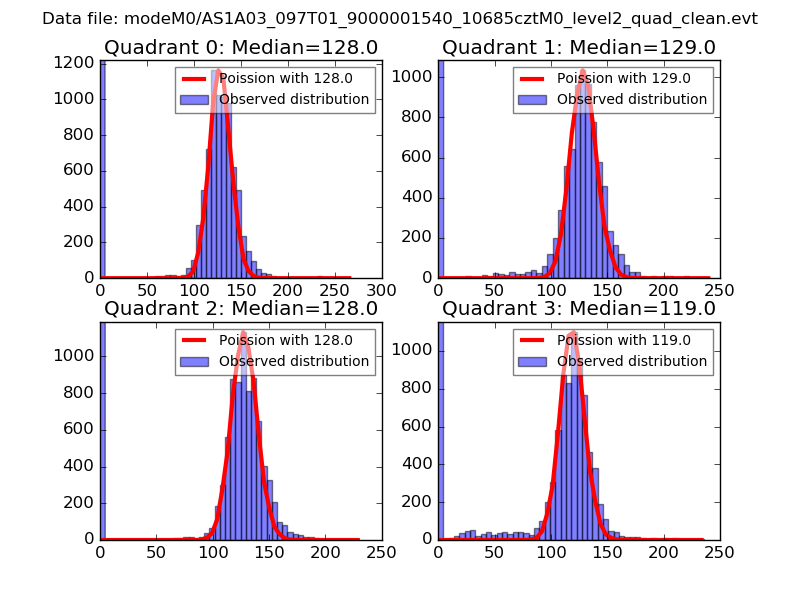 |
 |
| Quadrant-wise count rates Data is divided into 100 sec bins |
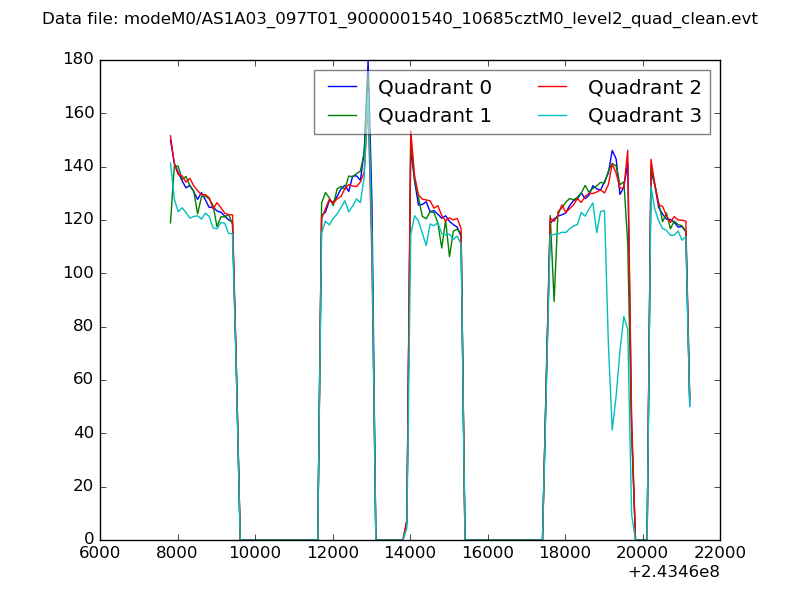 |
|
| Module-wise count rates for Quadrant A Data is divided into 100 sec bins |
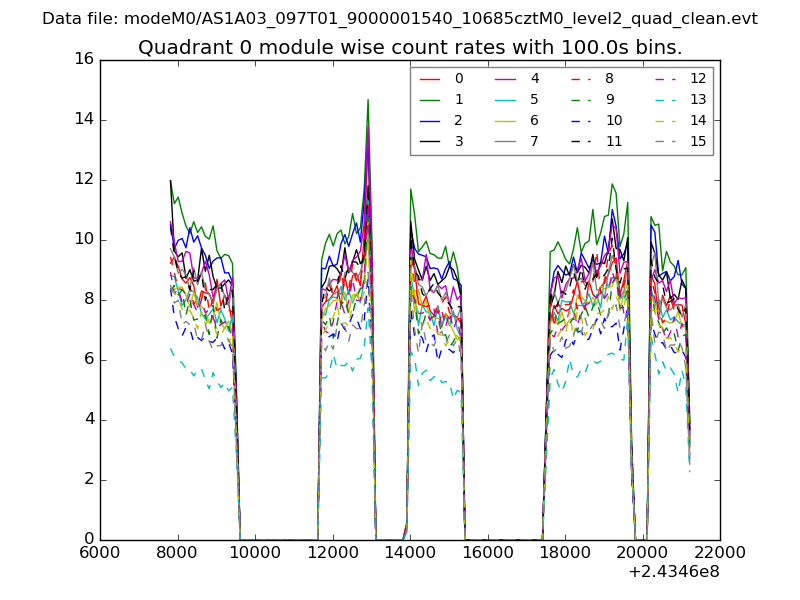 |
 |
| Module-wise count rates for Quadrant B Data is divided into 100 sec bins |
 |
 |
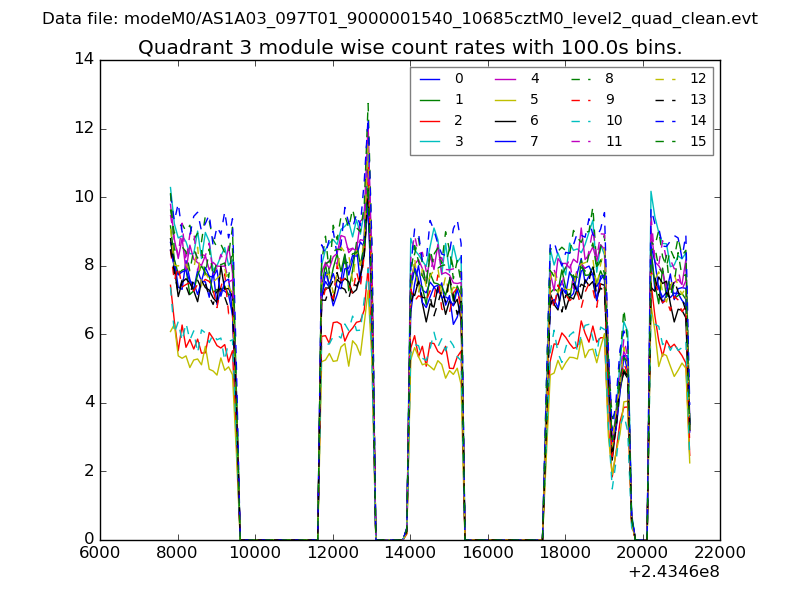
| Module-wise count rates for Quadrant C Data is divided into 100 sec bins |
 |
 |
| Module-wise count rates for Quadrant D Data is divided into 100 sec bins |
 |
 |
| Parameter | Plot |
|---|---|
| CZT HV Monitor |  |
| D_VDD | 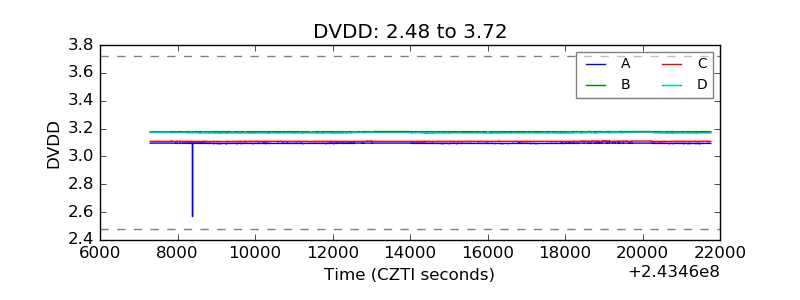 |
| Temperature 1 | 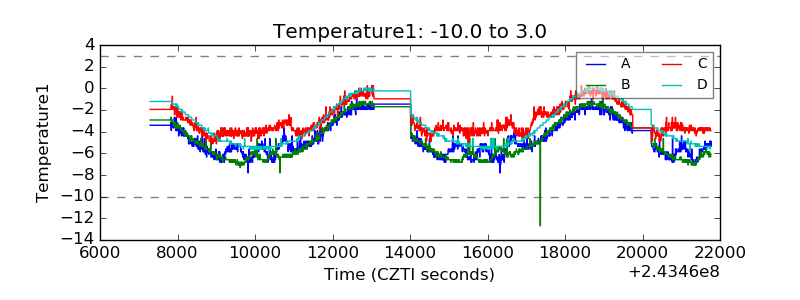 |
| Veto HV Monitor | 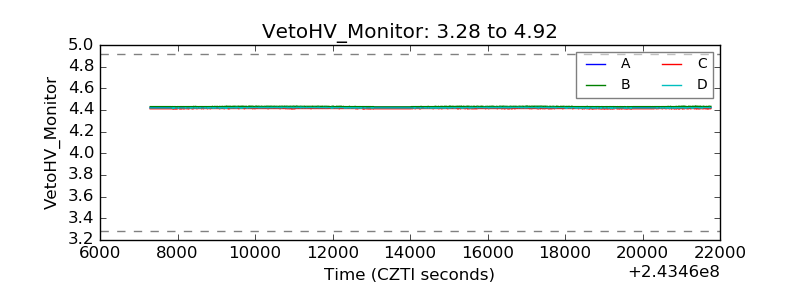 |
| Veto LLD | 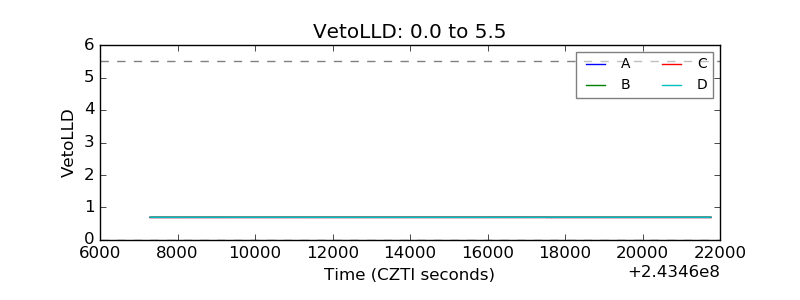 |
| Alpha Counter |  |
| _CPM_Rate | 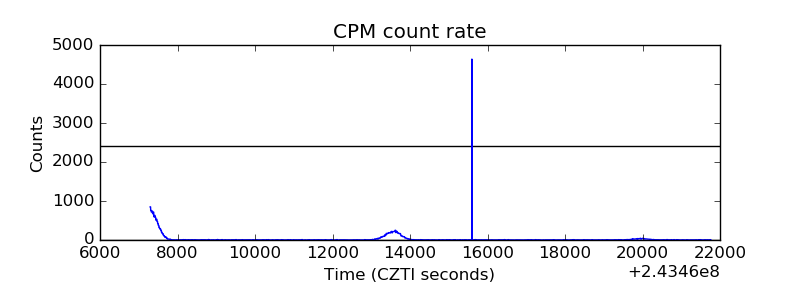 |
| CZT Counter | 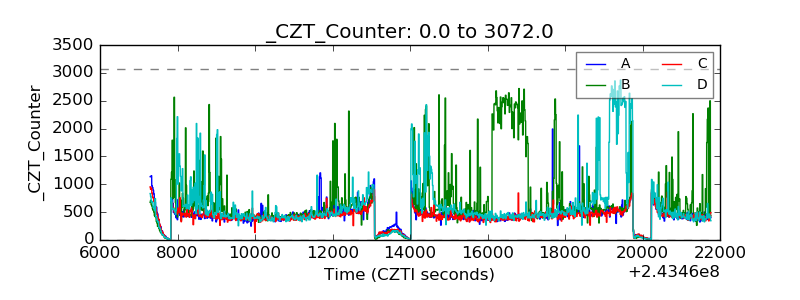 |
| +2.5 Volts monitor |  |
| +5 Volts monitor | 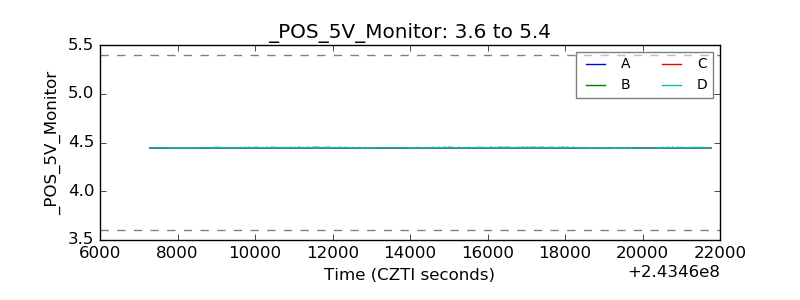 |
| _ROLL_ROT | 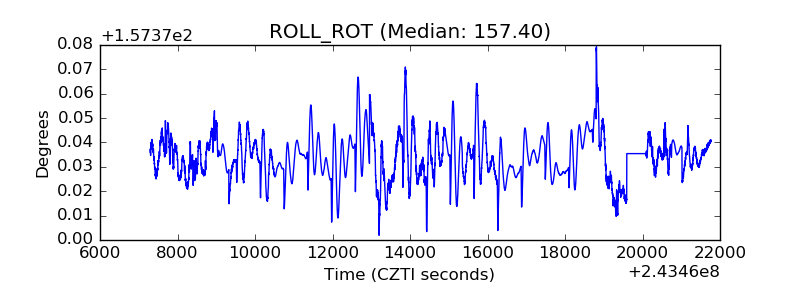 |
| _Roll_DEC | 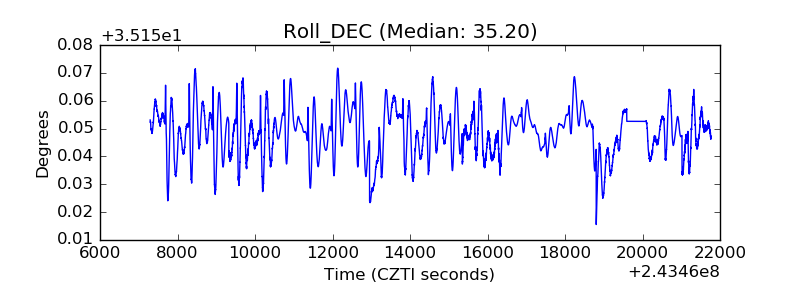 |
| _Roll_RA | 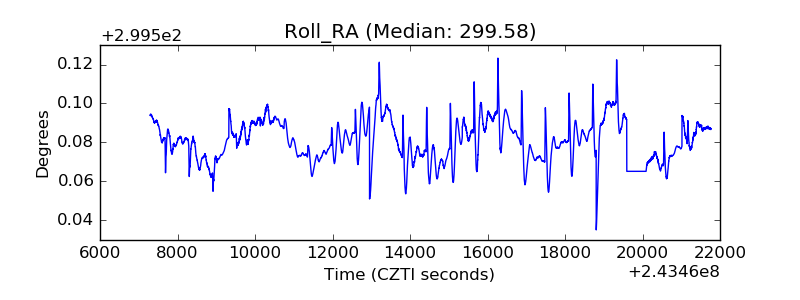 |
| Veto Counter | 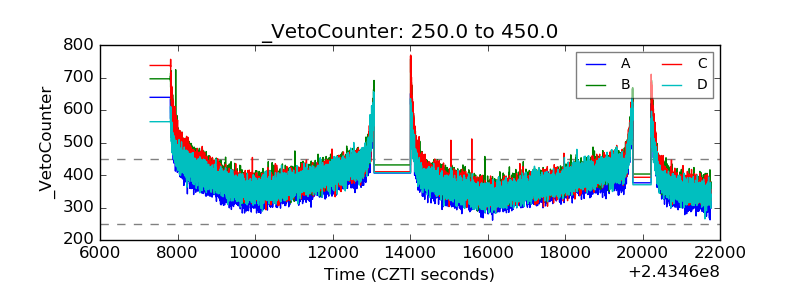 |