| Param | Original file | Final file |
|---|---|---|
| Filename | modeM0/AS1A03_097T01_9000001540_10687cztM0_level2.evt | modeM0/AS1A03_097T01_9000001540_10687cztM0_level2_quad_clean.evt |
| Size (bytes) | 728,769,600 | 100,863,360 |
| Size | 695.0 MB | 96.2 MB |
| Events in quadrant A | 4,729,416 | 633,445 |
| Events in quadrant B | 5,764,949 | 630,642 |
| Events in quadrant C | 4,015,581 | 646,686 |
| Events in quadrant D | 6,984,778 | 552,019 |
| Mode M9 | |||
|---|---|---|---|
| Quadrant | BADHDUFLAG | Total packets | Discarded packets |
| A | 0 | 1 | 0 |
| B | 0 | 1 | 0 |
| C | 0 | 1 | 0 |
| D | 0 | 1 | 0 |
| Mode M0 | |||
|---|---|---|---|
| Quadrant | BADHDUFLAG | Total packets | Discarded packets |
| A | 0 | 20112 | 2 |
| B | 0 | 22706 | 1 |
| C | 0 | 17952 | 1 |
| D | 0 | 26510 | 1 |
| Mode SS | |||
|---|---|---|---|
| Quadrant | BADHDUFLAG | Total packets | Discarded packets |
| A | 0 | 172 | 0 |
| B | 0 | 172 | 0 |
| C | 0 | 172 | 0 |
| D | 0 | 172 | 0 |
| Quadrant | Total seconds | Saturated seconds | Saturation percentage |
|---|---|---|---|
| A | 8504 | 351 | 4.127469% |
| B | 8504 | 878 | 10.324553% |
| C | 8504 | 204 | 2.398871% |
| D | 8504 | 1079 | 12.688147% |
Noise dominated data is calculated using 1-second bins in cleaned event files. If a bin has >2000 counts, and if more than 50% of those come from <1% of pixels, then it is considered to be noise-dominated and hence unusable.
| Quadrant | # 1 sec bins | Bins with >0 counts | Bins with >2000 counts | High rate bins dominated by noise | Noise dominated (total time) | Noise dominated (detector-on time) | Marked lightcurve |
|---|---|---|---|---|---|---|---|
| A | 8624 | 8505 | 1 | 1 | 0.01% | 0.01% | 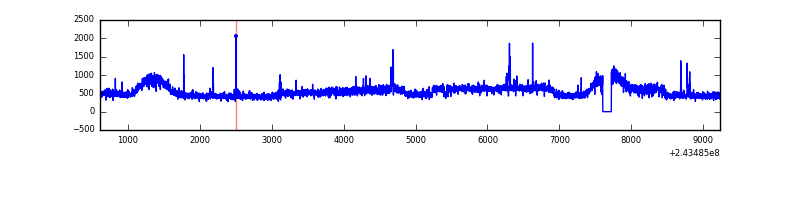 |
| B | 8624 | 8505 | 279 | 279 | 3.24% | 3.28% | 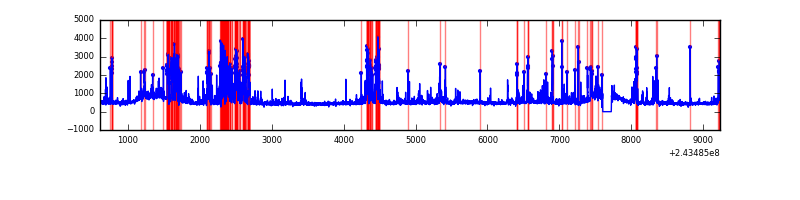 |
| C | 8624 | 8505 | 0 | 0 | 0.00% | 0.00% | 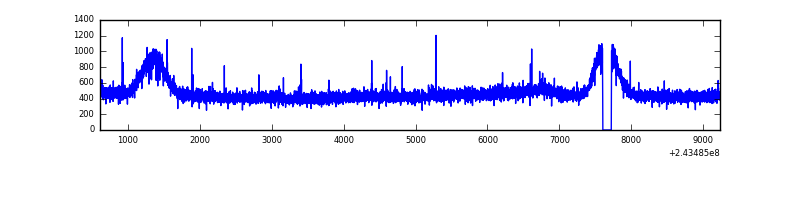 |
| D | 8624 | 8505 | 739 | 739 | 8.57% | 8.69% | 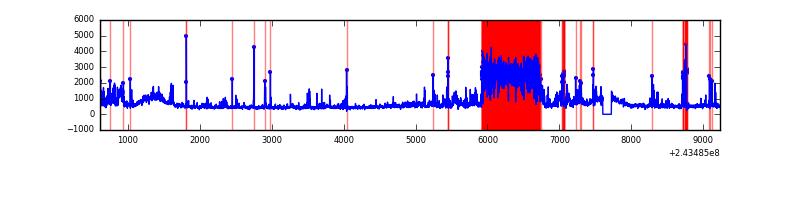 |
Top three noisy pixels from each quadrant. If the there are fewer than three noisy pixels in the level2.evt file, extra rows are filled as -1
| Pixel properties | Quadrant properties | ||||||
|---|---|---|---|---|---|---|---|
| Quadrant | DetID | PixID | Counts | Sigma | Mean | Median | Sigma |
| A | 15 | 239 | 629462 | 2950.58 | 1036 | 1009 | 213.0 |
| A | 14 | 254 | 56988 | 262.82 | 1036 | 1009 | 213.0 |
| A | 15 | 174 | 22923 | 102.89 | 1036 | 1009 | 213.0 |
| B | 4 | 239 | 1072379 | 5410.79 | 1020 | 993 | 198.0 |
| B | 0 | 85 | 474999 | 2393.86 | 1020 | 993 | 198.0 |
| B | 4 | 81 | 71089 | 354.0 | 1020 | 993 | 198.0 |
| C | 13 | 61 | 7679 | 27.79 | 1023 | 1028 | 239.3 |
| C | 14 | 234 | 6589 | 23.24 | 1023 | 1028 | 239.3 |
| C | 8 | 222 | 5620 | 19.19 | 1023 | 1028 | 239.3 |
| D | 10 | 199 | 1950687 | 8470.89 | 956 | 927 | 230.2 |
| D | 2 | 16 | 500261 | 2169.4 | 956 | 927 | 230.2 |
| D | 8 | 195 | 424989 | 1842.37 | 956 | 927 | 230.2 |
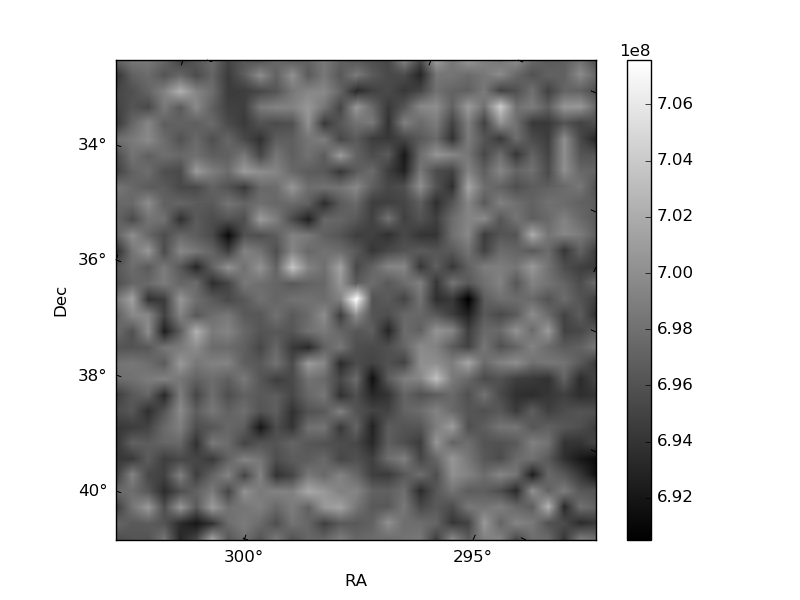
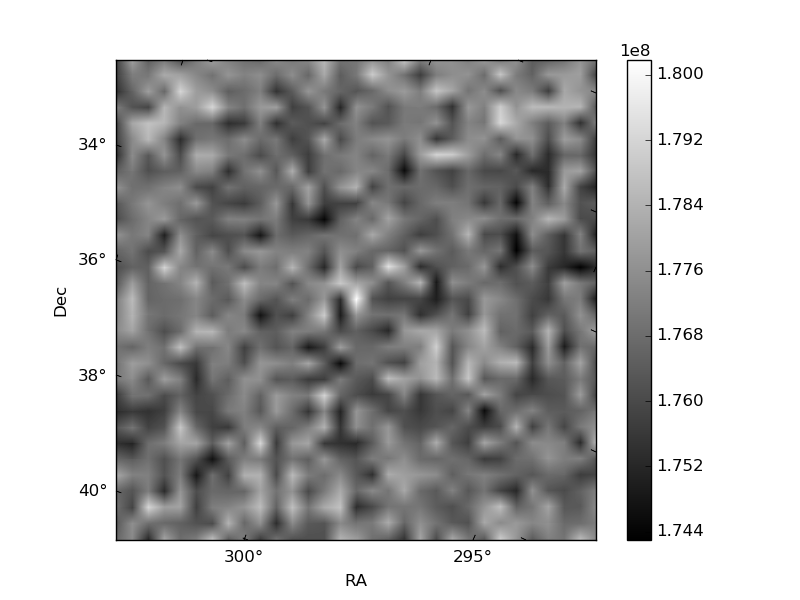
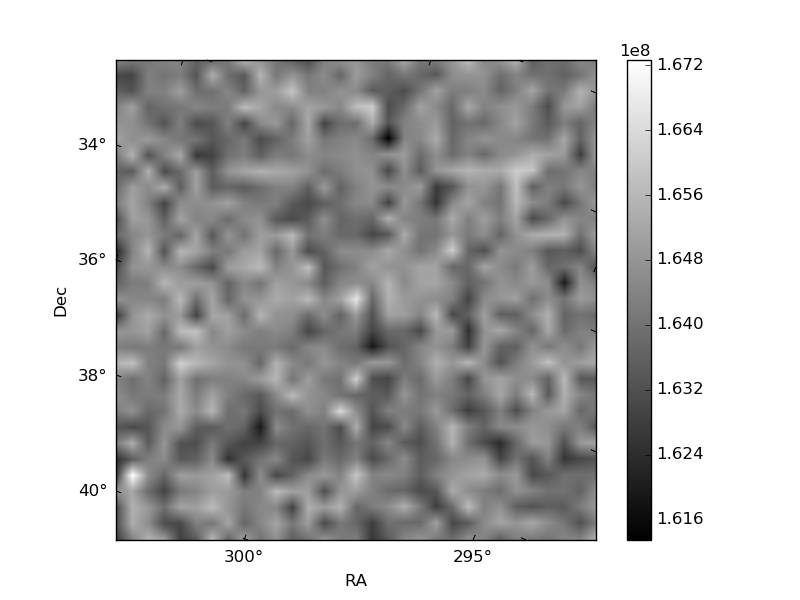
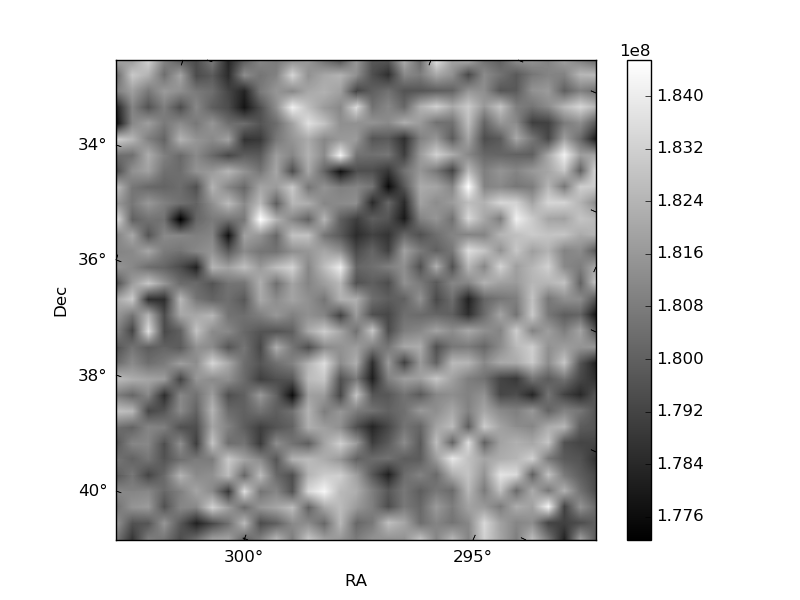
Histogram calculated using DETX and DETY for each event in the final _common_clean file
| Quadrant A | 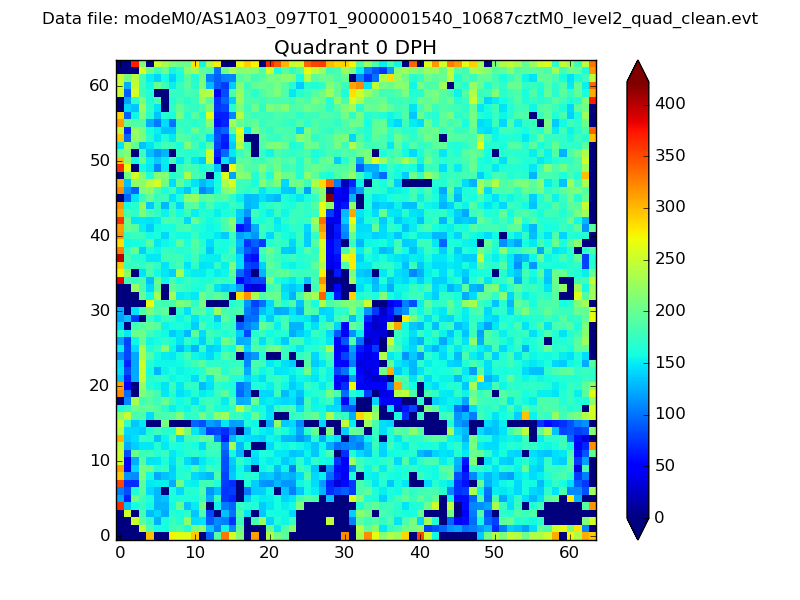 |
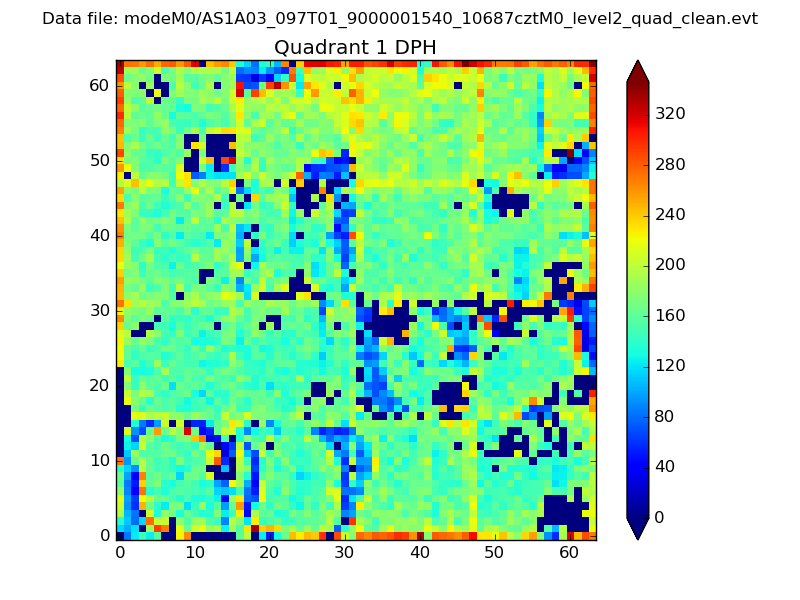 |
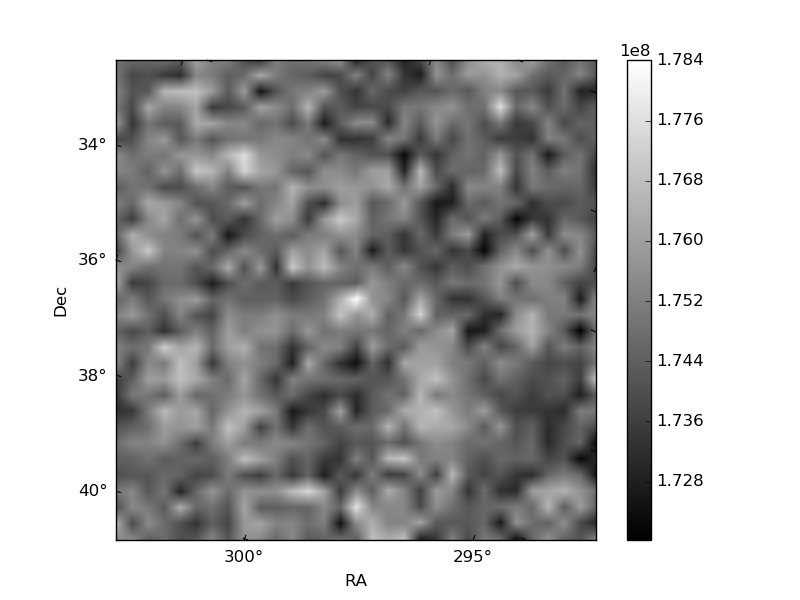
Quadrant B |
|---|---|---|---|
| Quadrant D | 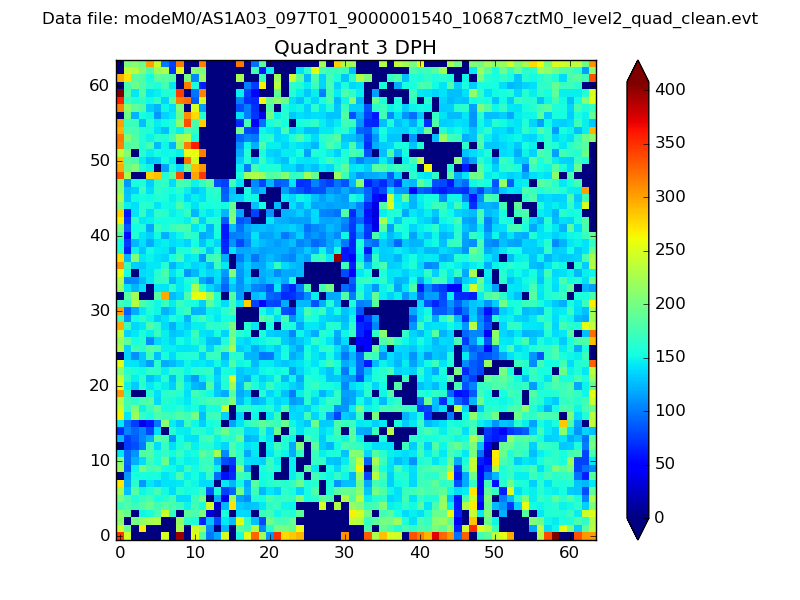 |
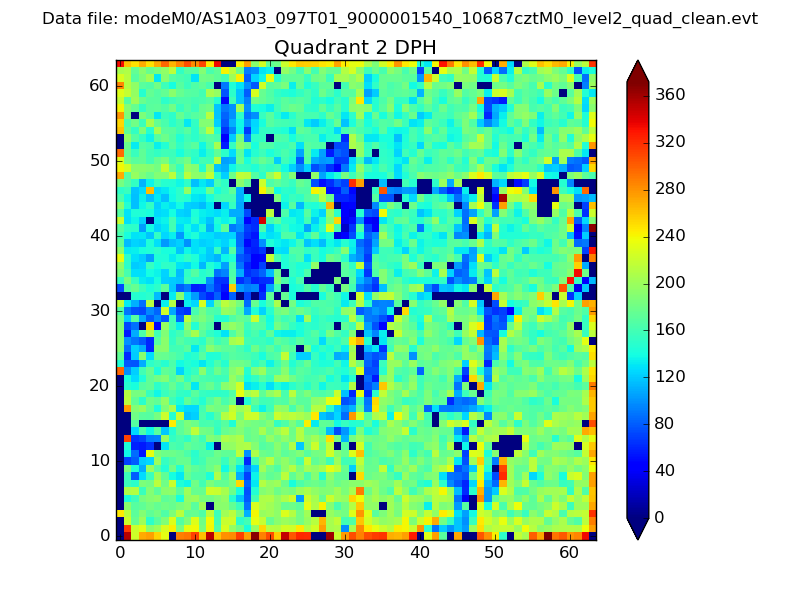 |
Quadrant C |
| Plot type | Count rate plots | Images |
|---|---|---|
| Comparison with Poisson distribution Blue bars denote a histogram of data divided into 1 sec bins. Red curve is a Poisson curve with rate = median count rate of data. |
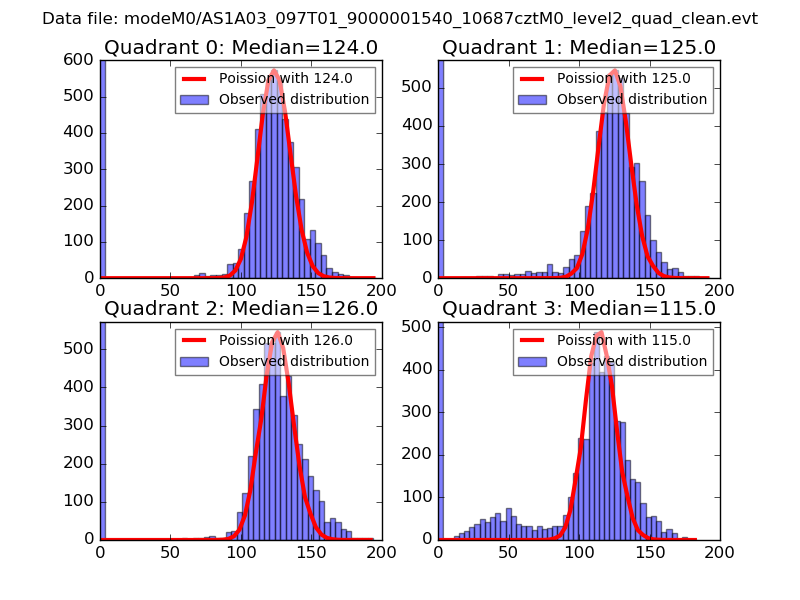 |
 |
| Quadrant-wise count rates Data is divided into 100 sec bins |
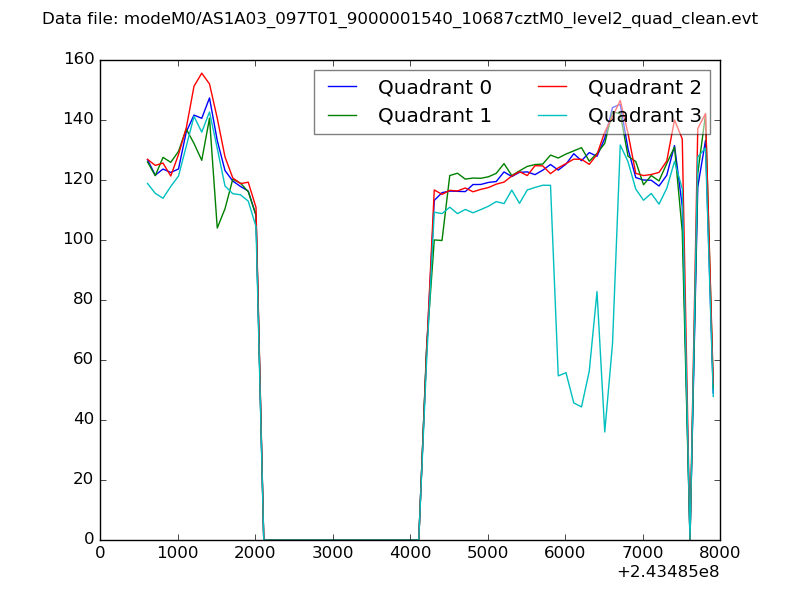 |
|
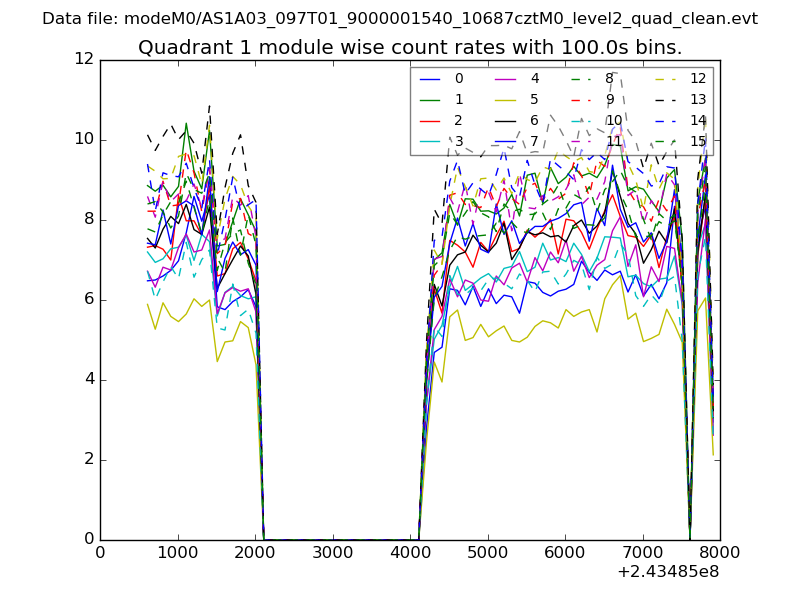
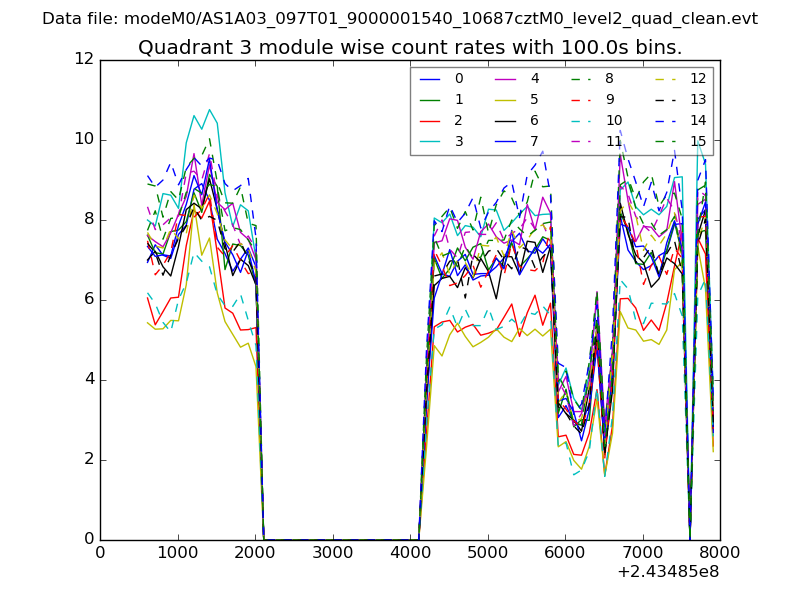
| Module-wise count rates for Quadrant A Data is divided into 100 sec bins |
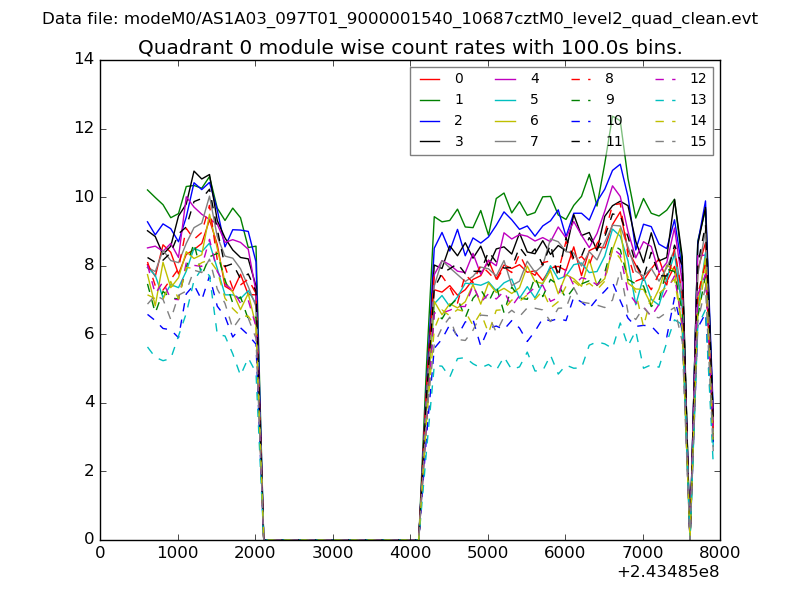 |
 |
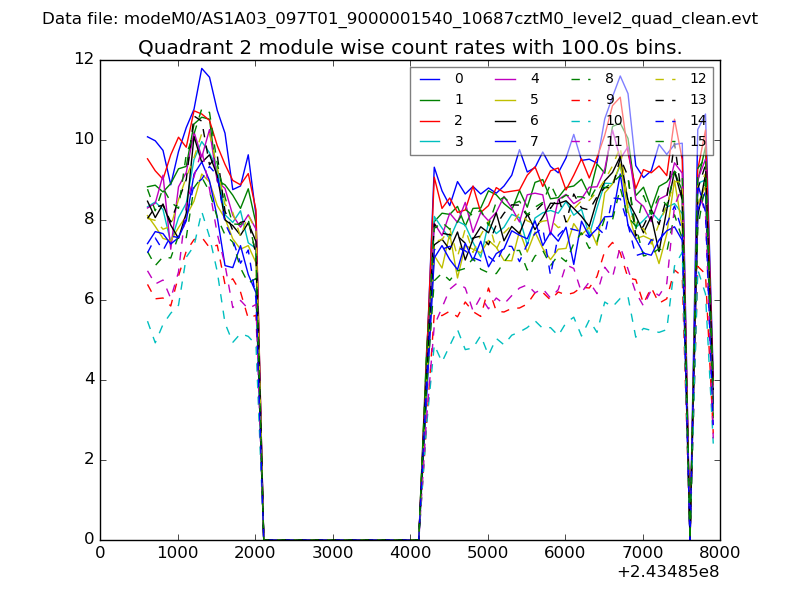
| Module-wise count rates for Quadrant B Data is divided into 100 sec bins |
 |
 |
| Module-wise count rates for Quadrant C Data is divided into 100 sec bins |
 |
 |
| Module-wise count rates for Quadrant D Data is divided into 100 sec bins |
 |
 |
| Parameter | Plot |
|---|---|
| CZT HV Monitor | 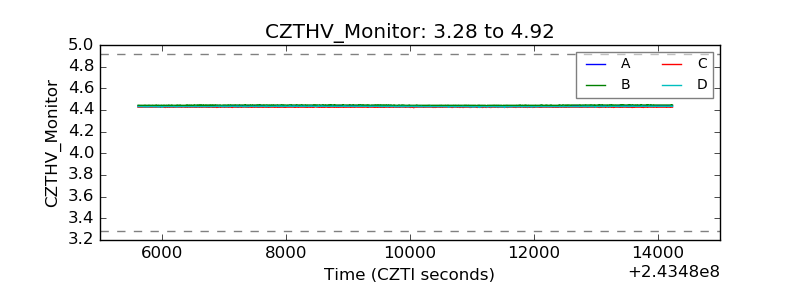 |
| D_VDD | 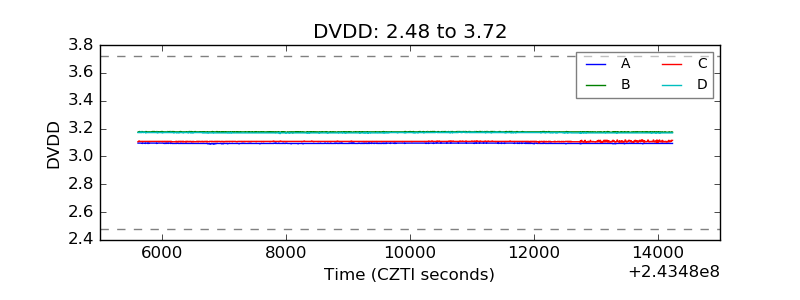 |
| Temperature 1 | 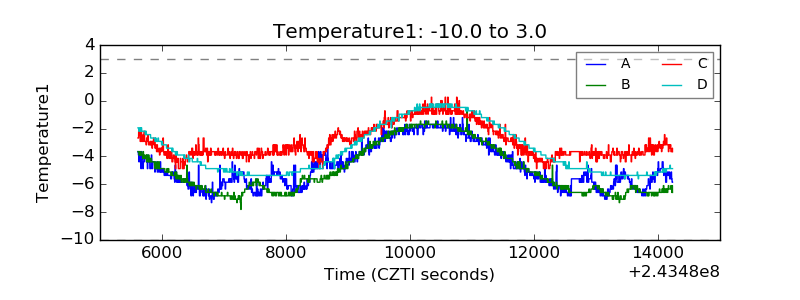 |
| Veto HV Monitor | 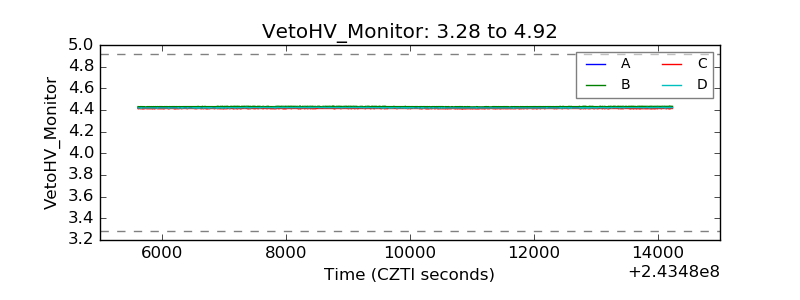 |
| Veto LLD | 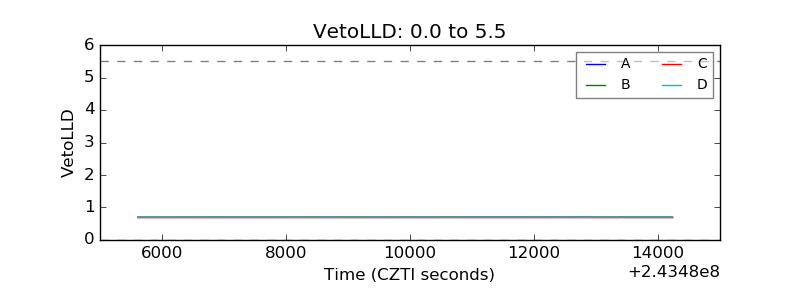 |
| Alpha Counter | 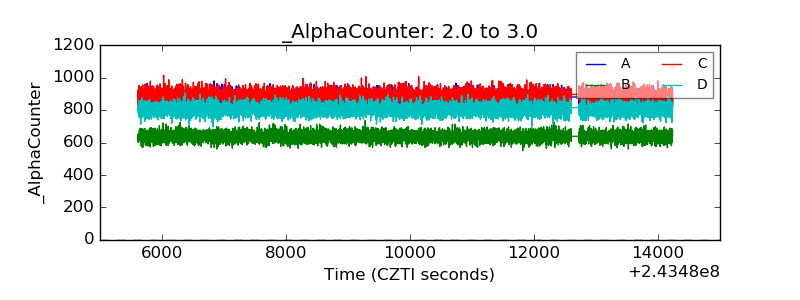 |
| _CPM_Rate | 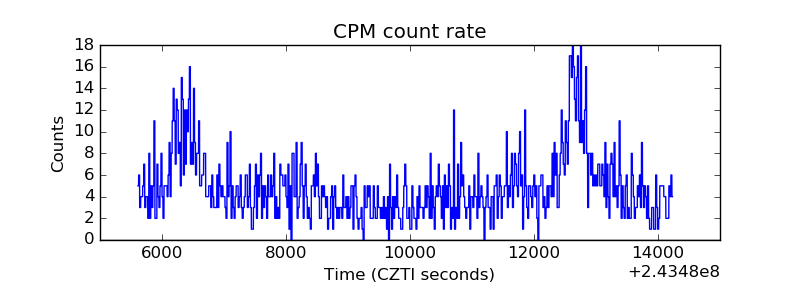 |
| CZT Counter | 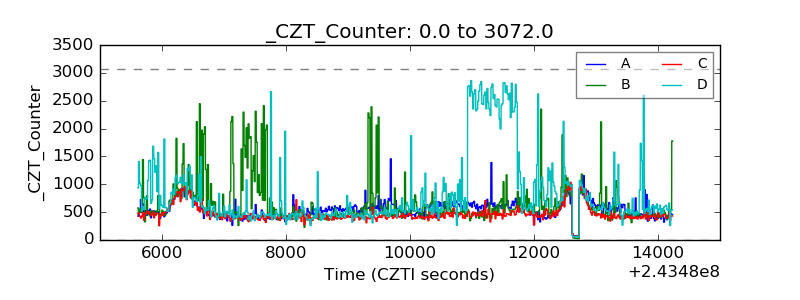 |
| +2.5 Volts monitor |  |
| +5 Volts monitor |  |
| _ROLL_ROT | 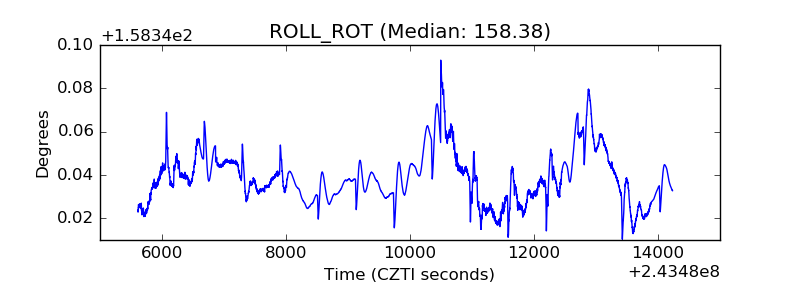 |
| _Roll_DEC | 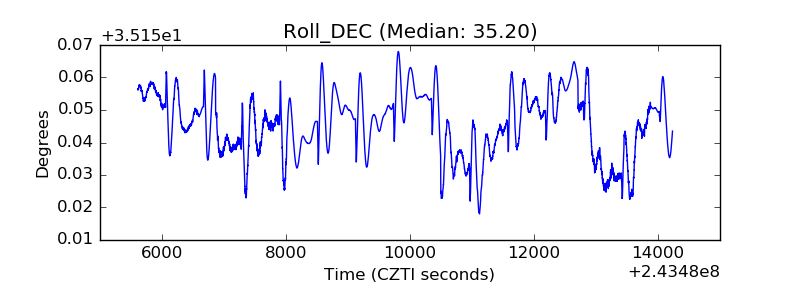 |
| _Roll_RA | 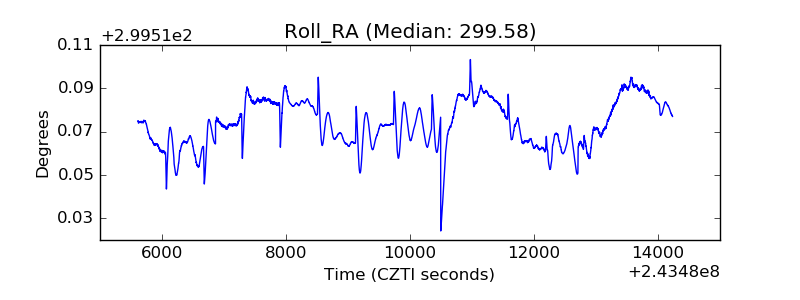 |
| Veto Counter | 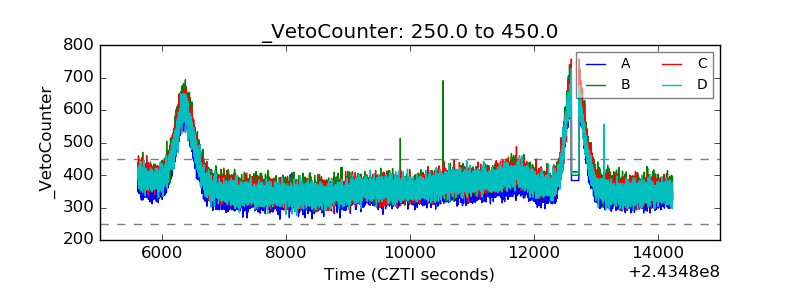 |