| Param | Original file | Final file |
|---|---|---|
| Filename | modeM0/AS1A03_097T01_9000001540_10691cztM0_level2.evt | modeM0/AS1A03_097T01_9000001540_10691cztM0_level2_quad_clean.evt |
| Size (bytes) | 474,220,800 | 88,413,120 |
| Size | 452.3 MB | 84.3 MB |
| Events in quadrant A | 2,857,836 | 576,992 |
| Events in quadrant B | 3,583,572 | 577,381 |
| Events in quadrant C | 2,653,939 | 571,847 |
| Events in quadrant D | 4,859,871 | 532,796 |
| Mode M9 | |||
|---|---|---|---|
| Quadrant | BADHDUFLAG | Total packets | Discarded packets |
| A | 0 | 9 | 0 |
| B | 0 | 9 | 0 |
| C | 0 | 9 | 0 |
| D | 0 | 9 | 0 |
| Mode M0 | |||
|---|---|---|---|
| Quadrant | BADHDUFLAG | Total packets | Discarded packets |
| A | 0 | 12493 | 2 |
| B | 0 | 14548 | 1 |
| C | 0 | 12121 | 1 |
| D | 0 | 18599 | 1 |
| Mode SS | |||
|---|---|---|---|
| Quadrant | BADHDUFLAG | Total packets | Discarded packets |
| A | 0 | 124 | 0 |
| B | 0 | 124 | 0 |
| C | 0 | 124 | 0 |
| D | 0 | 124 | 0 |
| Quadrant | Total seconds | Saturated seconds | Saturation percentage |
|---|---|---|---|
| A | 5982 | 70 | 1.170177% |
| B | 5982 | 198 | 3.309930% |
| C | 5982 | 43 | 0.718823% |
| D | 5982 | 227 | 3.794717% |
Noise dominated data is calculated using 1-second bins in cleaned event files. If a bin has >2000 counts, and if more than 50% of those come from <1% of pixels, then it is considered to be noise-dominated and hence unusable.
| Quadrant | # 1 sec bins | Bins with >0 counts | Bins with >2000 counts | High rate bins dominated by noise | Noise dominated (total time) | Noise dominated (detector-on time) | Marked lightcurve |
|---|---|---|---|---|---|---|---|
| A | 6922 | 5982 | 2 | 2 | 0.03% | 0.03% | 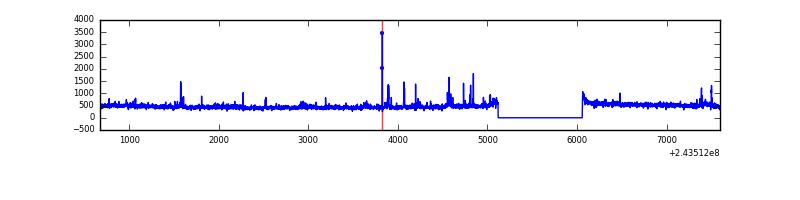 |
| B | 6922 | 5983 | 96 | 96 | 1.39% | 1.60% | 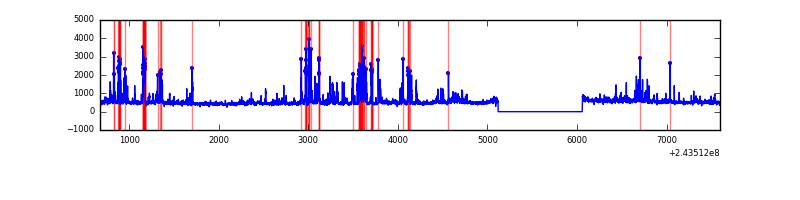 |
| C | 6922 | 5983 | 0 | 0 | 0.00% | 0.00% | 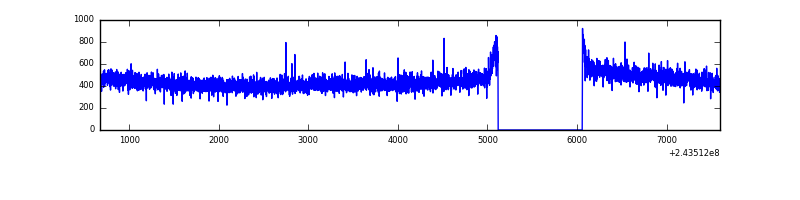 |
| D | 6922 | 5982 | 144 | 144 | 2.08% | 2.41% | 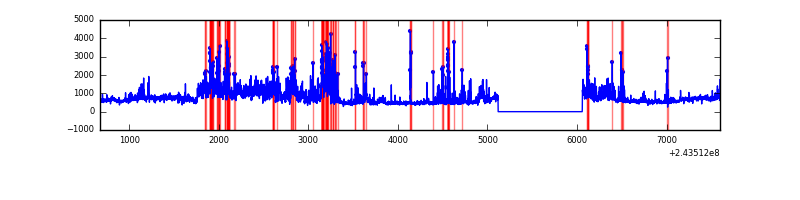 |
Top three noisy pixels from each quadrant. If the there are fewer than three noisy pixels in the level2.evt file, extra rows are filled as -1
| Pixel properties | Quadrant properties | ||||||
|---|---|---|---|---|---|---|---|
| Quadrant | DetID | PixID | Counts | Sigma | Mean | Median | Sigma |
| A | 15 | 174 | 53044 | 365.49 | 701 | 686 | 143.3 |
| A | 14 | 254 | 38769 | 265.84 | 701 | 686 | 143.3 |
| A | 1 | 162 | 23472 | 159.06 | 701 | 686 | 143.3 |
| B | 4 | 239 | 640459 | 4761.87 | 698 | 681 | 134.4 |
| B | 15 | 204 | 53223 | 391.07 | 698 | 681 | 134.4 |
| B | 4 | 81 | 45911 | 336.65 | 698 | 681 | 134.4 |
| C | 13 | 61 | 5054 | 27.54 | 679 | 682 | 158.7 |
| C | 14 | 234 | 3801 | 19.65 | 679 | 682 | 158.7 |
| C | 14 | 67 | 1684 | 6.31 | 679 | 682 | 158.7 |
| D | 10 | 199 | 761192 | 4699.17 | 670 | 649 | 161.8 |
| D | 2 | 16 | 527712 | 3256.56 | 670 | 649 | 161.8 |
| D | 12 | 233 | 255636 | 1575.49 | 670 | 649 | 161.8 |
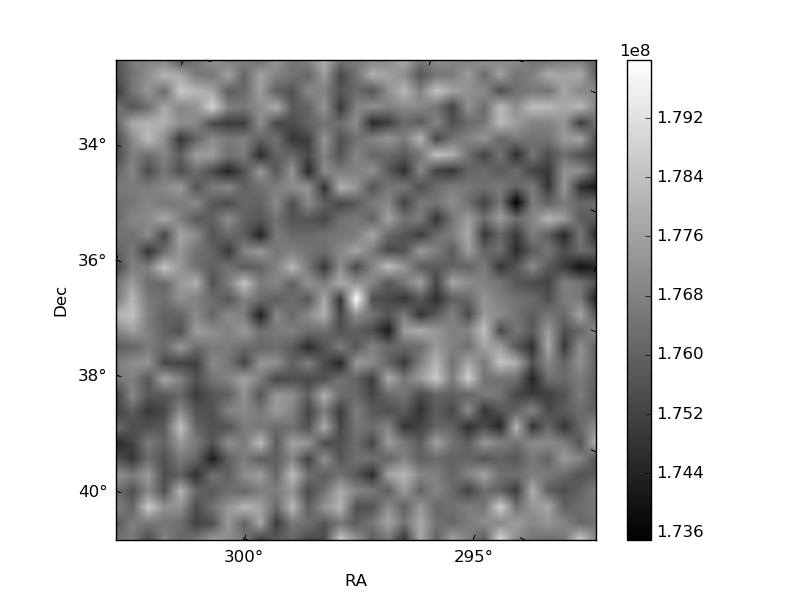
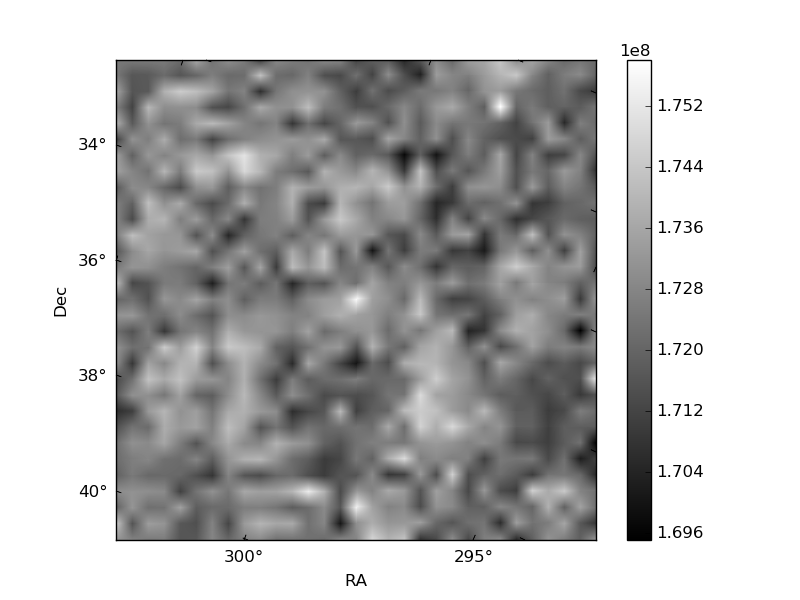
Histogram calculated using DETX and DETY for each event in the final _common_clean file
| Quadrant A | 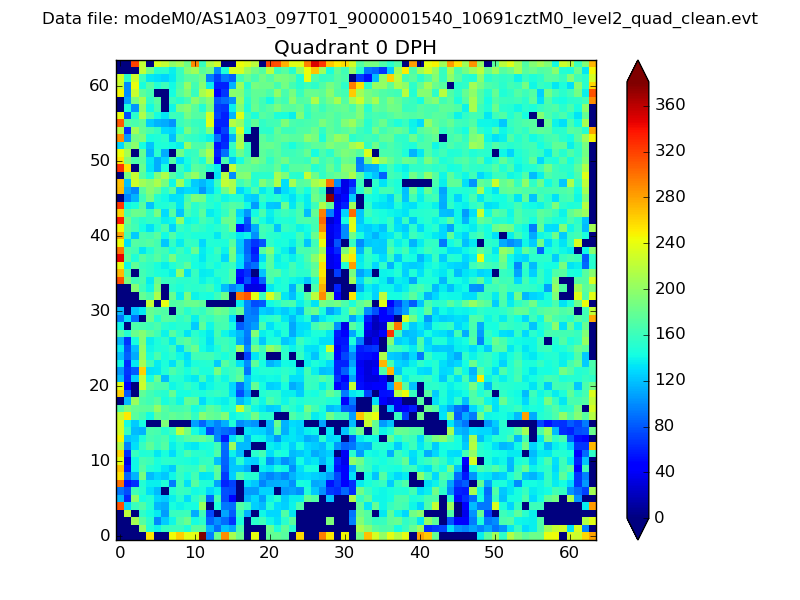 |
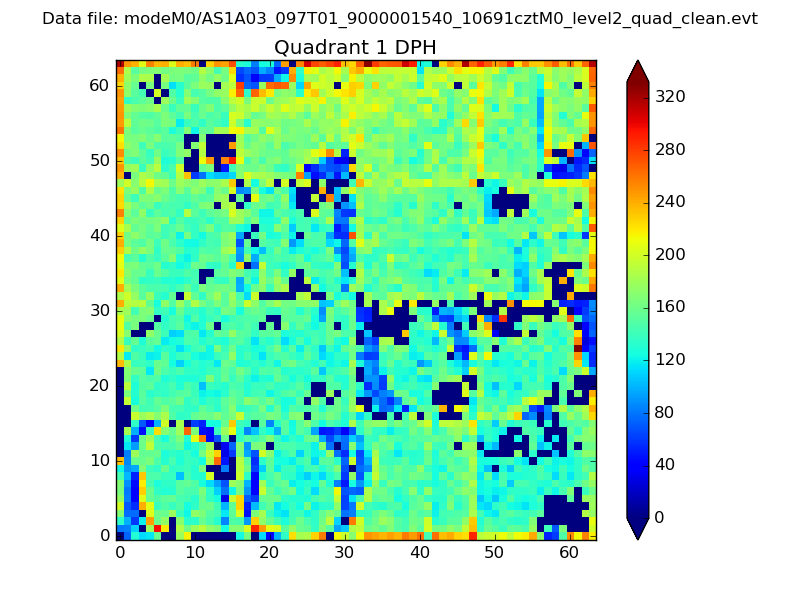 |
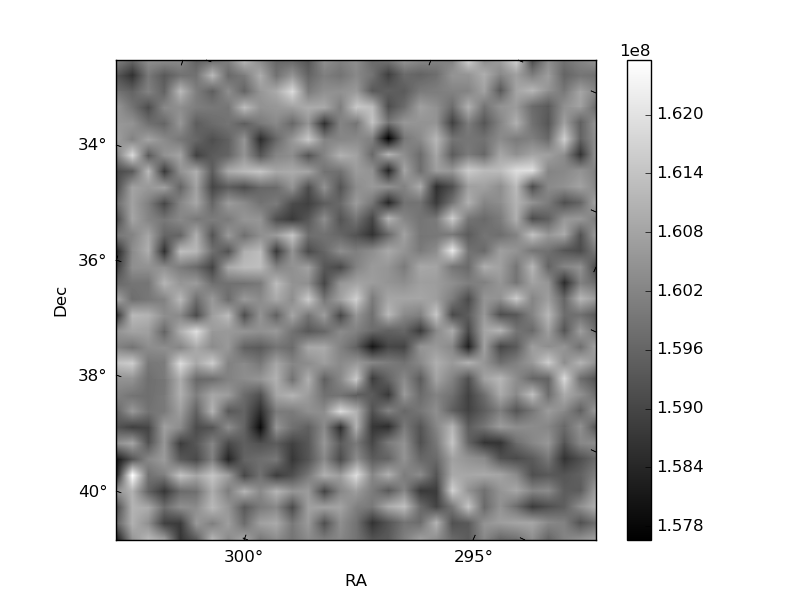
Quadrant B |
|---|---|---|---|
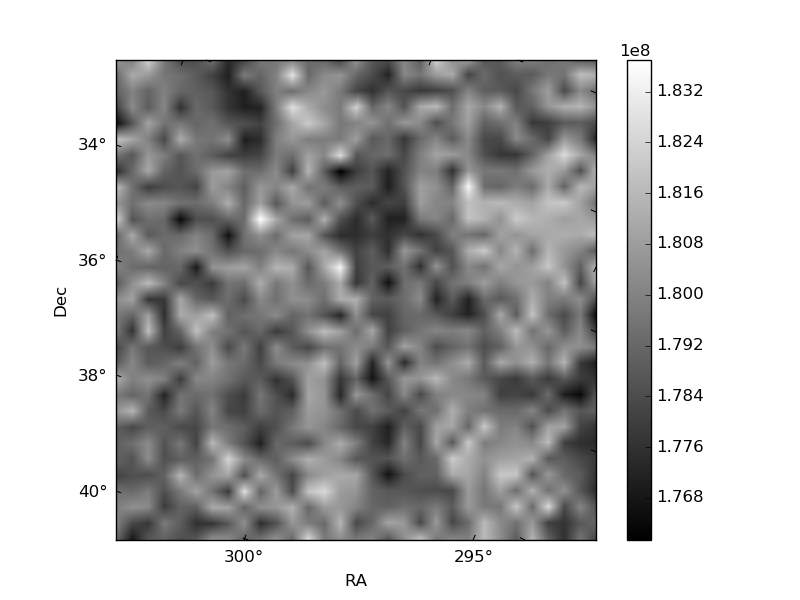
| Quadrant D | 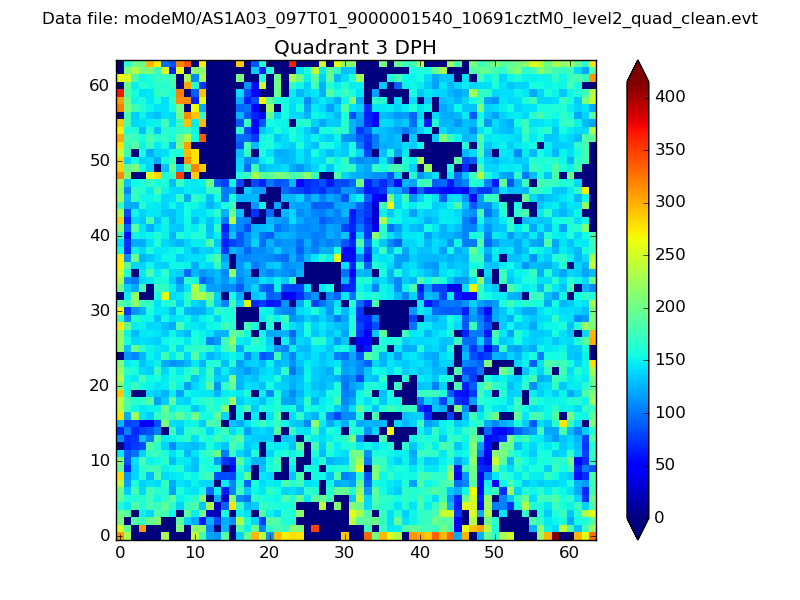 |
 |
Quadrant C |
| Plot type | Count rate plots | Images |
|---|---|---|
| Comparison with Poisson distribution Blue bars denote a histogram of data divided into 1 sec bins. Red curve is a Poisson curve with rate = median count rate of data. |
 |
 |
| Quadrant-wise count rates Data is divided into 100 sec bins |
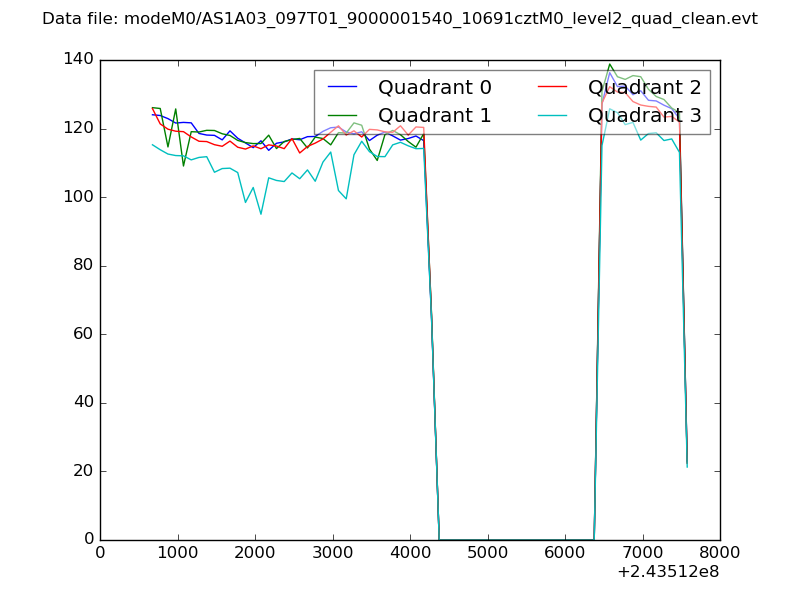 |
|
| Module-wise count rates for Quadrant A Data is divided into 100 sec bins |
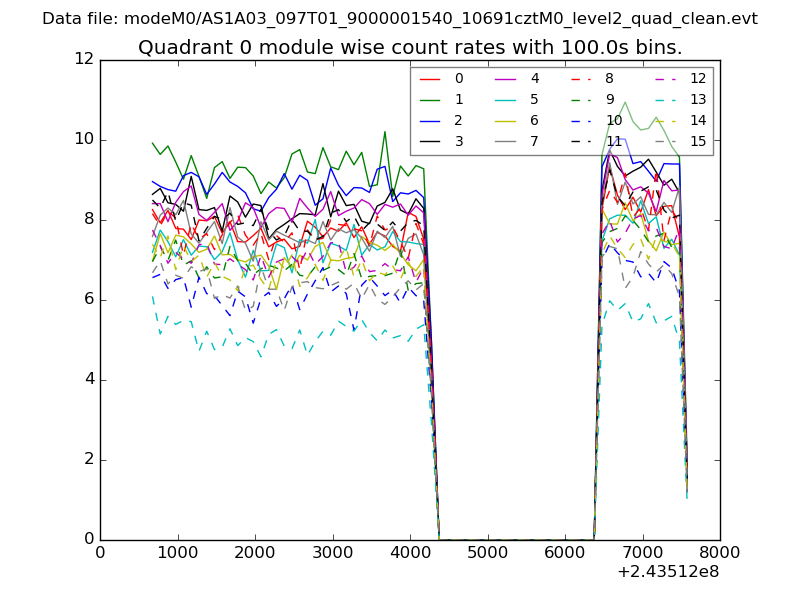 |
 |
| Module-wise count rates for Quadrant B Data is divided into 100 sec bins |
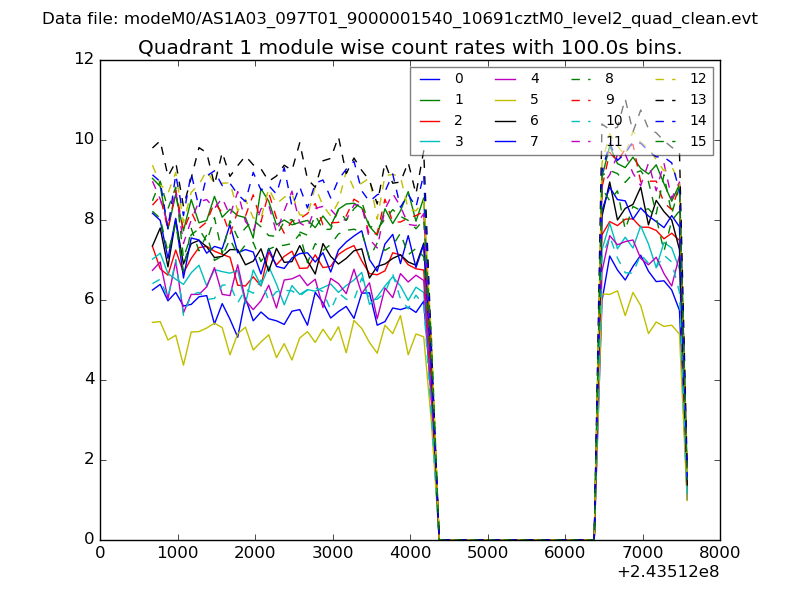 |
 |
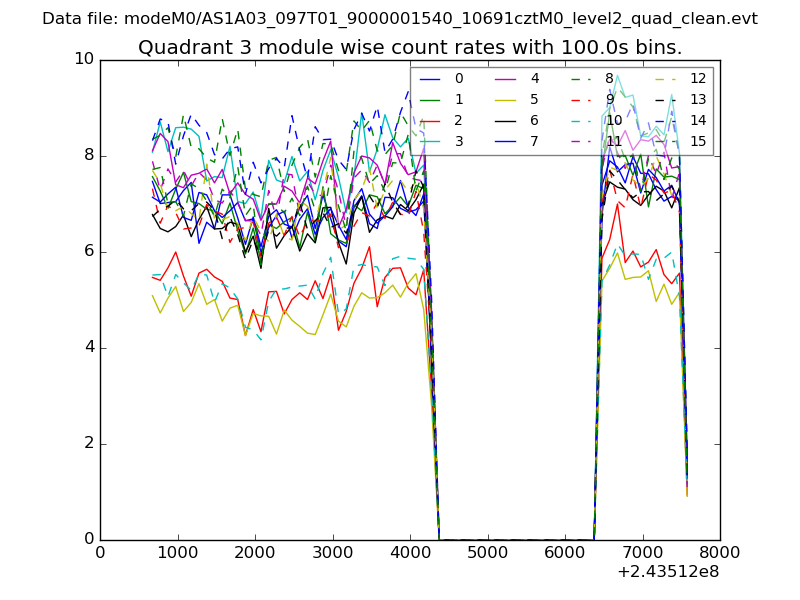
| Module-wise count rates for Quadrant C Data is divided into 100 sec bins |
 |
 |
| Module-wise count rates for Quadrant D Data is divided into 100 sec bins |
 |
 |
| Parameter | Plot |
|---|---|
| CZT HV Monitor |  |
| D_VDD | 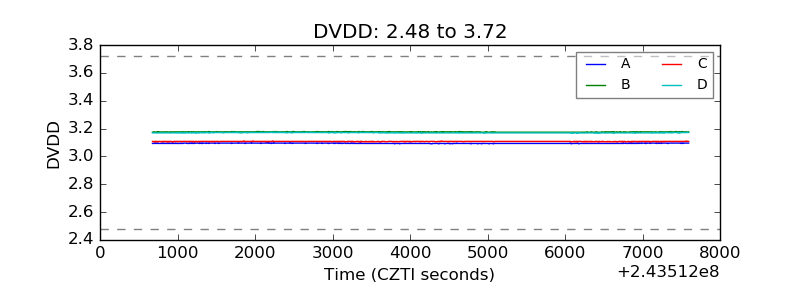 |
| Temperature 1 | 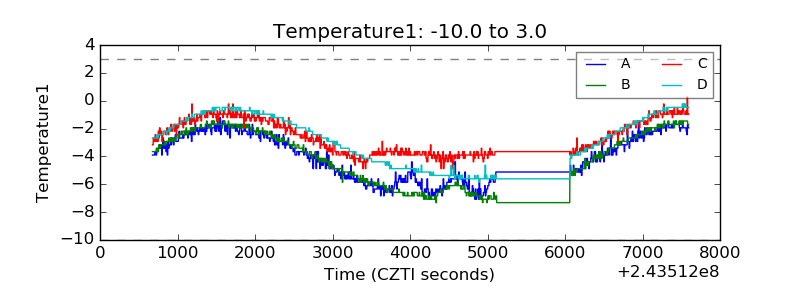 |
| Veto HV Monitor | 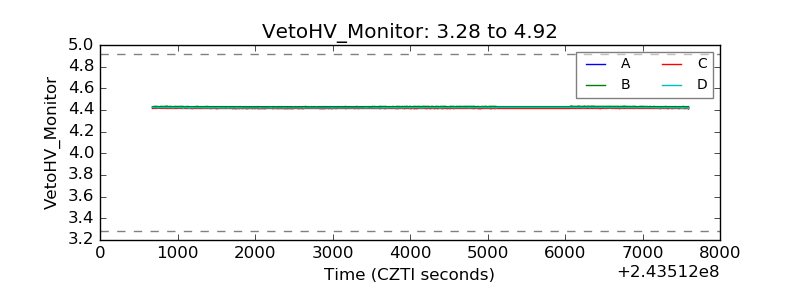 |
| Veto LLD | 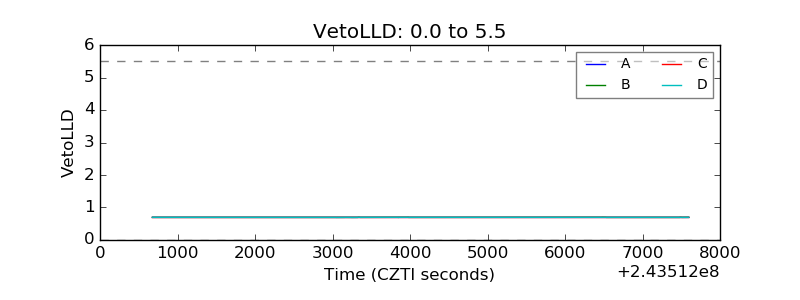 |
| Alpha Counter |  |
| _CPM_Rate | 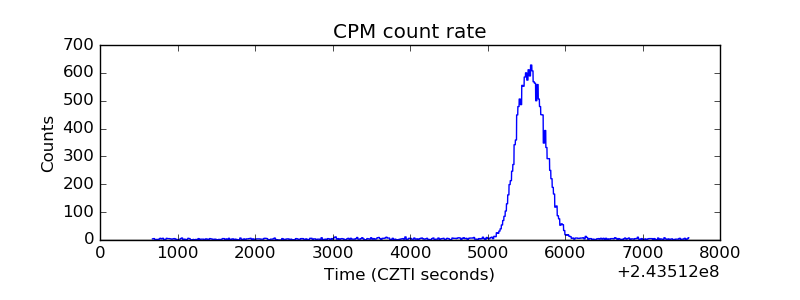 |
| CZT Counter |  |
| +2.5 Volts monitor |  |
| +5 Volts monitor |  |
| _ROLL_ROT | 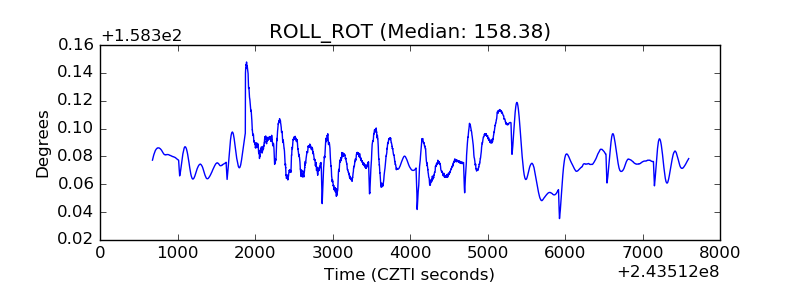 |
| _Roll_DEC | 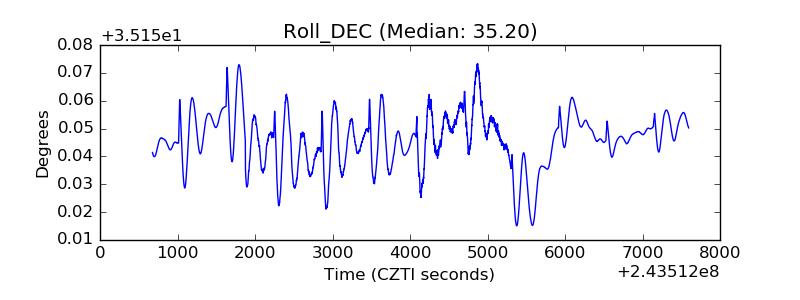 |
| _Roll_RA | 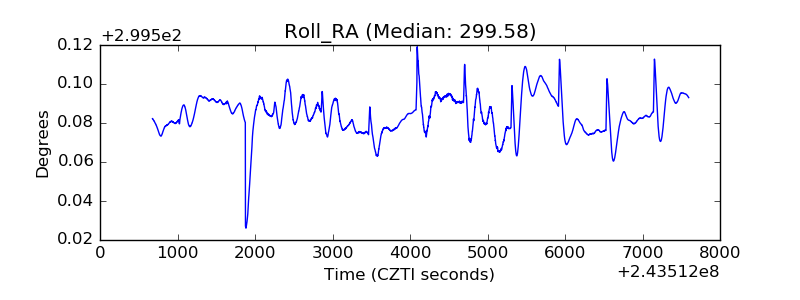 |
| Veto Counter | 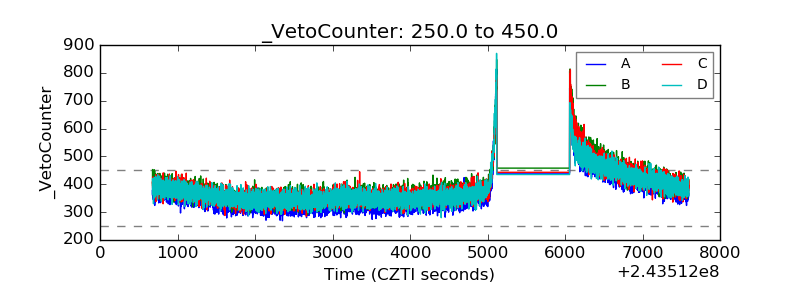 |