| Param | Original file | Final file |
|---|---|---|
| Filename | modeM0/AS1A03_097T01_9000001540_10693cztM0_level2.evt | modeM0/AS1A03_097T01_9000001540_10693cztM0_level2_quad_clean.evt |
| Size (bytes) | 497,062,080 | 89,732,160 |
| Size | 474.0 MB | 85.6 MB |
| Events in quadrant A | 2,790,414 | 595,781 |
| Events in quadrant B | 3,642,345 | 595,851 |
| Events in quadrant C | 2,592,423 | 591,311 |
| Events in quadrant D | 5,641,118 | 535,027 |
| Mode M9 | |||
|---|---|---|---|
| Quadrant | BADHDUFLAG | Total packets | Discarded packets |
| A | 0 | 11 | 0 |
| B | 0 | 11 | 0 |
| C | 0 | 11 | 0 |
| D | 0 | 11 | 0 |
| Mode M0 | |||
|---|---|---|---|
| Quadrant | BADHDUFLAG | Total packets | Discarded packets |
| A | 0 | 12156 | 2 |
| B | 0 | 14571 | 1 |
| C | 0 | 11724 | 1 |
| D | 0 | 20750 | 1 |
| Mode SS | |||
|---|---|---|---|
| Quadrant | BADHDUFLAG | Total packets | Discarded packets |
| A | 0 | 116 | 0 |
| B | 0 | 116 | 0 |
| C | 0 | 116 | 0 |
| D | 0 | 116 | 0 |
| Quadrant | Total seconds | Saturated seconds | Saturation percentage |
|---|---|---|---|
| A | 5711 | 75 | 1.313255% |
| B | 5711 | 246 | 4.307477% |
| C | 5711 | 44 | 0.770443% |
| D | 5711 | 541 | 9.472947% |
Noise dominated data is calculated using 1-second bins in cleaned event files. If a bin has >2000 counts, and if more than 50% of those come from <1% of pixels, then it is considered to be noise-dominated and hence unusable.
| Quadrant | # 1 sec bins | Bins with >0 counts | Bins with >2000 counts | High rate bins dominated by noise | Noise dominated (total time) | Noise dominated (detector-on time) | Marked lightcurve |
|---|---|---|---|---|---|---|---|
| A | 6796 | 5711 | 3 | 3 | 0.04% | 0.05% | 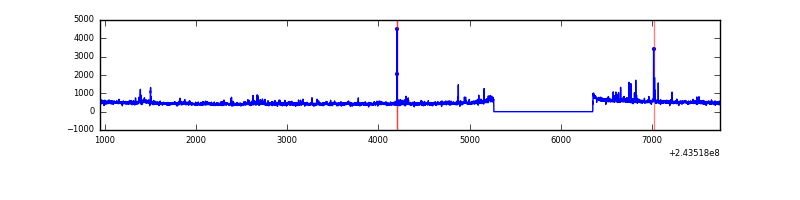 |
| B | 6796 | 5711 | 122 | 122 | 1.80% | 2.14% | 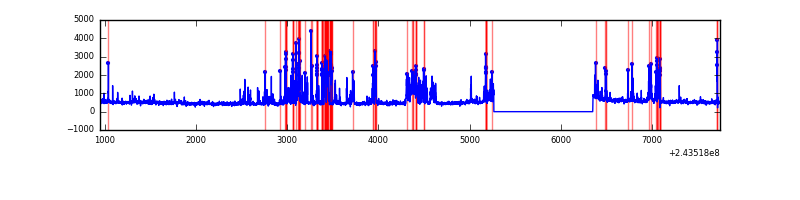 |
| C | 6796 | 5711 | 1 | 1 | 0.01% | 0.02% | 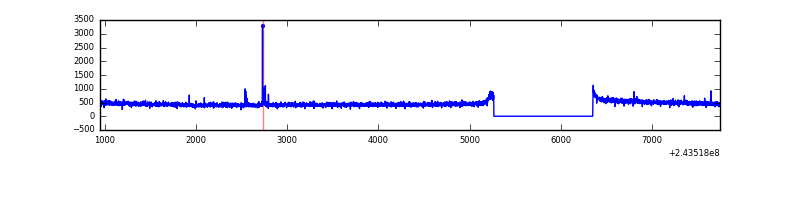 |
| D | 6796 | 5711 | 453 | 453 | 6.67% | 7.93% | 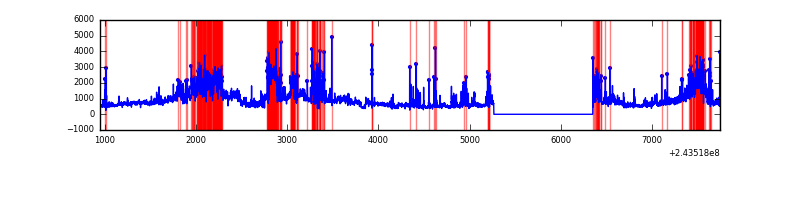 |
Top three noisy pixels from each quadrant. If the there are fewer than three noisy pixels in the level2.evt file, extra rows are filled as -1
| Pixel properties | Quadrant properties | ||||||
|---|---|---|---|---|---|---|---|
| Quadrant | DetID | PixID | Counts | Sigma | Mean | Median | Sigma |
| A | 8 | 5 | 68472 | 490.66 | 680 | 666 | 138.2 |
| A | 15 | 174 | 49172 | 351.0 | 680 | 666 | 138.2 |
| A | 1 | 162 | 20494 | 143.48 | 680 | 666 | 138.2 |
| B | 4 | 239 | 866475 | 6801.09 | 671 | 656 | 127.3 |
| B | 0 | 214 | 46325 | 358.73 | 671 | 656 | 127.3 |
| B | 0 | 219 | 25621 | 196.1 | 671 | 656 | 127.3 |
| C | 14 | 234 | 17520 | 110.06 | 660 | 663 | 153.2 |
| C | 13 | 61 | 4859 | 27.4 | 660 | 663 | 153.2 |
| C | 8 | 222 | 2068 | 9.17 | 660 | 663 | 153.2 |
| D | 2 | 16 | 1505455 | 9821.95 | 637 | 620 | 153.2 |
| D | 1 | 52 | 566147 | 3691.15 | 637 | 620 | 153.2 |
| D | 10 | 199 | 562698 | 3668.64 | 637 | 620 | 153.2 |
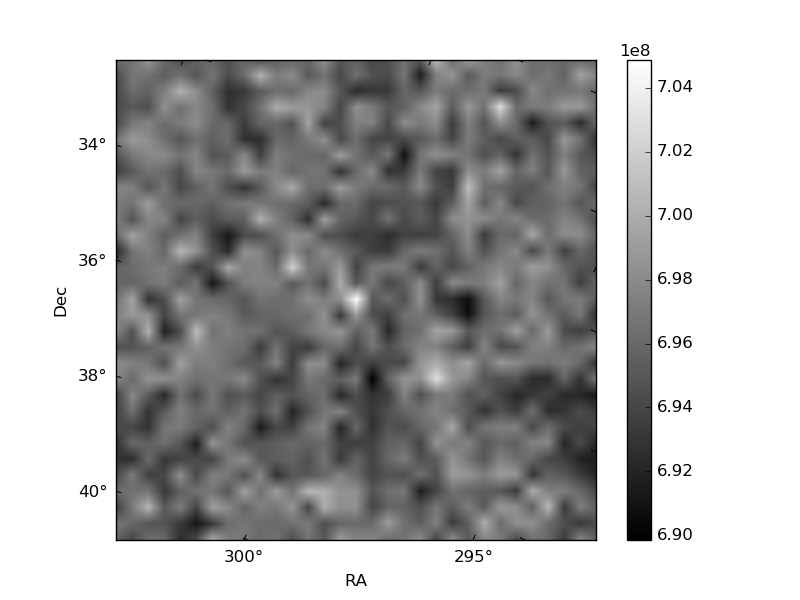
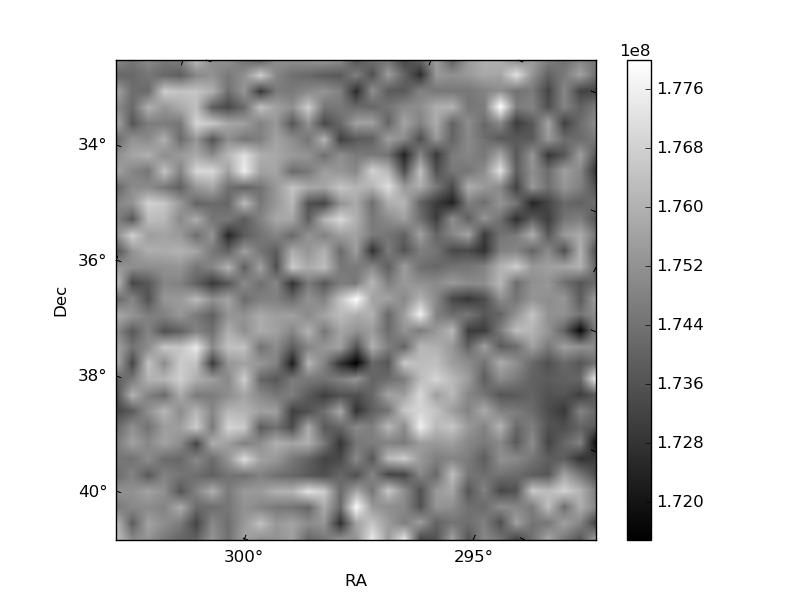
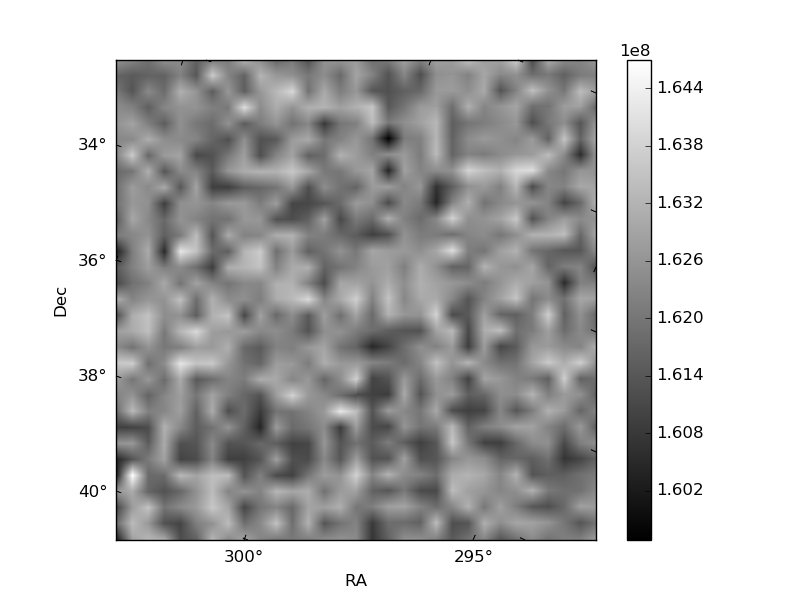
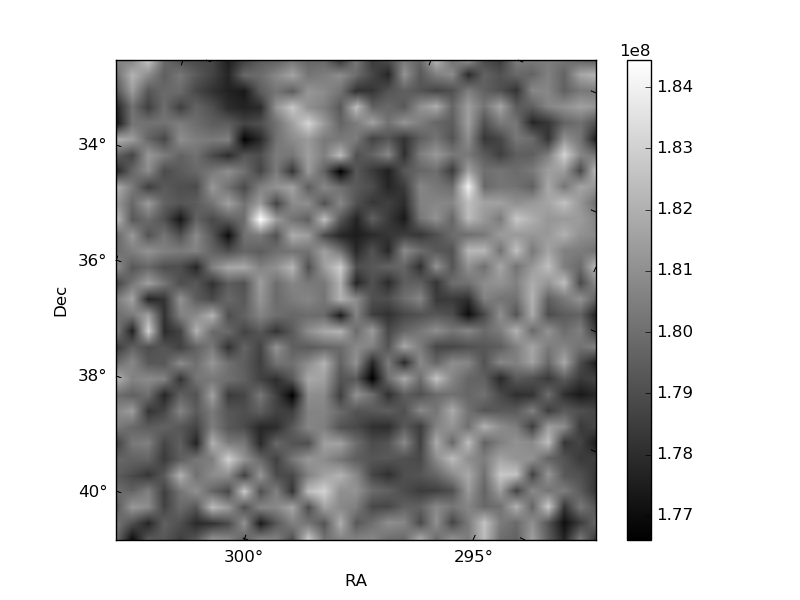
Histogram calculated using DETX and DETY for each event in the final _common_clean file
| Quadrant A | 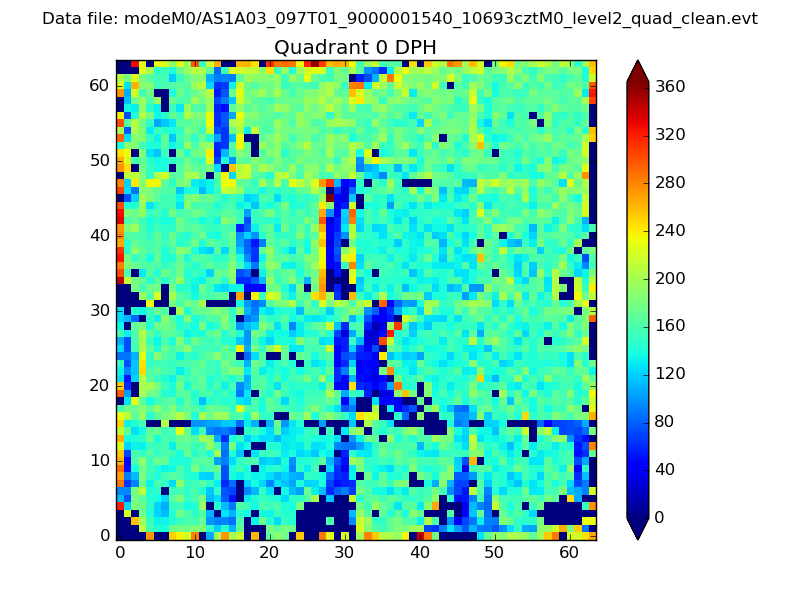 |
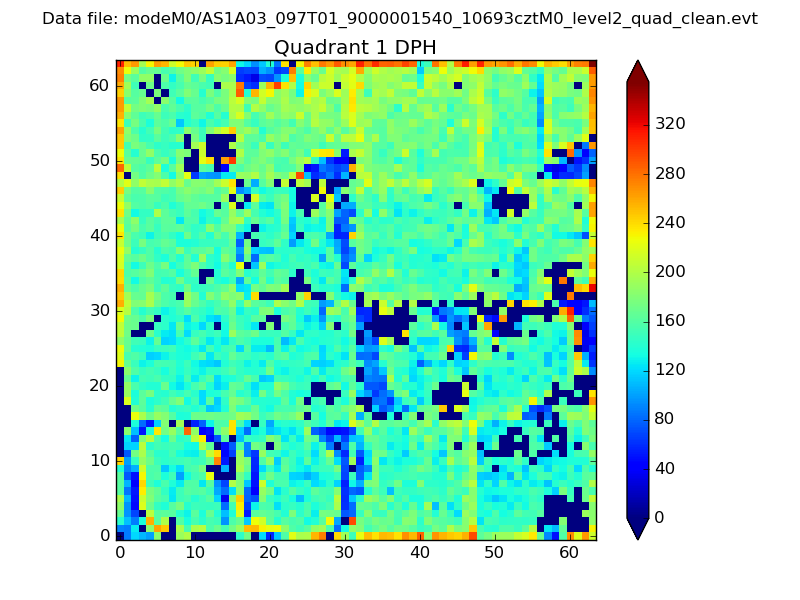 |
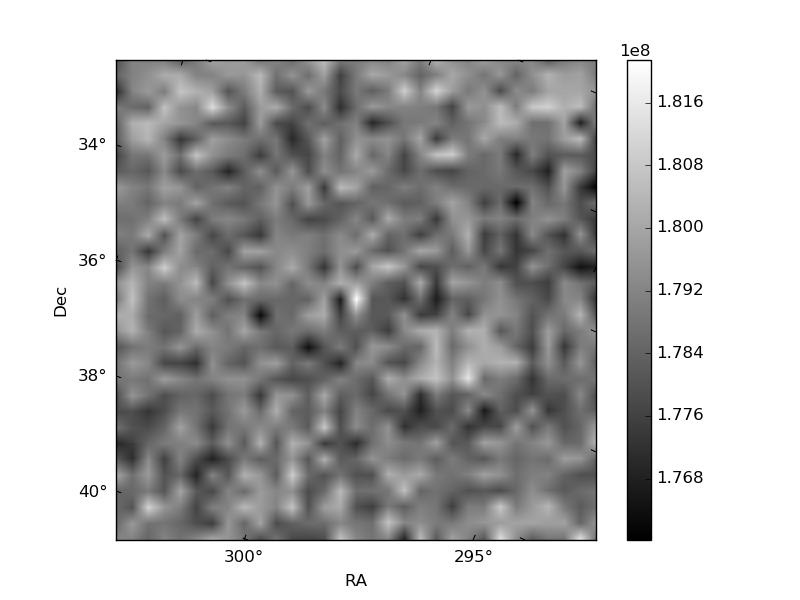
Quadrant B |
|---|---|---|---|
| Quadrant D | 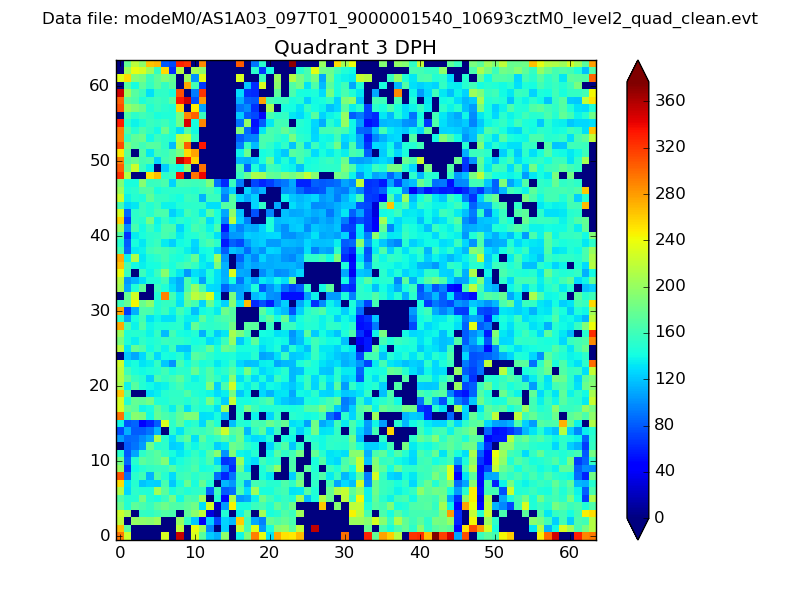 |
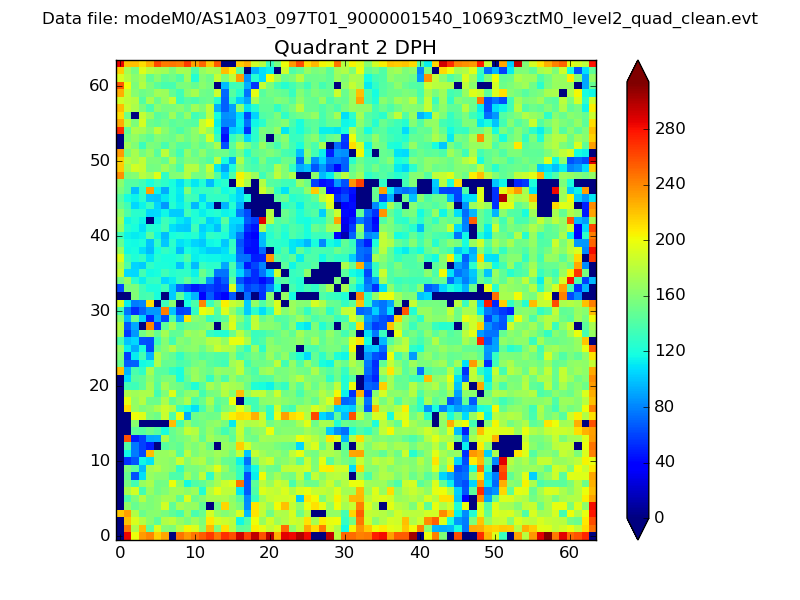 |
Quadrant C |
| Plot type | Count rate plots | Images |
|---|---|---|
| Comparison with Poisson distribution Blue bars denote a histogram of data divided into 1 sec bins. Red curve is a Poisson curve with rate = median count rate of data. |
 |
 |
| Quadrant-wise count rates Data is divided into 100 sec bins |
 |
|
| Module-wise count rates for Quadrant A Data is divided into 100 sec bins |
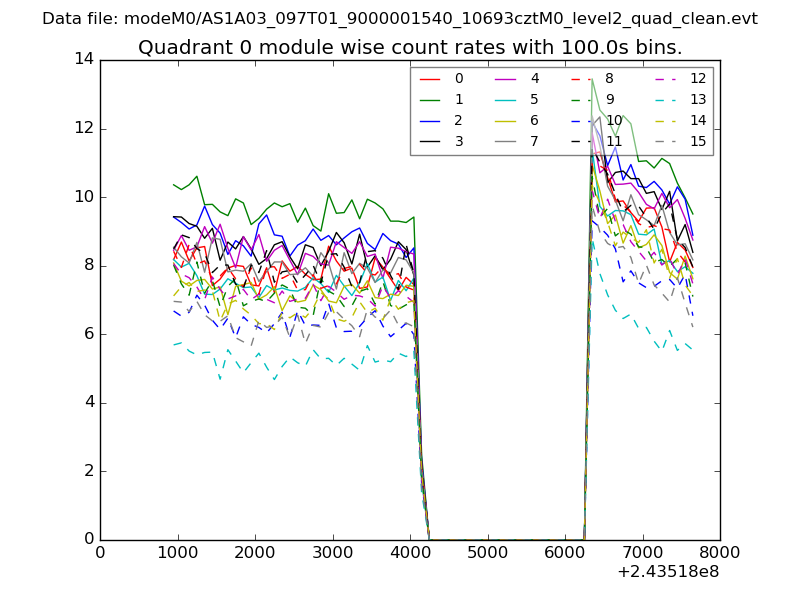 |
 |
| Module-wise count rates for Quadrant B Data is divided into 100 sec bins |
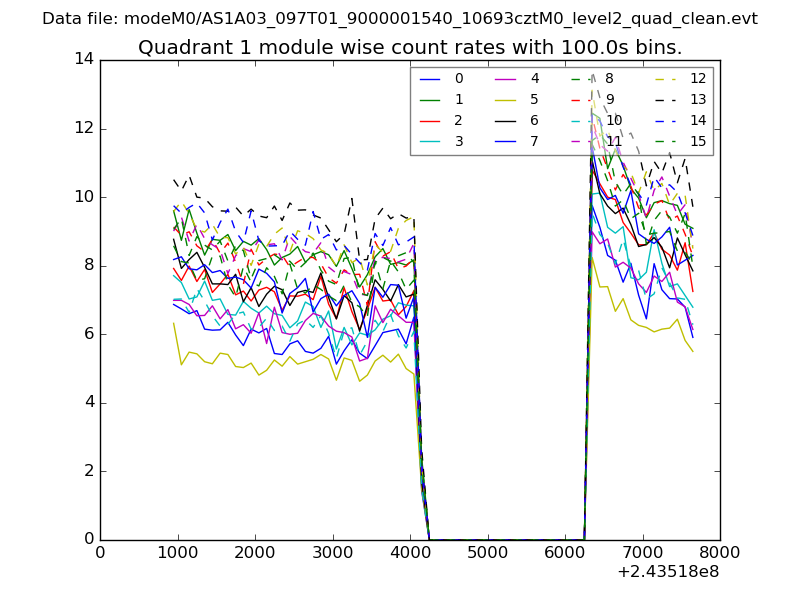 |
 |
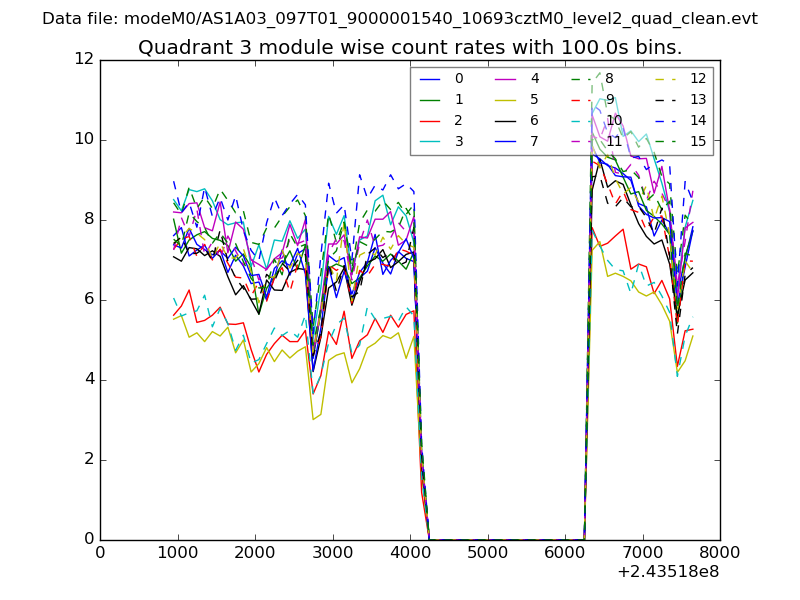
| Module-wise count rates for Quadrant C Data is divided into 100 sec bins |
 |
 |
| Module-wise count rates for Quadrant D Data is divided into 100 sec bins |
 |
 |
| Parameter | Plot |
|---|---|
| CZT HV Monitor | 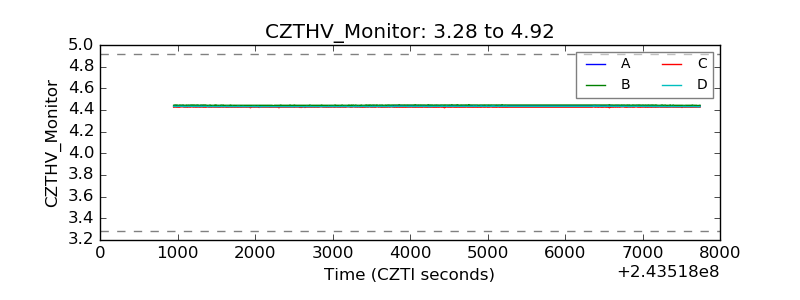 |
| D_VDD | 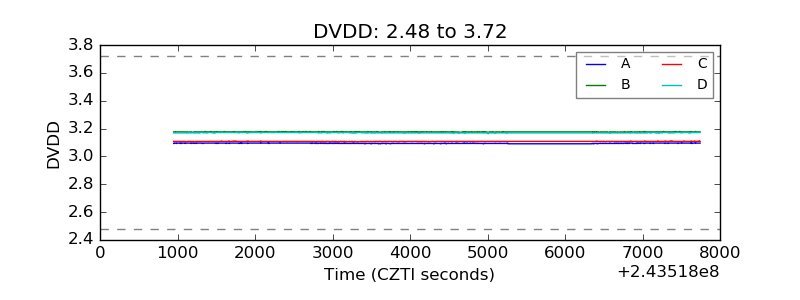 |
| Temperature 1 | 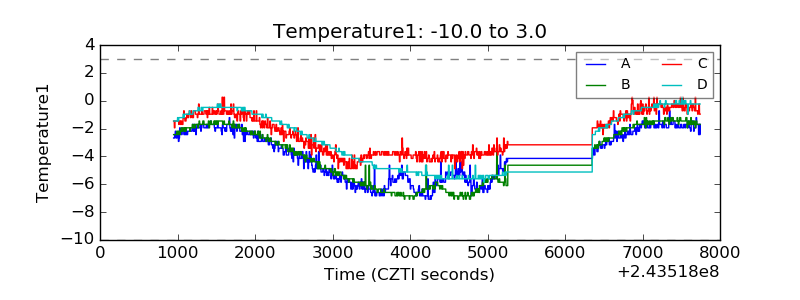 |
| Veto HV Monitor | 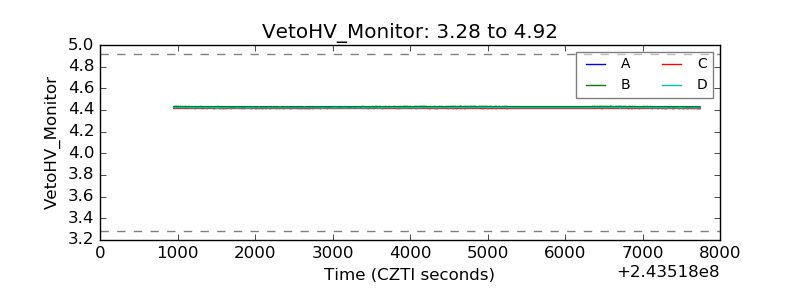 |
| Veto LLD | 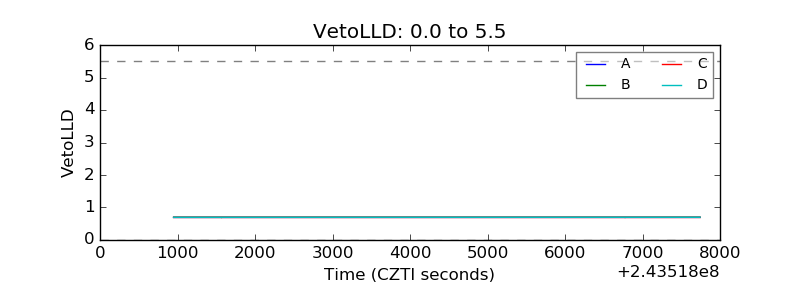 |
| Alpha Counter |  |
| _CPM_Rate |  |
| CZT Counter | 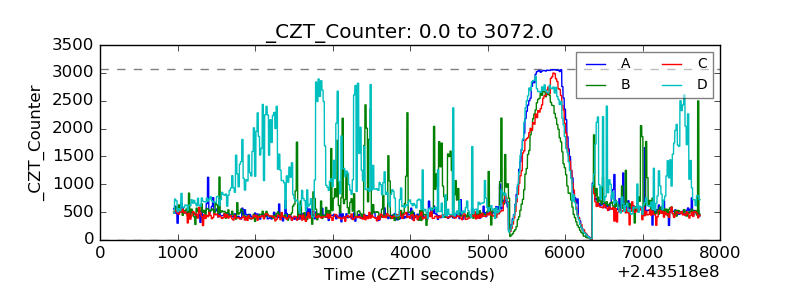 |
| +2.5 Volts monitor |  |
| +5 Volts monitor |  |
| _ROLL_ROT | 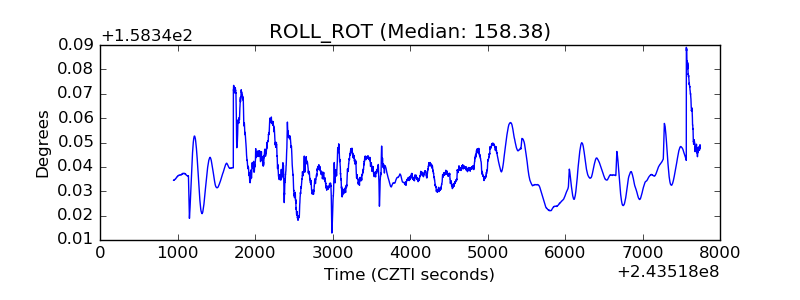 |
| _Roll_DEC | 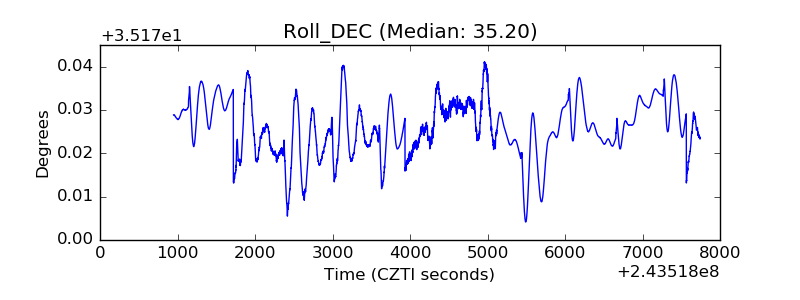 |
| _Roll_RA | 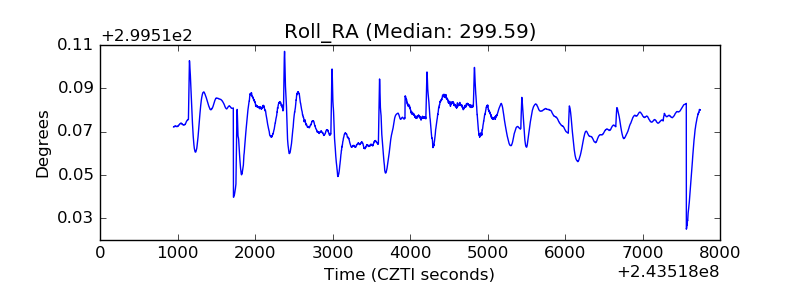 |
| Veto Counter | 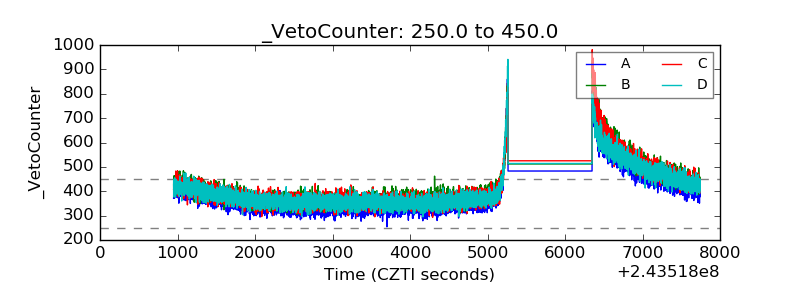 |