| Param | Original file | Final file |
|---|---|---|
| Filename | modeM0/AS1A03_097T01_9000001540_10697cztM0_level2.evt | modeM0/AS1A03_097T01_9000001540_10697cztM0_level2_quad_clean.evt |
| Size (bytes) | 524,111,040 | 83,969,280 |
| Size | 499.8 MB | 80.1 MB |
| Events in quadrant A | 3,003,181 | 540,803 |
| Events in quadrant B | 4,538,624 | 530,388 |
| Events in quadrant C | 2,825,535 | 545,583 |
| Events in quadrant D | 5,096,803 | 504,799 |
| Mode M9 | |||
|---|---|---|---|
| Quadrant | BADHDUFLAG | Total packets | Discarded packets |
| A | 0 | 14 | 0 |
| B | 0 | 14 | 0 |
| C | 0 | 14 | 0 |
| D | 0 | 14 | 0 |
| Mode M0 | |||
|---|---|---|---|
| Quadrant | BADHDUFLAG | Total packets | Discarded packets |
| A | 0 | 12838 | 2 |
| B | 0 | 17488 | 1 |
| C | 0 | 12430 | 1 |
| D | 0 | 19344 | 1 |
| Mode SS | |||
|---|---|---|---|
| Quadrant | BADHDUFLAG | Total packets | Discarded packets |
| A | 0 | 122 | 0 |
| B | 0 | 122 | 0 |
| C | 0 | 122 | 0 |
| D | 0 | 122 | 0 |
| Quadrant | Total seconds | Saturated seconds | Saturation percentage |
|---|---|---|---|
| A | 6037 | 48 | 0.795097% |
| B | 6037 | 431 | 7.139308% |
| C | 6037 | 16 | 0.265032% |
| D | 6037 | 346 | 5.731324% |
Noise dominated data is calculated using 1-second bins in cleaned event files. If a bin has >2000 counts, and if more than 50% of those come from <1% of pixels, then it is considered to be noise-dominated and hence unusable.
| Quadrant | # 1 sec bins | Bins with >0 counts | Bins with >2000 counts | High rate bins dominated by noise | Noise dominated (total time) | Noise dominated (detector-on time) | Marked lightcurve |
|---|---|---|---|---|---|---|---|
| A | 7397 | 6039 | 20 | 20 | 0.27% | 0.33% | 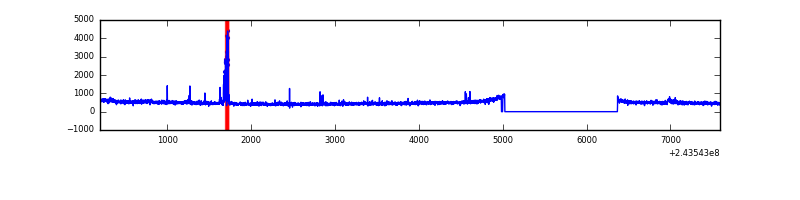 |
| B | 7397 | 6039 | 297 | 297 | 4.02% | 4.92% | 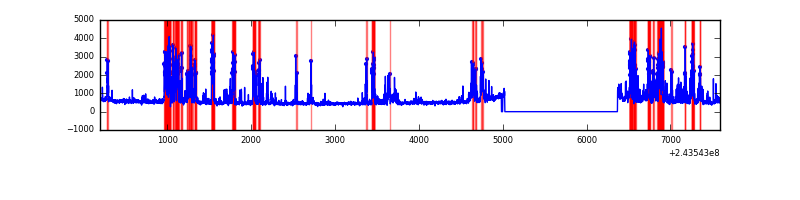 |
| C | 7397 | 6039 | 3 | 3 | 0.04% | 0.05% | 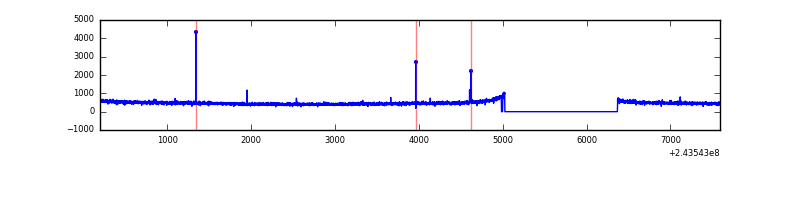 |
| D | 7397 | 6039 | 282 | 282 | 3.81% | 4.67% | 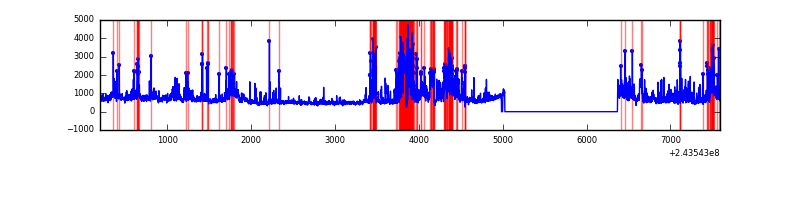 |
Top three noisy pixels from each quadrant. If the there are fewer than three noisy pixels in the level2.evt file, extra rows are filled as -1
| Pixel properties | Quadrant properties | ||||||
|---|---|---|---|---|---|---|---|
| Quadrant | DetID | PixID | Counts | Sigma | Mean | Median | Sigma |
| A | 15 | 174 | 86418 | 583.51 | 729 | 716 | 146.9 |
| A | 15 | 239 | 47151 | 316.16 | 729 | 716 | 146.9 |
| A | 8 | 5 | 18935 | 124.05 | 729 | 716 | 146.9 |
| B | 4 | 239 | 1532208 | 11374.84 | 720 | 703 | 134.6 |
| B | 15 | 204 | 40584 | 296.21 | 720 | 703 | 134.6 |
| B | 0 | 214 | 39862 | 290.84 | 720 | 703 | 134.6 |
| C | 14 | 234 | 20313 | 118.28 | 719 | 724 | 165.6 |
| C | 13 | 61 | 5277 | 27.49 | 719 | 724 | 165.6 |
| C | 8 | 222 | 2071 | 8.13 | 719 | 724 | 165.6 |
| D | 2 | 14 | 922481 | 5579.95 | 691 | 673 | 165.2 |
| D | 2 | 16 | 512839 | 3100.28 | 691 | 673 | 165.2 |
| D | 10 | 199 | 378685 | 2288.21 | 691 | 673 | 165.2 |
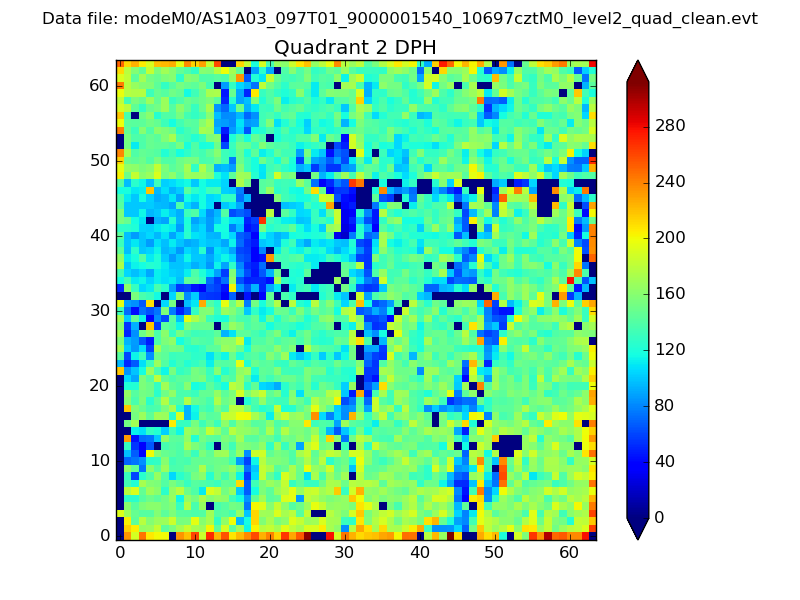
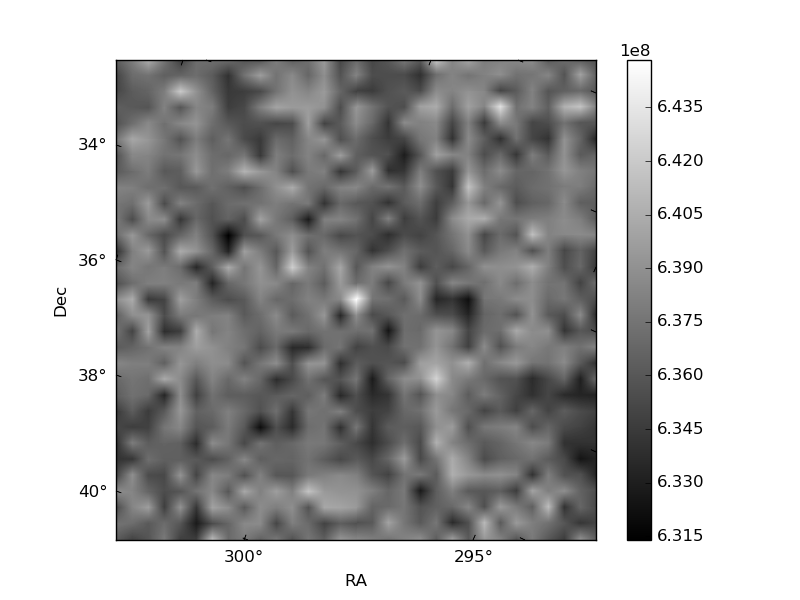
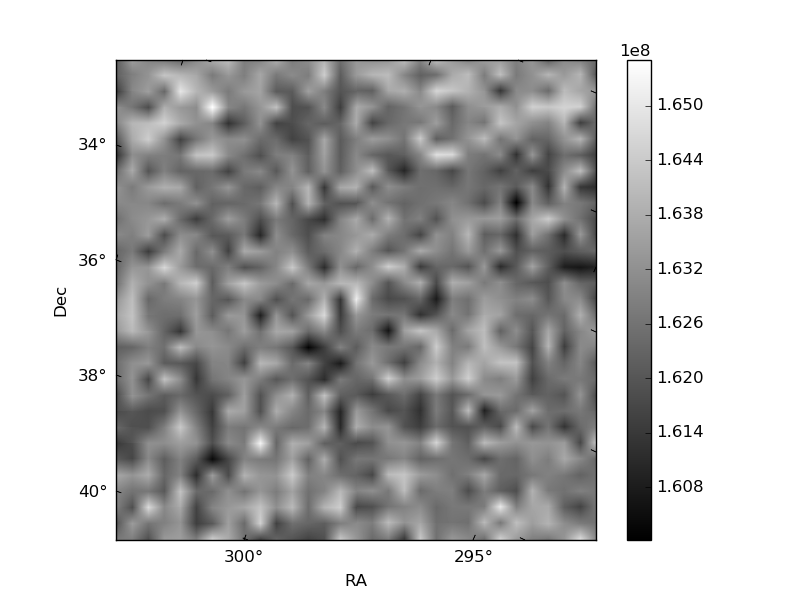
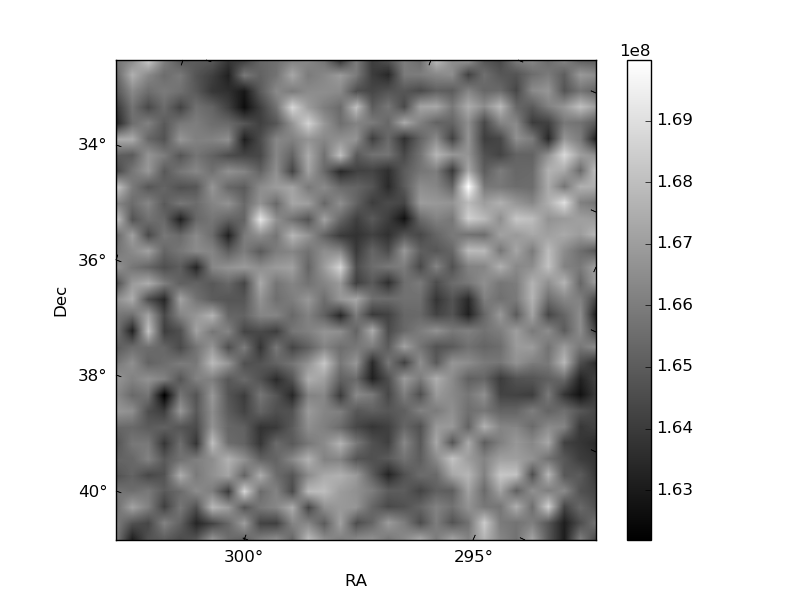
Histogram calculated using DETX and DETY for each event in the final _common_clean file
| Quadrant A | 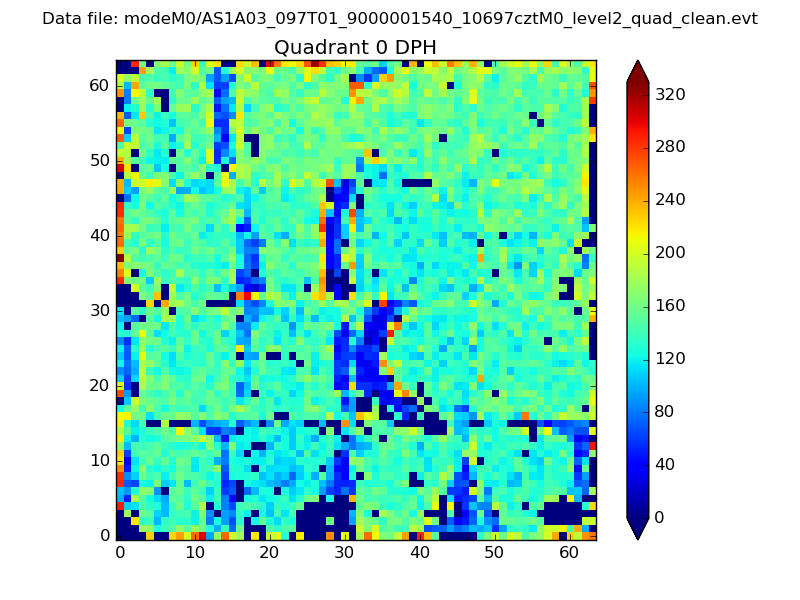 |
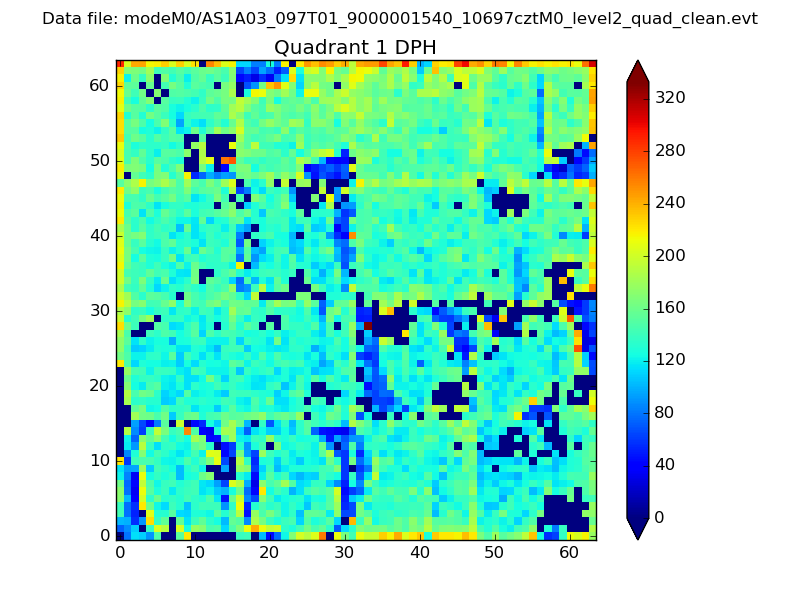 |
Quadrant B |
|---|---|---|---|
| Quadrant D | 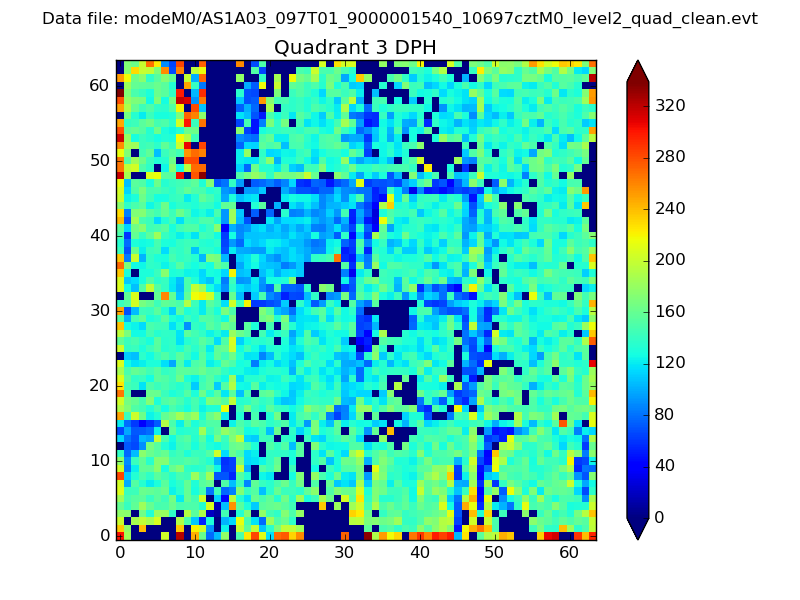 |
 |
Quadrant C |
| Plot type | Count rate plots | Images |
|---|---|---|
| Comparison with Poisson distribution Blue bars denote a histogram of data divided into 1 sec bins. Red curve is a Poisson curve with rate = median count rate of data. |
 |
 |
| Quadrant-wise count rates Data is divided into 100 sec bins |
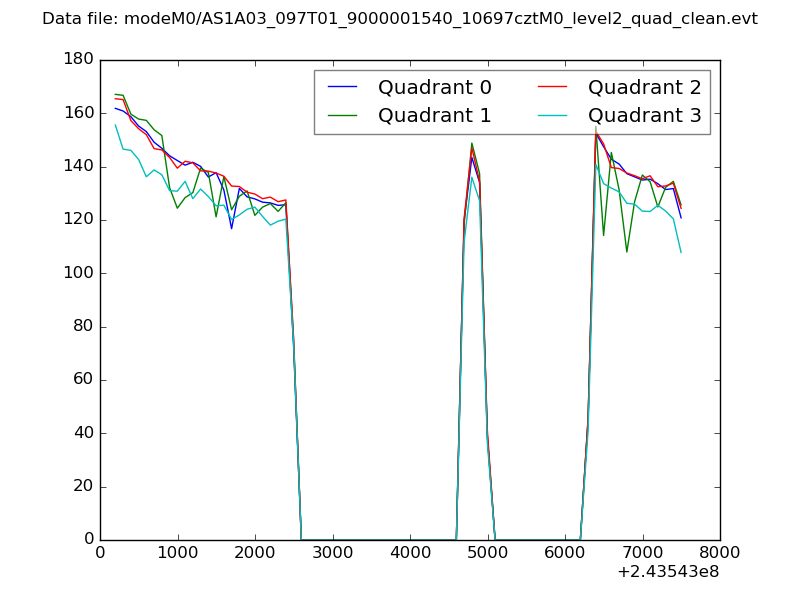 |
|
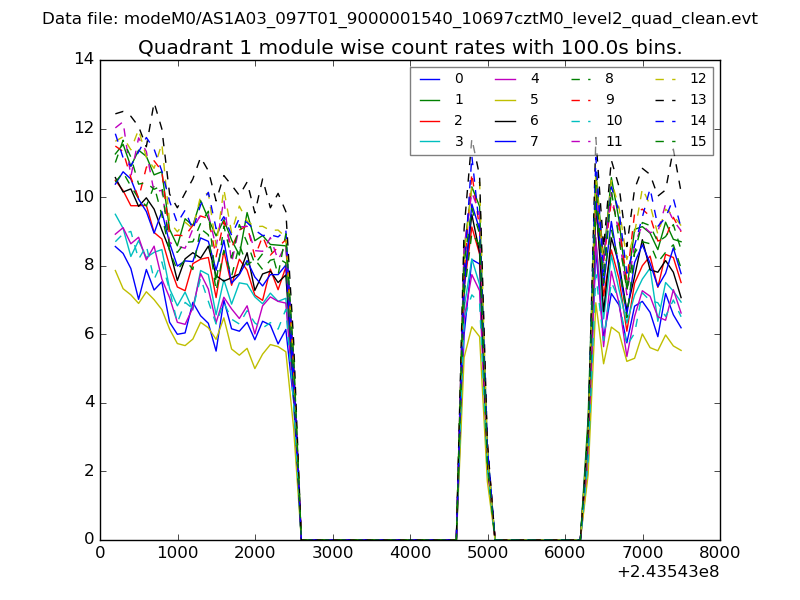
| Module-wise count rates for Quadrant A Data is divided into 100 sec bins |
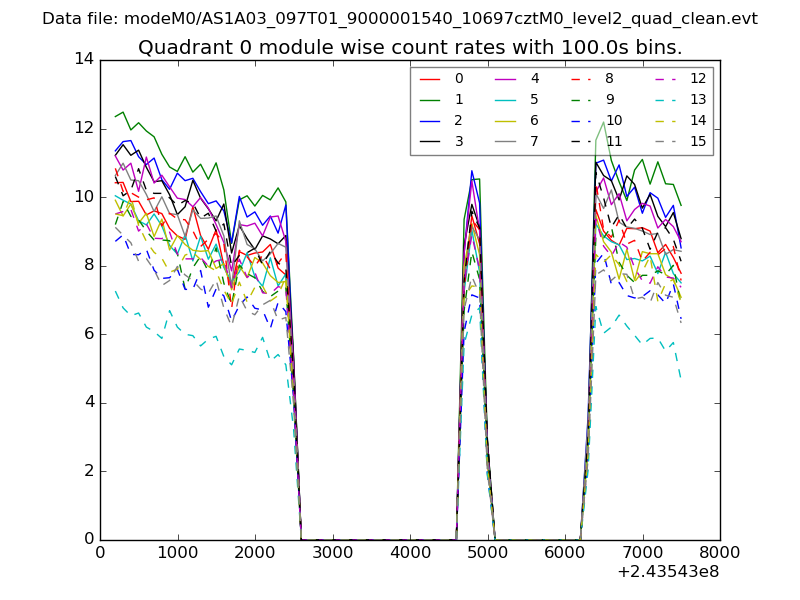 |
 |
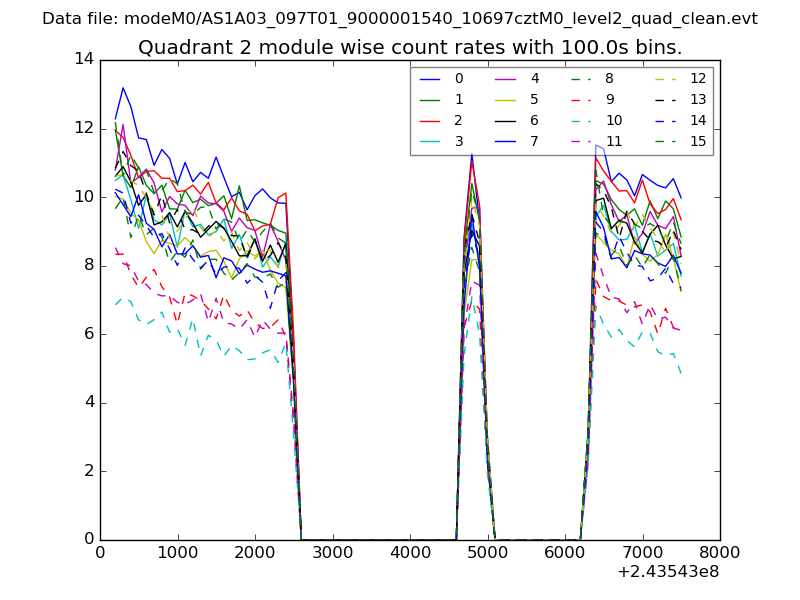
| Module-wise count rates for Quadrant B Data is divided into 100 sec bins |
 |
 |
| Module-wise count rates for Quadrant C Data is divided into 100 sec bins |
 |
 |
| Module-wise count rates for Quadrant D Data is divided into 100 sec bins |
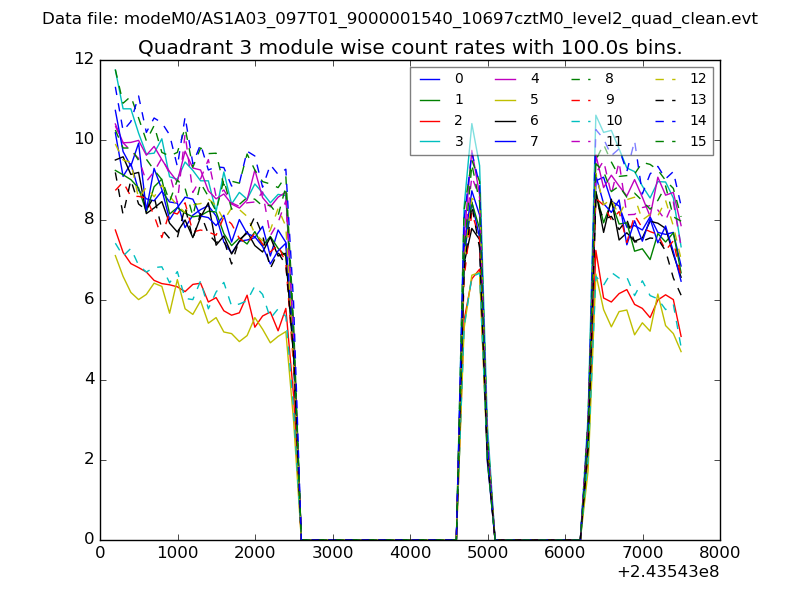 |
 |
| Parameter | Plot |
|---|---|
| CZT HV Monitor | 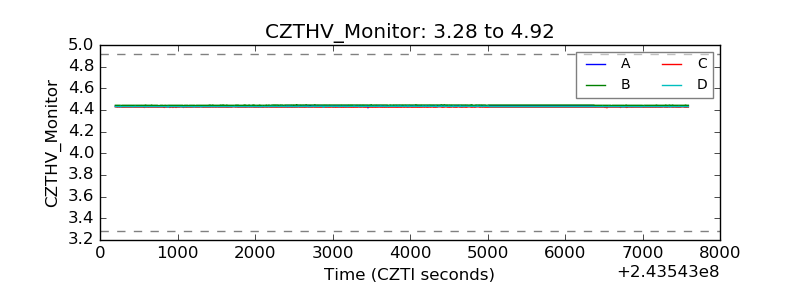 |
| D_VDD | 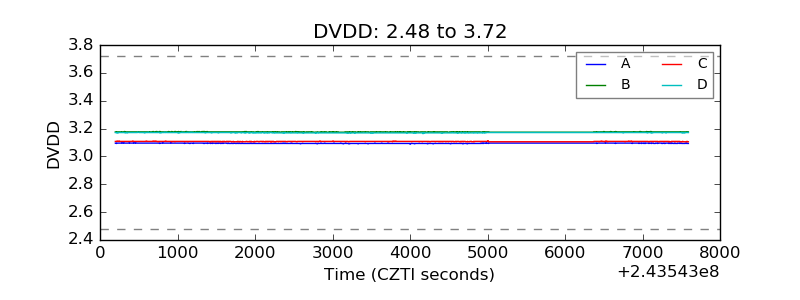 |
| Temperature 1 | 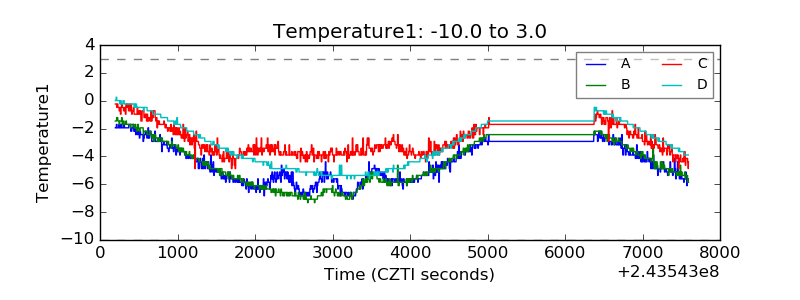 |
| Veto HV Monitor | 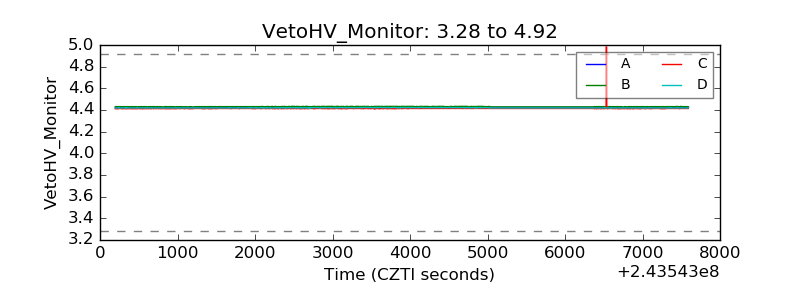 |
| Veto LLD | 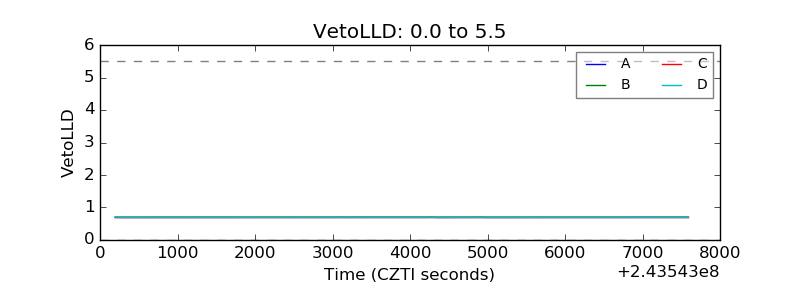 |
| Alpha Counter | 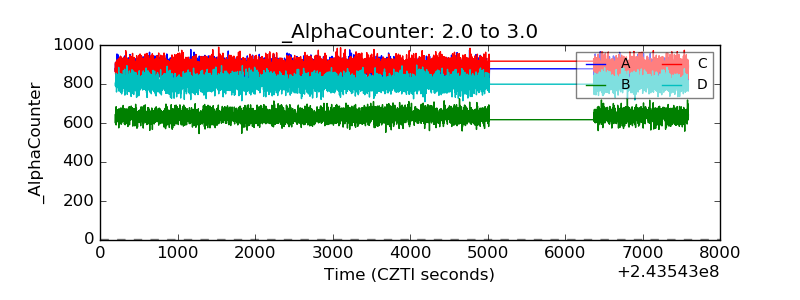 |
| _CPM_Rate | 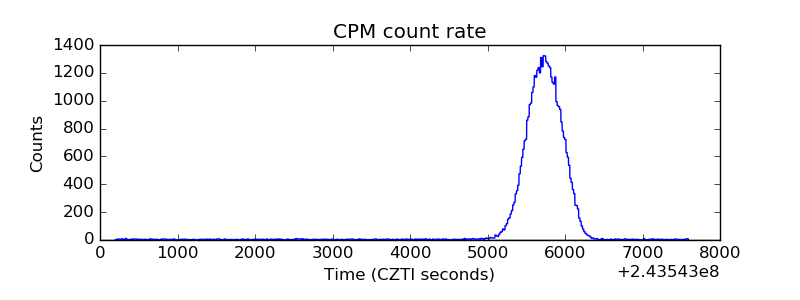 |
| CZT Counter | 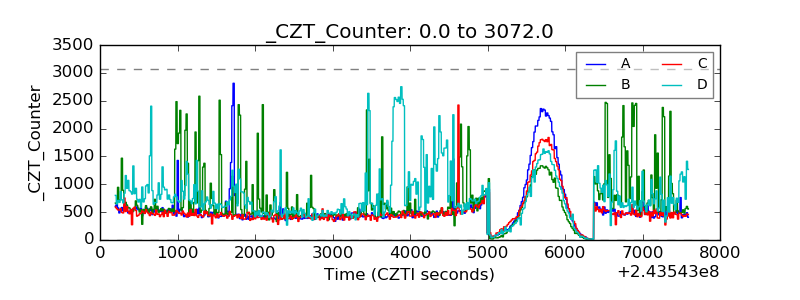 |
| +2.5 Volts monitor |  |
| +5 Volts monitor | 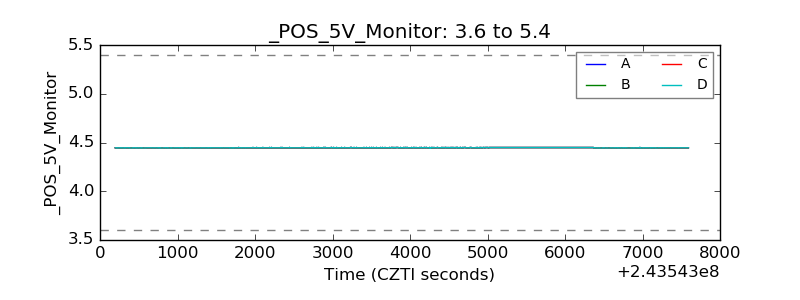 |
| _ROLL_ROT | 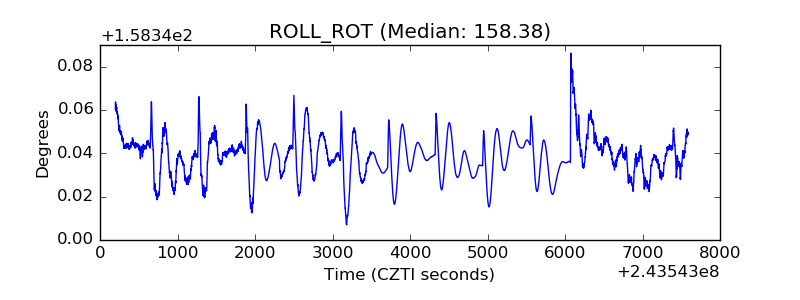 |
| _Roll_DEC | 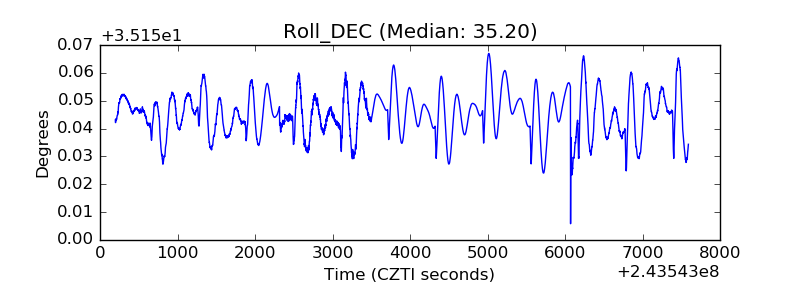 |
| _Roll_RA | 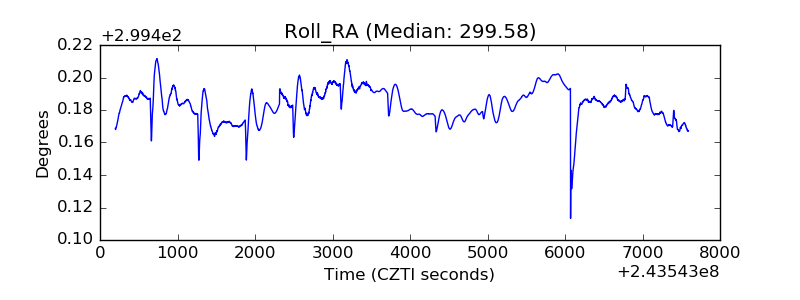 |
| Veto Counter | 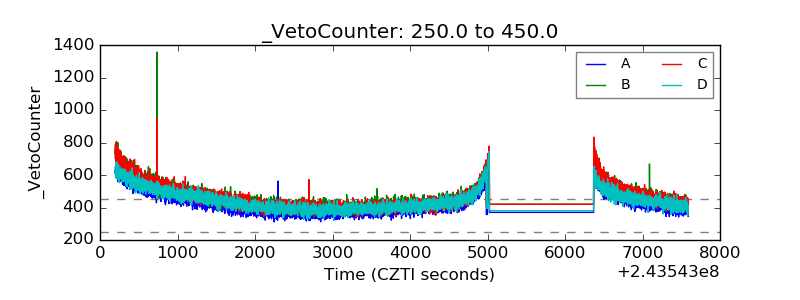 |