| Param | Original file | Final file |
|---|---|---|
| Filename | modeM0/AS1A03_097T01_9000001540_10698cztM0_level2.evt | modeM0/AS1A03_097T01_9000001540_10698cztM0_level2_quad_clean.evt |
| Size (bytes) | 509,656,320 | 86,423,040 |
| Size | 486.0 MB | 82.4 MB |
| Events in quadrant A | 3,060,529 | 552,493 |
| Events in quadrant B | 4,618,040 | 545,727 |
| Events in quadrant C | 2,894,781 | 556,712 |
| Events in quadrant D | 4,430,559 | 518,527 |
| Mode M9 | |||
|---|---|---|---|
| Quadrant | BADHDUFLAG | Total packets | Discarded packets |
| A | 0 | 16 | 0 |
| B | 0 | 16 | 0 |
| C | 0 | 16 | 0 |
| D | 0 | 17 | 0 |
| Mode M0 | |||
|---|---|---|---|
| Quadrant | BADHDUFLAG | Total packets | Discarded packets |
| A | 0 | 13347 | 3 |
| B | 0 | 17985 | 2 |
| C | 0 | 13048 | 2 |
| D | 0 | 17548 | 2 |
| Mode SS | |||
|---|---|---|---|
| Quadrant | BADHDUFLAG | Total packets | Discarded packets |
| A | 0 | 128 | 0 |
| B | 0 | 128 | 0 |
| C | 0 | 128 | 0 |
| D | 0 | 128 | 0 |
| Quadrant | Total seconds | Saturated seconds | Saturation percentage |
|---|---|---|---|
| A | 6359 | 36 | 0.566127% |
| B | 6359 | 335 | 5.268124% |
| C | 6359 | 14 | 0.220160% |
| D | 6359 | 92 | 1.446768% |
Noise dominated data is calculated using 1-second bins in cleaned event files. If a bin has >2000 counts, and if more than 50% of those come from <1% of pixels, then it is considered to be noise-dominated and hence unusable.
| Quadrant | # 1 sec bins | Bins with >0 counts | Bins with >2000 counts | High rate bins dominated by noise | Noise dominated (total time) | Noise dominated (detector-on time) | Marked lightcurve |
|---|---|---|---|---|---|---|---|
| A | 7474 | 6360 | 3 | 3 | 0.04% | 0.05% | 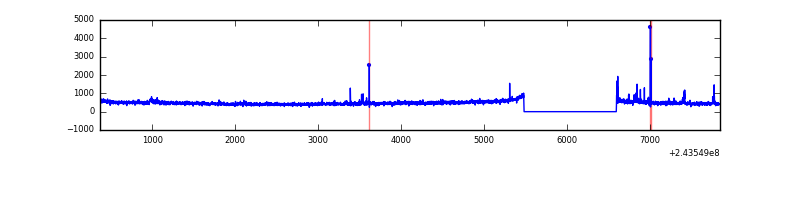 |
| B | 7474 | 6360 | 187 | 187 | 2.50% | 2.94% | 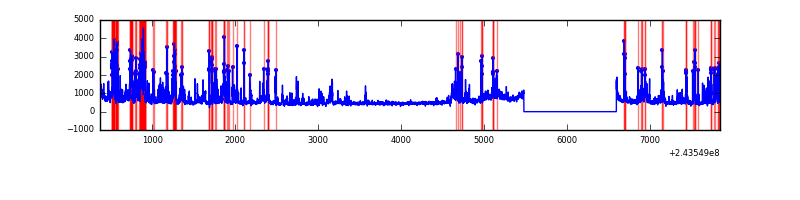 |
| C | 7474 | 6360 | 2 | 2 | 0.03% | 0.03% | 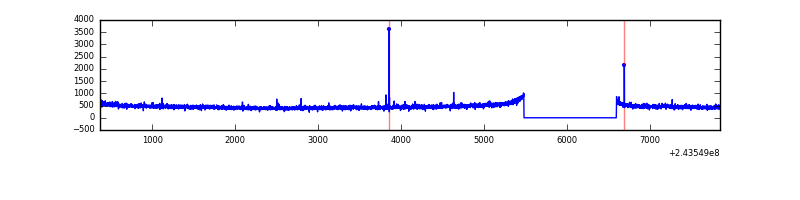 |
| D | 7474 | 6360 | 101 | 101 | 1.35% | 1.59% | 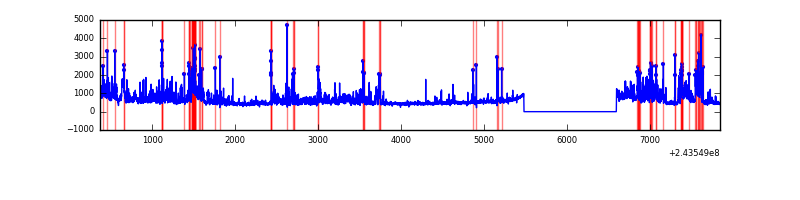 |
Top three noisy pixels from each quadrant. If the there are fewer than three noisy pixels in the level2.evt file, extra rows are filled as -1
| Pixel properties | Quadrant properties | ||||||
|---|---|---|---|---|---|---|---|
| Quadrant | DetID | PixID | Counts | Sigma | Mean | Median | Sigma |
| A | 4 | 2 | 53537 | 346.73 | 747 | 731 | 152.3 |
| A | 15 | 239 | 49191 | 318.19 | 747 | 731 | 152.3 |
| A | 1 | 162 | 20246 | 128.14 | 747 | 731 | 152.3 |
| B | 4 | 239 | 1385287 | 9804.23 | 747 | 729 | 141.2 |
| B | 0 | 219 | 157417 | 1109.53 | 747 | 729 | 141.2 |
| B | 0 | 214 | 44513 | 310.04 | 747 | 729 | 141.2 |
| C | 14 | 234 | 10659 | 58.0 | 738 | 744 | 171.0 |
| C | 14 | 238 | 5523 | 27.95 | 738 | 744 | 171.0 |
| C | 13 | 61 | 5417 | 27.33 | 738 | 744 | 171.0 |
| D | 2 | 16 | 637486 | 3653.28 | 724 | 704 | 174.3 |
| D | 10 | 199 | 469947 | 2692.09 | 724 | 704 | 174.3 |
| D | 2 | 14 | 182912 | 1045.35 | 724 | 704 | 174.3 |
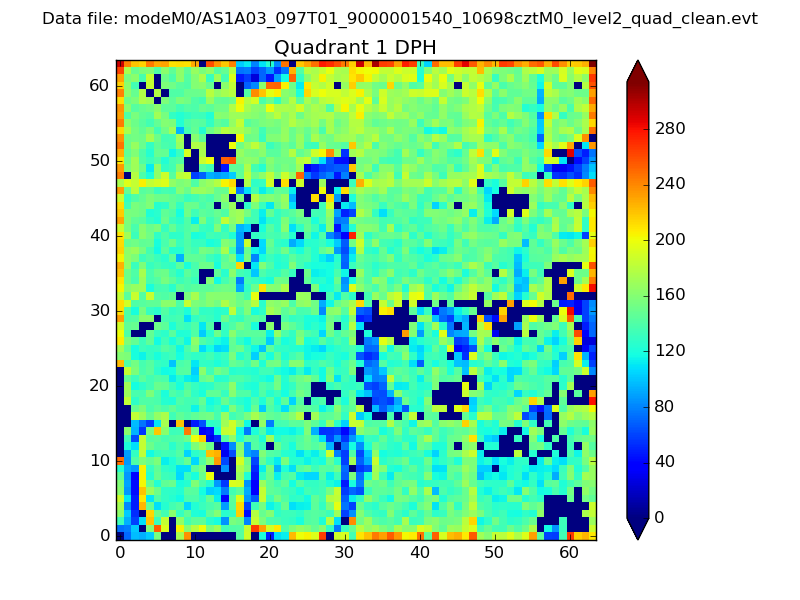
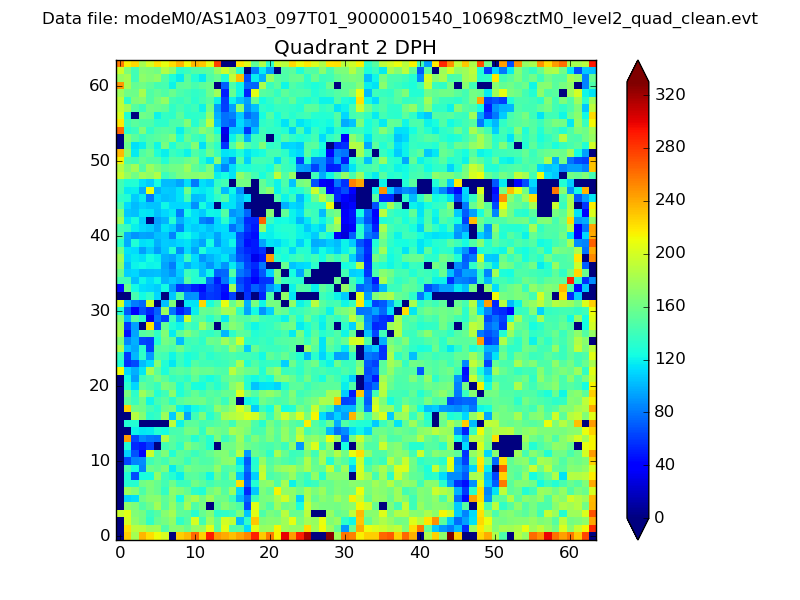
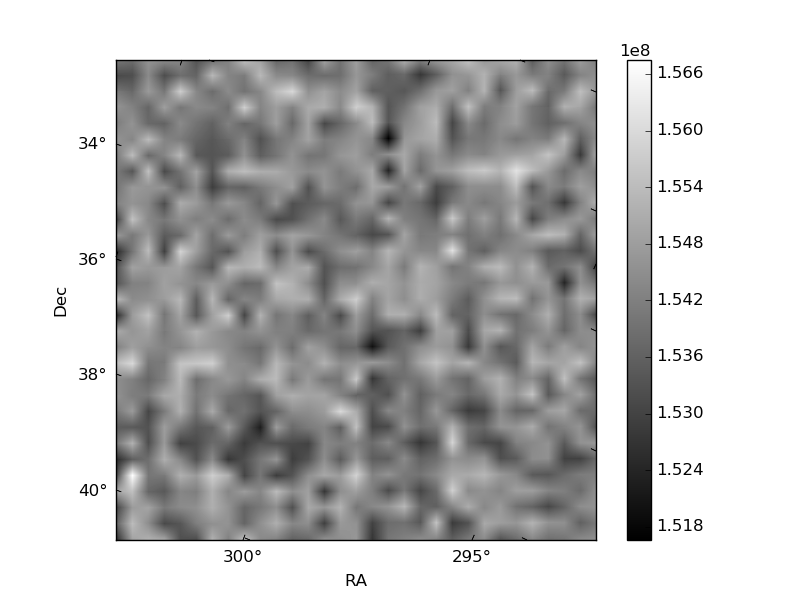
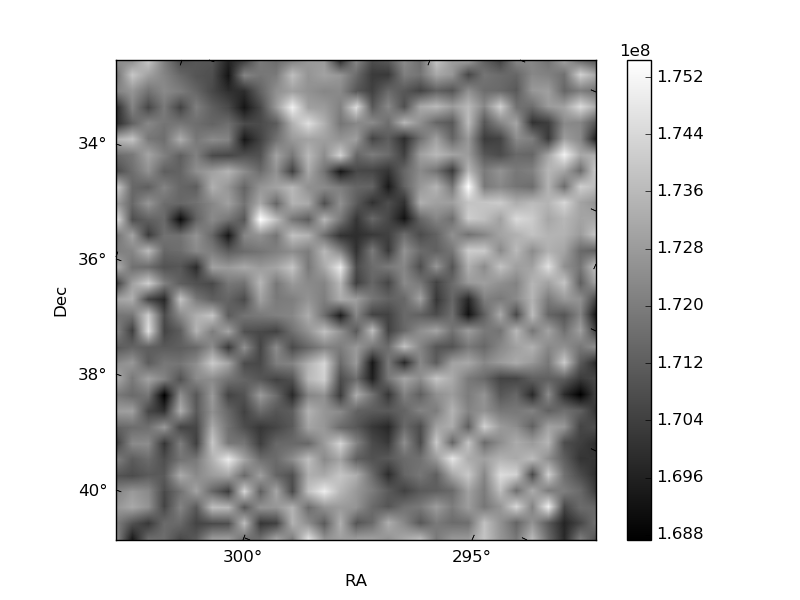
Histogram calculated using DETX and DETY for each event in the final _common_clean file
| Quadrant A |  |
 |
Quadrant B |
|---|---|---|---|
| Quadrant D | 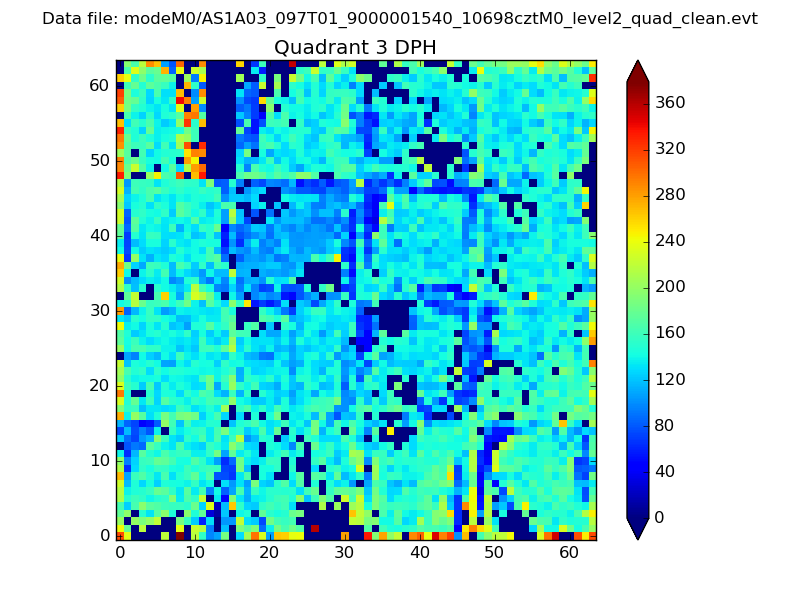 |
 |
Quadrant C |
| Plot type | Count rate plots | Images |
|---|---|---|
| Comparison with Poisson distribution Blue bars denote a histogram of data divided into 1 sec bins. Red curve is a Poisson curve with rate = median count rate of data. |
 |
 |
| Quadrant-wise count rates Data is divided into 100 sec bins |
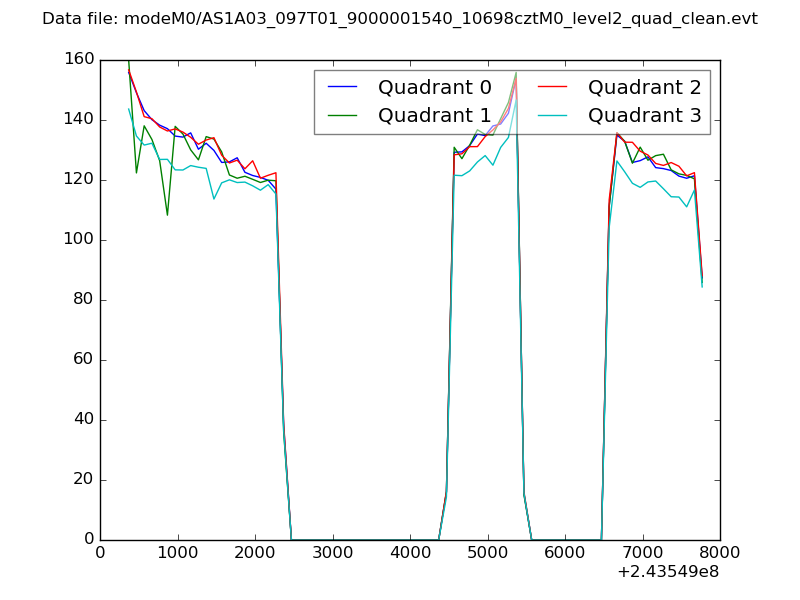 |
|
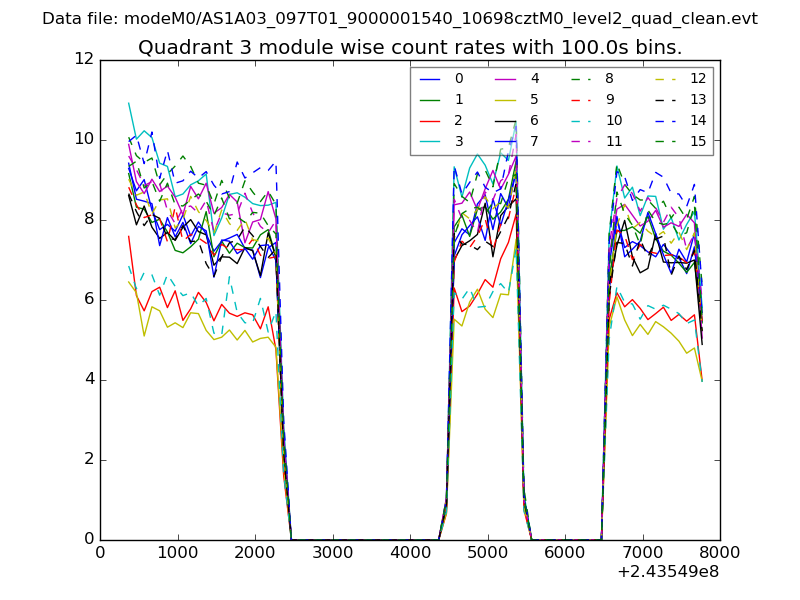
| Module-wise count rates for Quadrant A Data is divided into 100 sec bins |
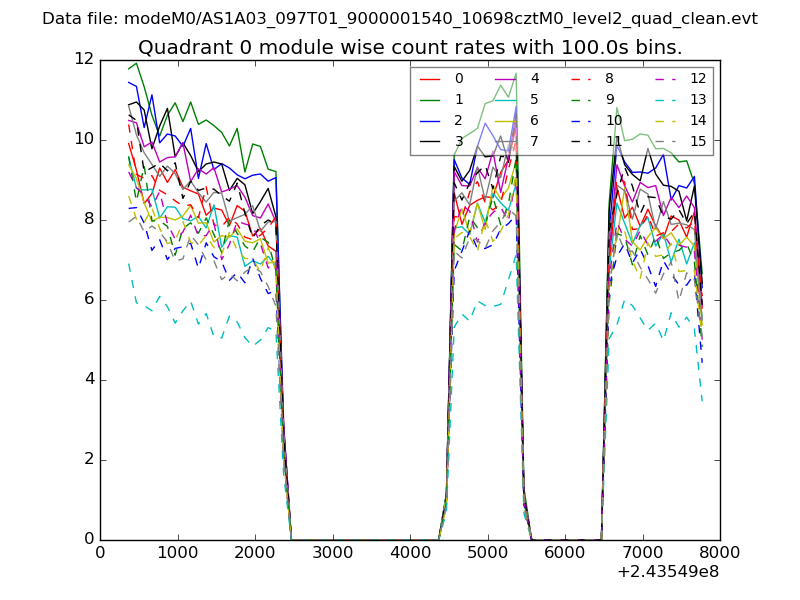 |
 |
| Module-wise count rates for Quadrant B Data is divided into 100 sec bins |
 |
 |
| Module-wise count rates for Quadrant C Data is divided into 100 sec bins |
 |
 |
| Module-wise count rates for Quadrant D Data is divided into 100 sec bins |
 |
 |
| Parameter | Plot |
|---|---|
| CZT HV Monitor |  |
| D_VDD | 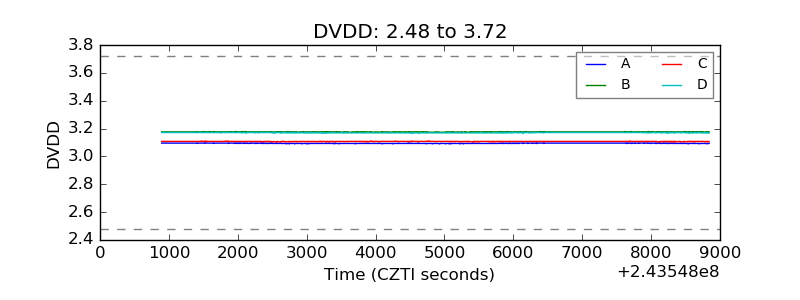 |
| Temperature 1 | 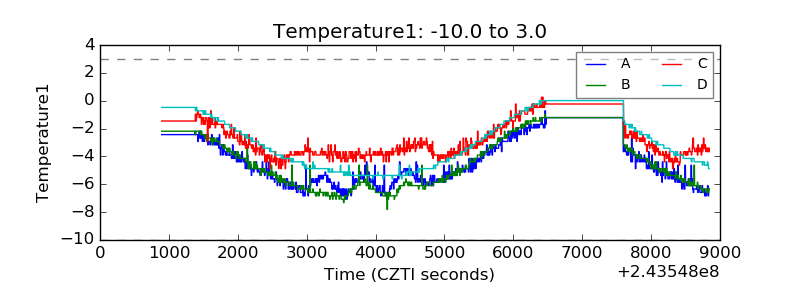 |
| Veto HV Monitor | 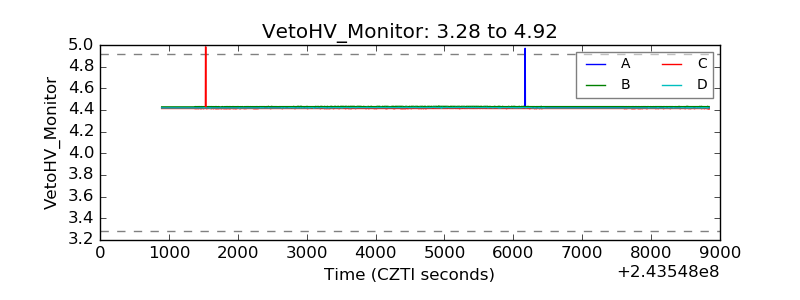 |
| Veto LLD | 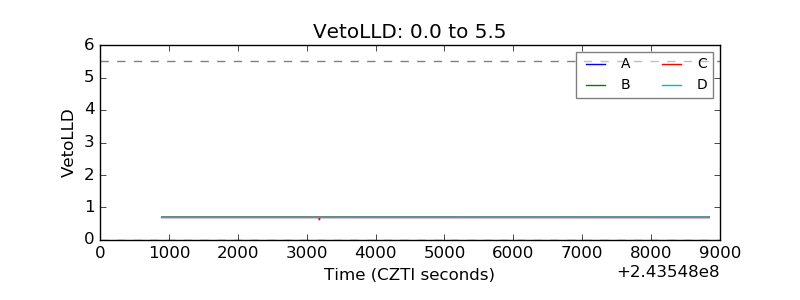 |
| Alpha Counter | 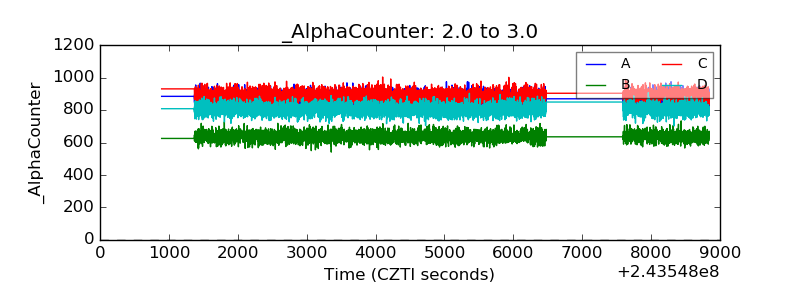 |
| _CPM_Rate | 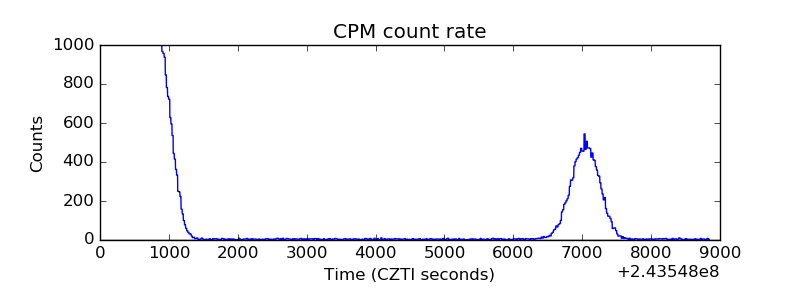 |
| CZT Counter | 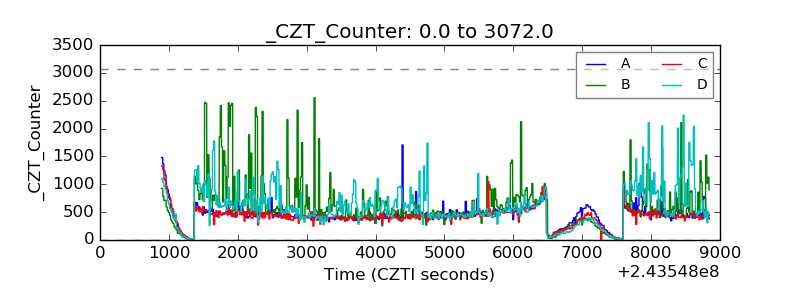 |
| +2.5 Volts monitor |  |
| +5 Volts monitor |  |
| _ROLL_ROT | 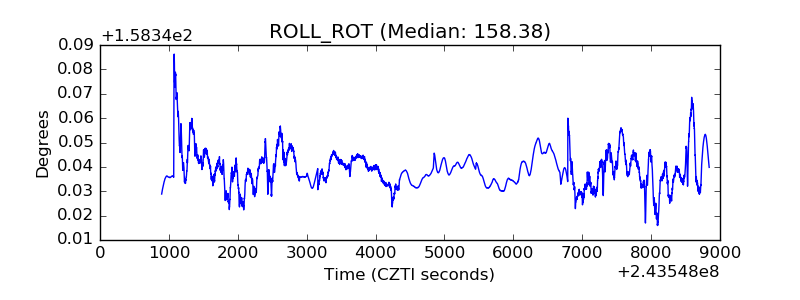 |
| _Roll_DEC | 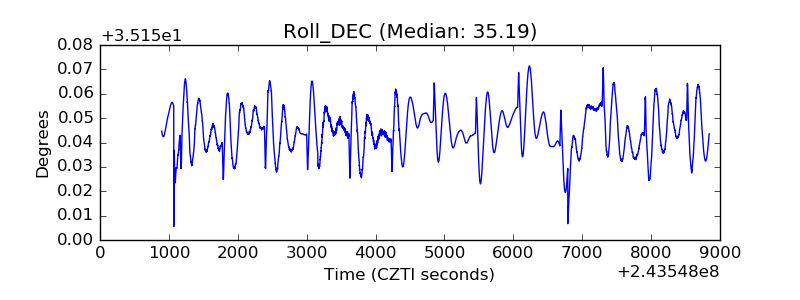 |
| _Roll_RA | 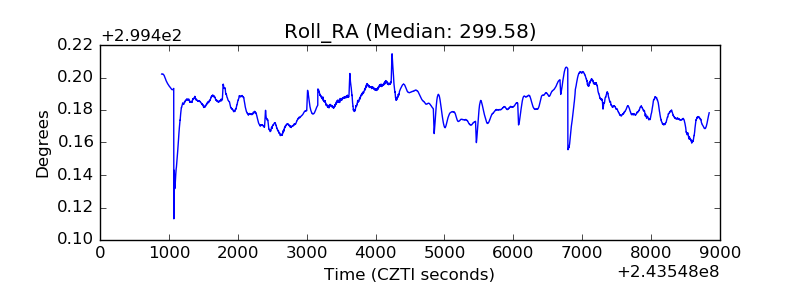 |
| Veto Counter | 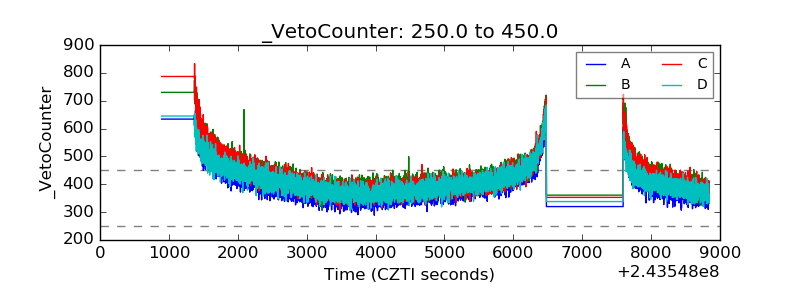 |