| Param | Original file | Final file |
|---|---|---|
| Filename | modeM0/AS1A03_097T01_9000001540_10699cztM0_level2.evt | modeM0/AS1A03_097T01_9000001540_10699cztM0_level2_quad_clean.evt |
| Size (bytes) | 330,114,240 | 45,748,800 |
| Size | 314.8 MB | 43.6 MB |
| Events in quadrant A | 1,959,434 | 272,244 |
| Events in quadrant B | 3,446,047 | 273,852 |
| Events in quadrant C | 1,852,223 | 275,031 |
| Events in quadrant D | 2,443,815 | 258,161 |
| Mode M9 | |||
|---|---|---|---|
| Quadrant | BADHDUFLAG | Total packets | Discarded packets |
| A | 0 | 10 | 0 |
| B | 0 | 10 | 0 |
| C | 0 | 10 | 0 |
| D | 0 | 11 | 0 |
| Mode M0 | |||
|---|---|---|---|
| Quadrant | BADHDUFLAG | Total packets | Discarded packets |
| A | 0 | 8930 | 1 |
| B | 0 | 13173 | 3 |
| C | 0 | 8750 | 1 |
| D | 0 | 10476 | 1 |
| Mode SS | |||
|---|---|---|---|
| Quadrant | BADHDUFLAG | Total packets | Discarded packets |
| A | 0 | 86 | 0 |
| B | 0 | 86 | 0 |
| C | 0 | 86 | 0 |
| D | 0 | 86 | 0 |
| Quadrant | Total seconds | Saturated seconds | Saturation percentage |
|---|---|---|---|
| A | 4344 | 12 | 0.276243% |
| B | 4343 | 323 | 7.437255% |
| C | 4344 | 5 | 0.115101% |
| D | 4344 | 29 | 0.667587% |
Noise dominated data is calculated using 1-second bins in cleaned event files. If a bin has >2000 counts, and if more than 50% of those come from <1% of pixels, then it is considered to be noise-dominated and hence unusable.
| Quadrant | # 1 sec bins | Bins with >0 counts | Bins with >2000 counts | High rate bins dominated by noise | Noise dominated (total time) | Noise dominated (detector-on time) | Marked lightcurve |
|---|---|---|---|---|---|---|---|
| A | 4344 | 4344 | 2 | 2 | 0.05% | 0.05% | 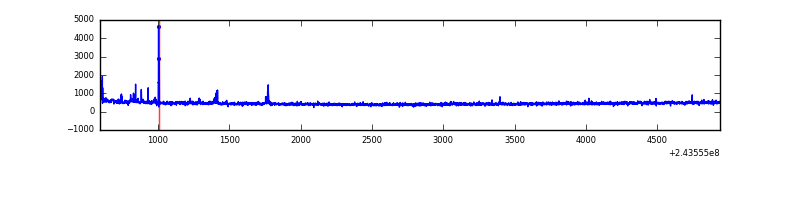 |
| B | 4344 | 4344 | 255 | 255 | 5.87% | 5.87% | 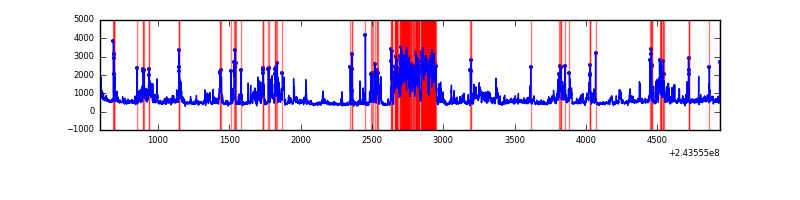 |
| C | 4344 | 4344 | 1 | 1 | 0.02% | 0.02% | 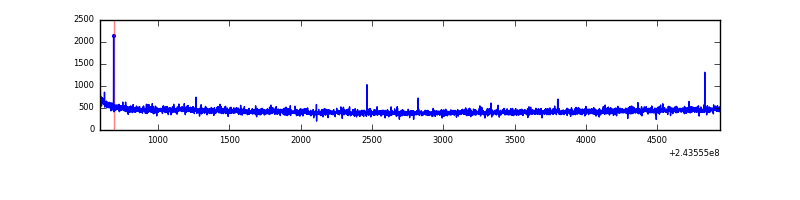 |
| D | 4344 | 4344 | 41 | 41 | 0.94% | 0.94% | 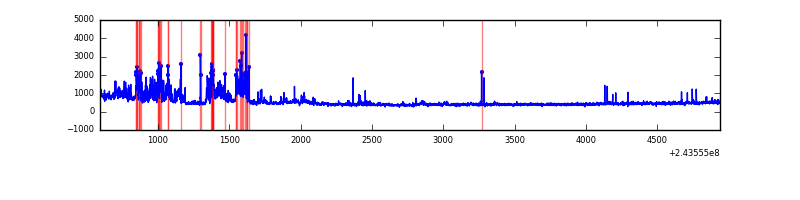 |
Top three noisy pixels from each quadrant. If the there are fewer than three noisy pixels in the level2.evt file, extra rows are filled as -1
| Pixel properties | Quadrant properties | ||||||
|---|---|---|---|---|---|---|---|
| Quadrant | DetID | PixID | Counts | Sigma | Mean | Median | Sigma |
| A | 4 | 2 | 53423 | 534.17 | 479 | 470 | 99.1 |
| A | 15 | 239 | 25150 | 248.96 | 479 | 470 | 99.1 |
| A | 1 | 162 | 9036 | 86.41 | 479 | 470 | 99.1 |
| B | 4 | 239 | 995334 | 10938.65 | 475 | 463 | 91.0 |
| B | 0 | 85 | 465183 | 5109.62 | 475 | 463 | 91.0 |
| B | 0 | 219 | 65366 | 713.61 | 475 | 463 | 91.0 |
| C | 14 | 234 | 8057 | 69.08 | 471 | 475 | 109.8 |
| C | 14 | 238 | 3942 | 31.59 | 471 | 475 | 109.8 |
| C | 13 | 61 | 3578 | 28.27 | 471 | 475 | 109.8 |
| D | 10 | 199 | 287686 | 2561.43 | 461 | 449 | 112.1 |
| D | 2 | 16 | 196540 | 1748.63 | 461 | 449 | 112.1 |
| D | 12 | 233 | 72852 | 645.65 | 461 | 449 | 112.1 |
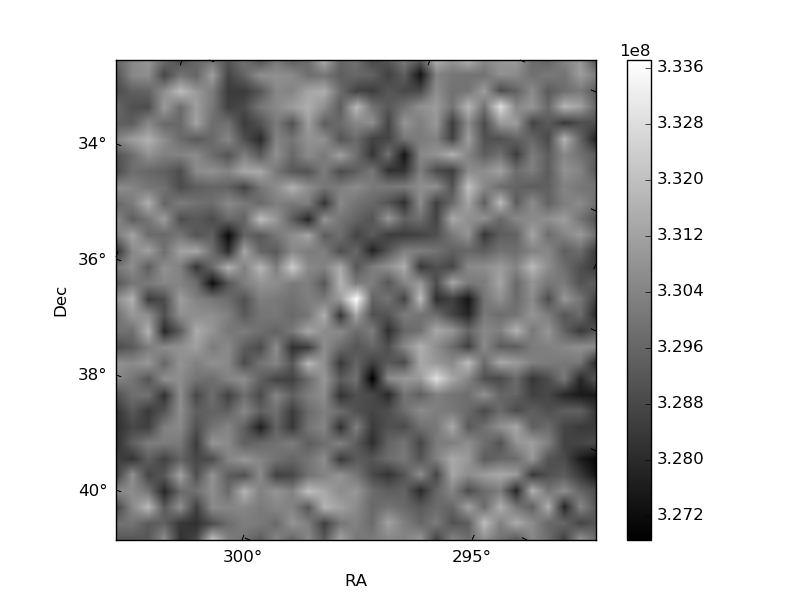
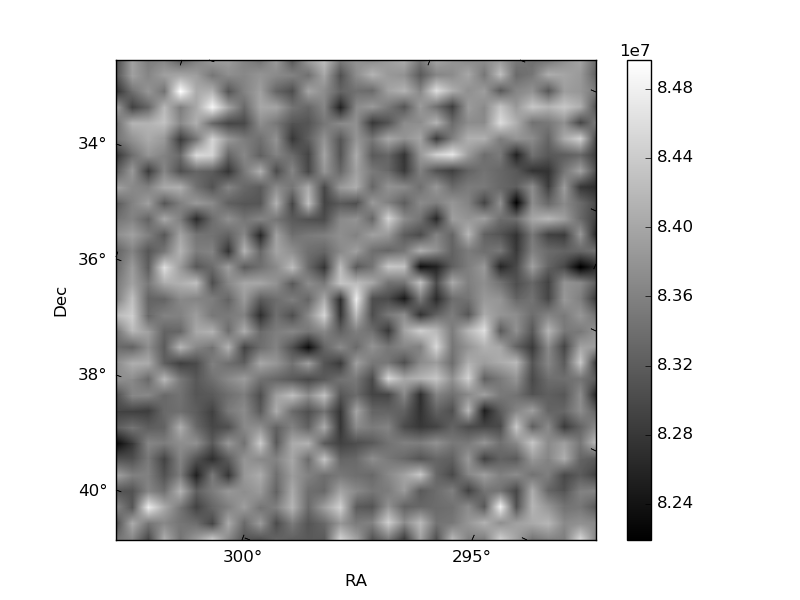
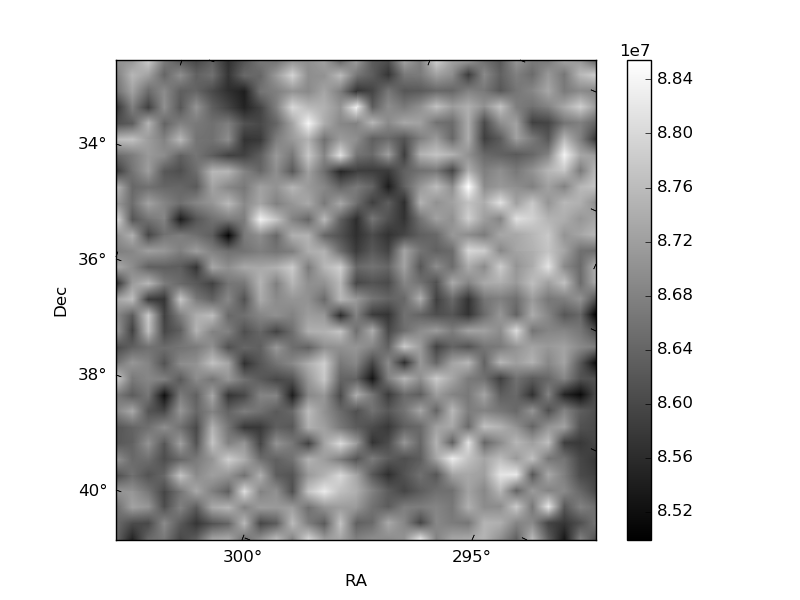
Histogram calculated using DETX and DETY for each event in the final _common_clean file
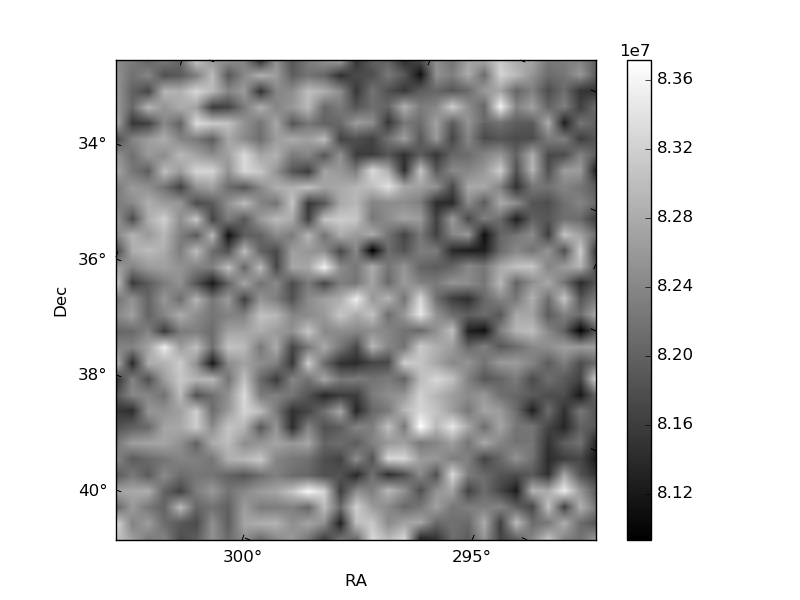
| Quadrant A | 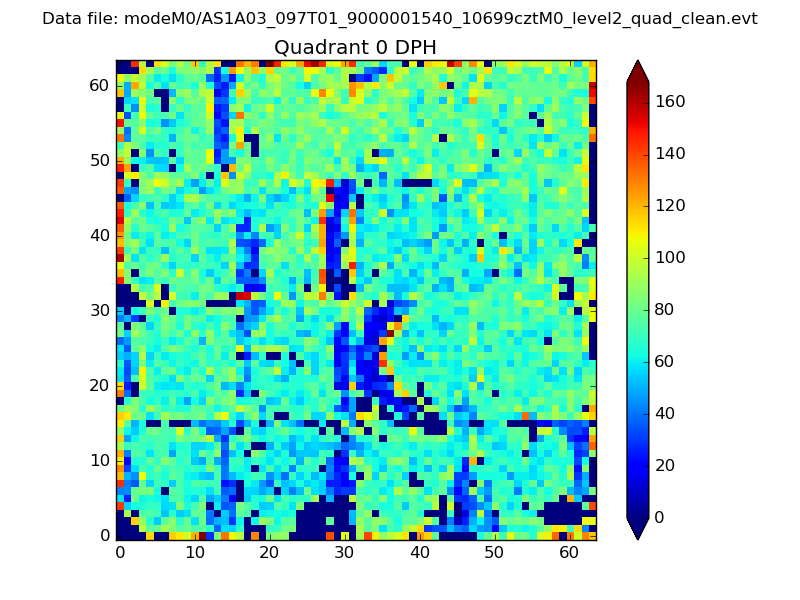 |
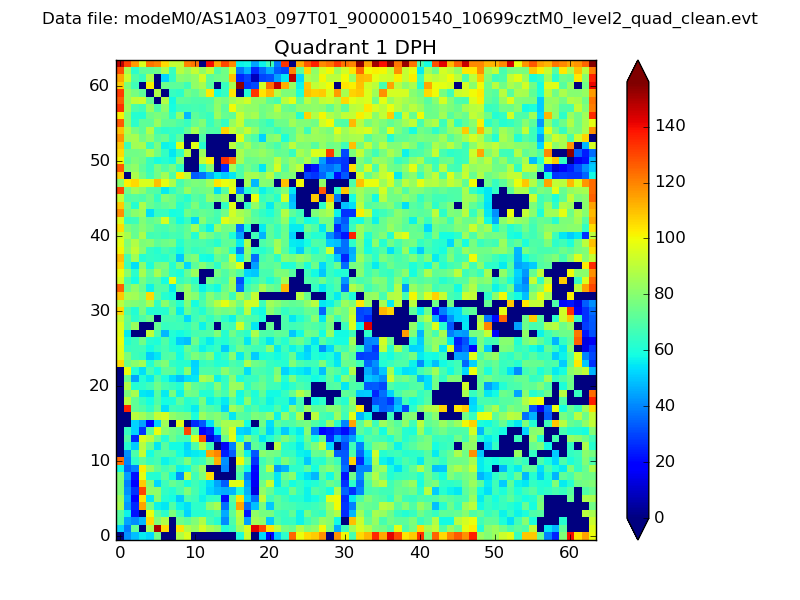 |
Quadrant B |
|---|---|---|---|
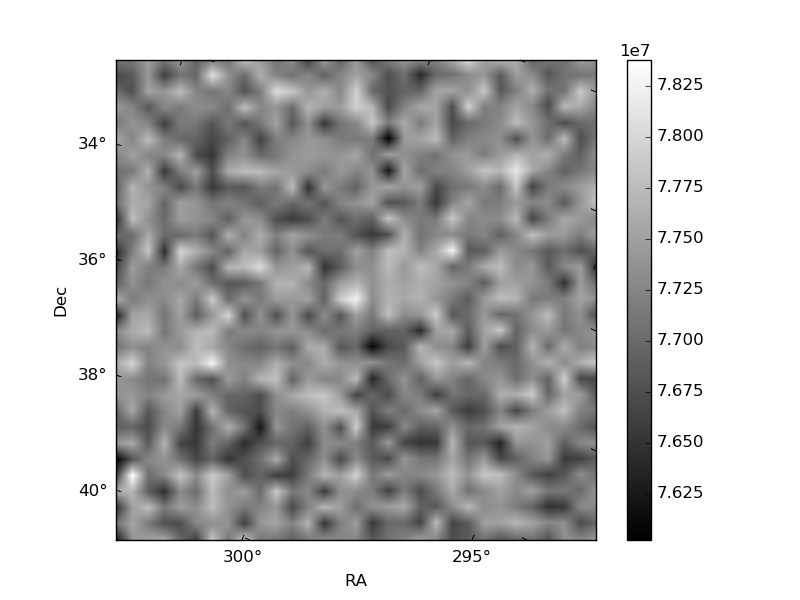
| Quadrant D | 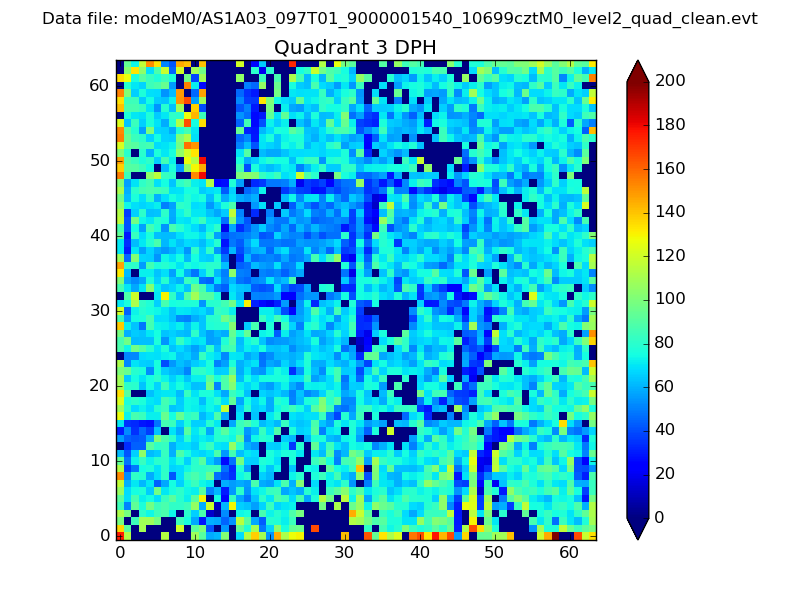 |
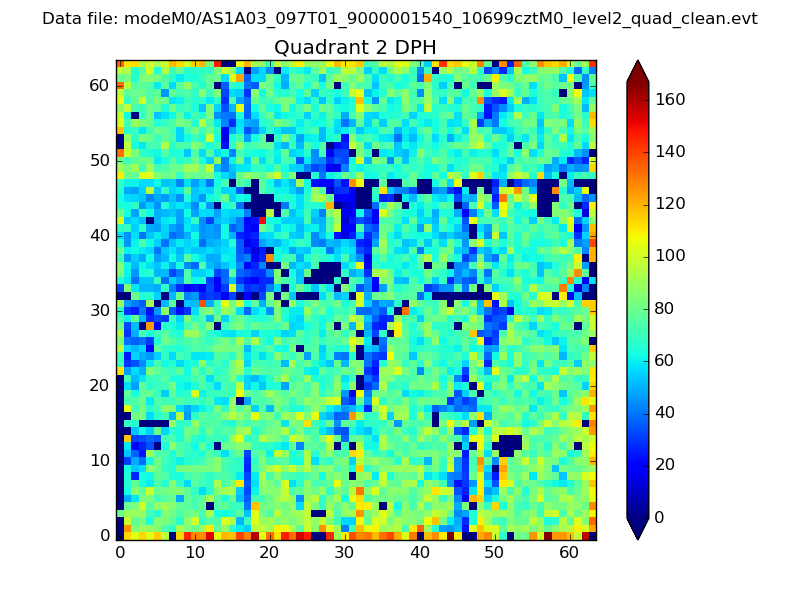 |
Quadrant C |
| Plot type | Count rate plots | Images |
|---|---|---|
| Comparison with Poisson distribution Blue bars denote a histogram of data divided into 1 sec bins. Red curve is a Poisson curve with rate = median count rate of data. |
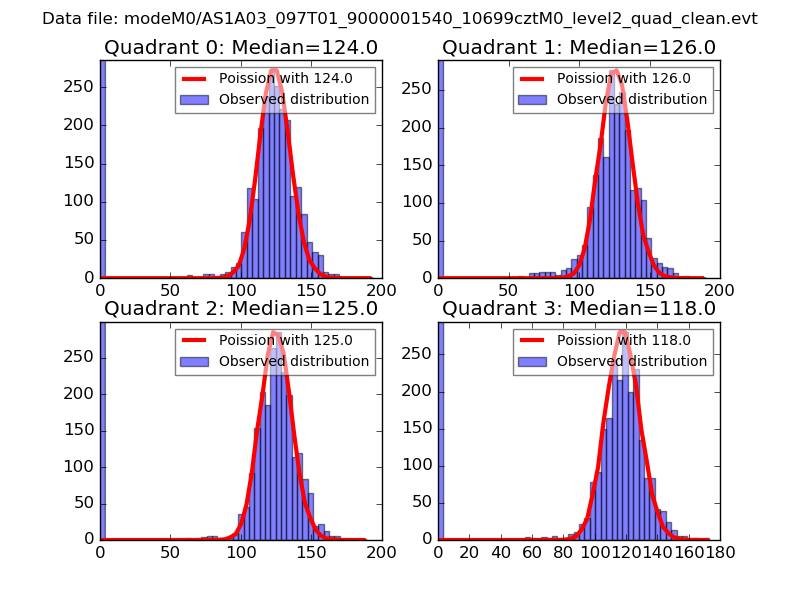 |
 |
| Quadrant-wise count rates Data is divided into 100 sec bins |
 |
|
| Module-wise count rates for Quadrant A Data is divided into 100 sec bins |
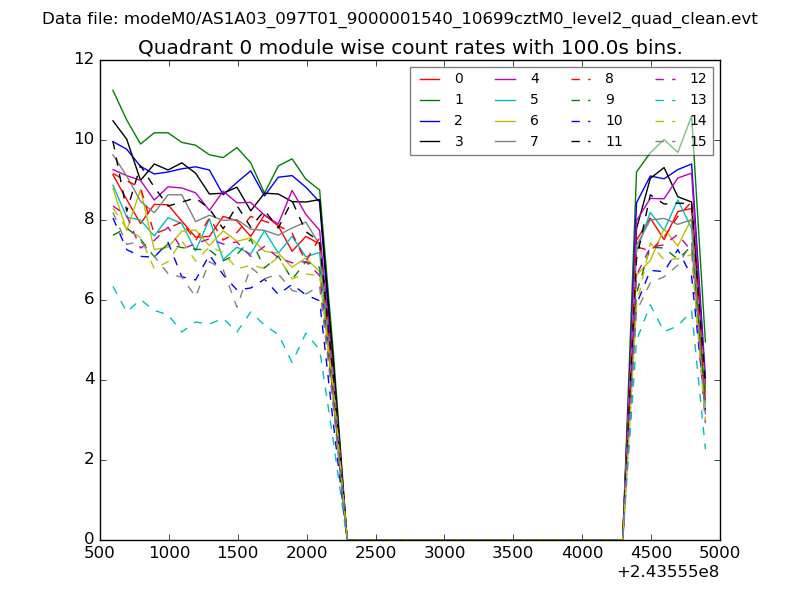 |
 |
| Module-wise count rates for Quadrant B Data is divided into 100 sec bins |
 |
 |
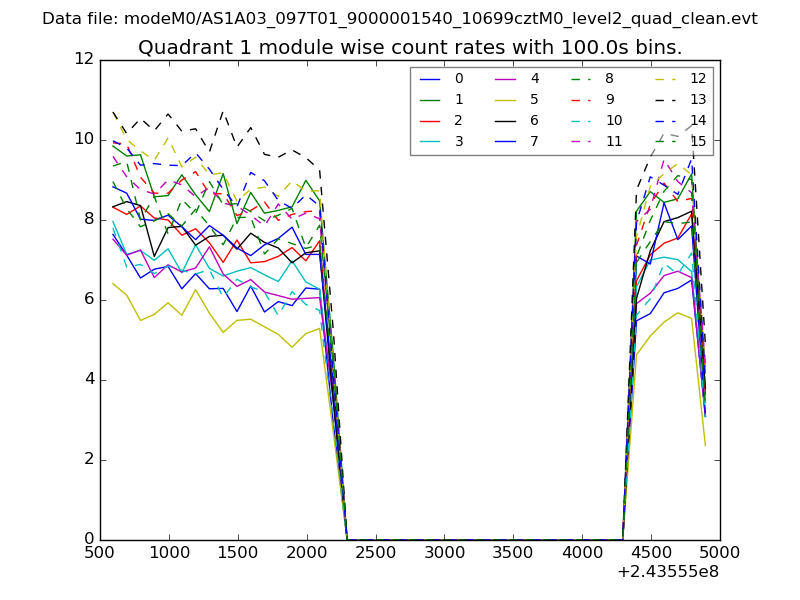
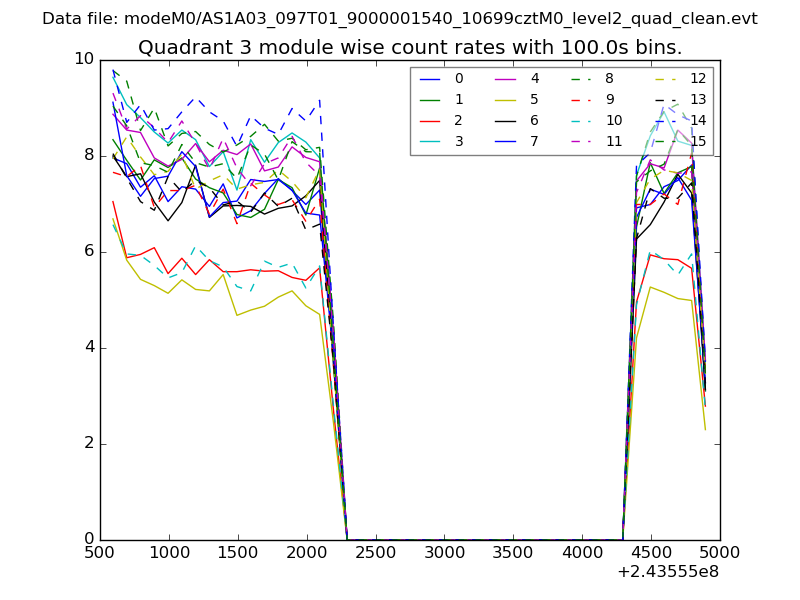
| Module-wise count rates for Quadrant C Data is divided into 100 sec bins |
 |
 |
| Module-wise count rates for Quadrant D Data is divided into 100 sec bins |
 |
 |
| Parameter | Plot |
|---|---|
| CZT HV Monitor | 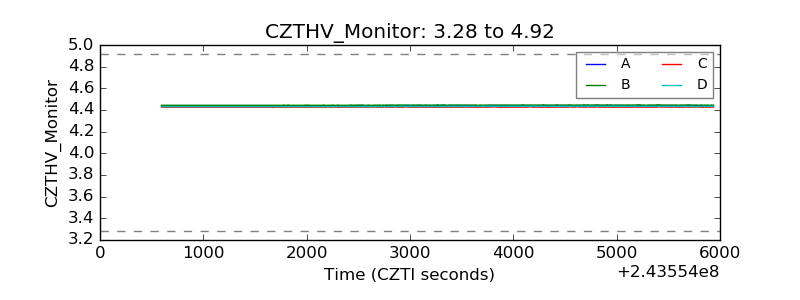 |
| D_VDD | 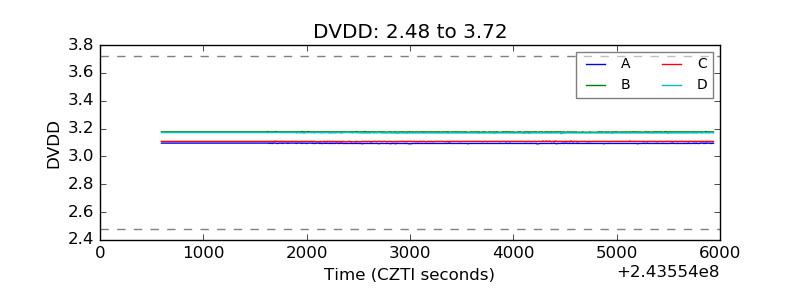 |
| Temperature 1 | 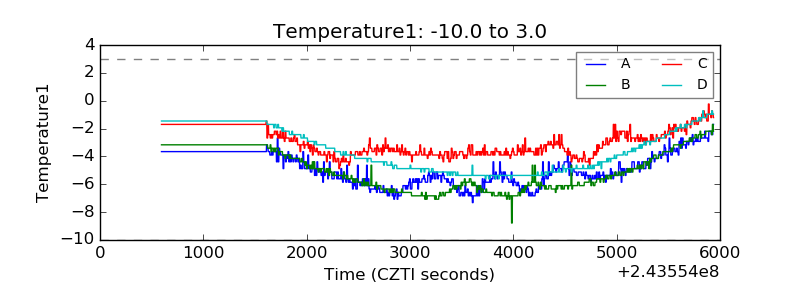 |
| Veto HV Monitor | 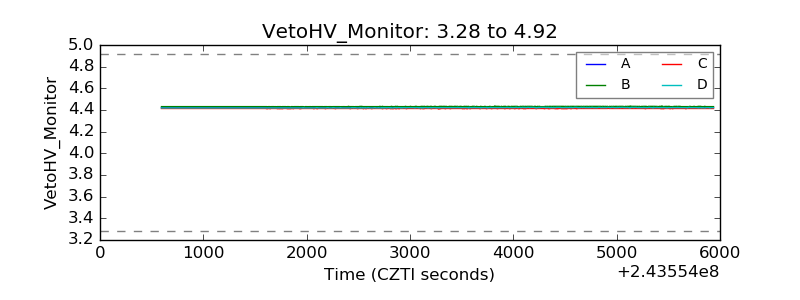 |
| Veto LLD | 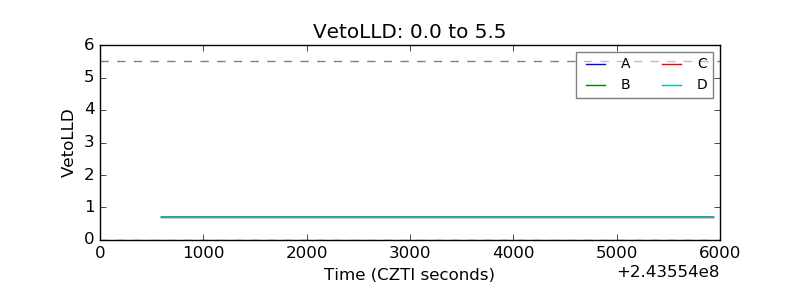 |
| Alpha Counter | 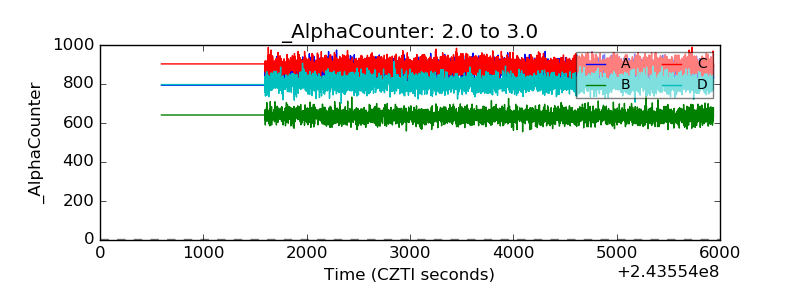 |
| _CPM_Rate | 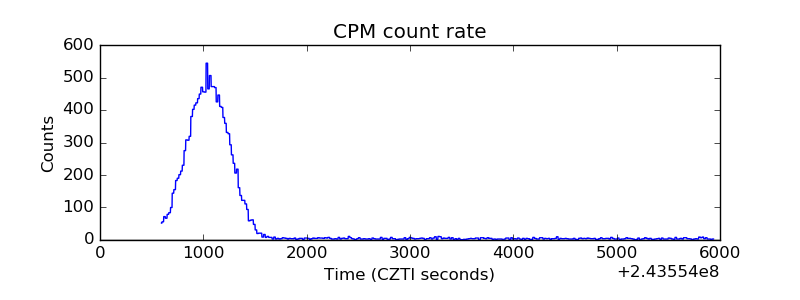 |
| CZT Counter | 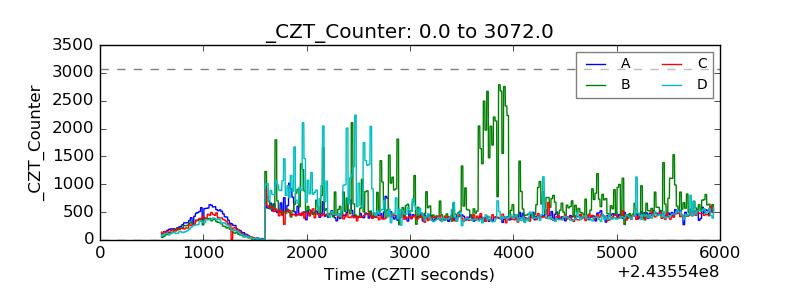 |
| +2.5 Volts monitor |  |
| +5 Volts monitor |  |
| _ROLL_ROT | 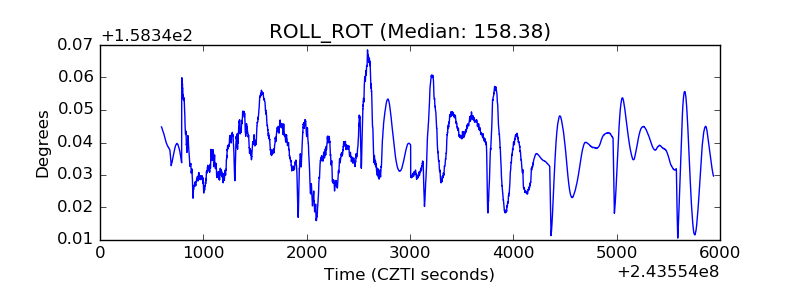 |
| _Roll_DEC | 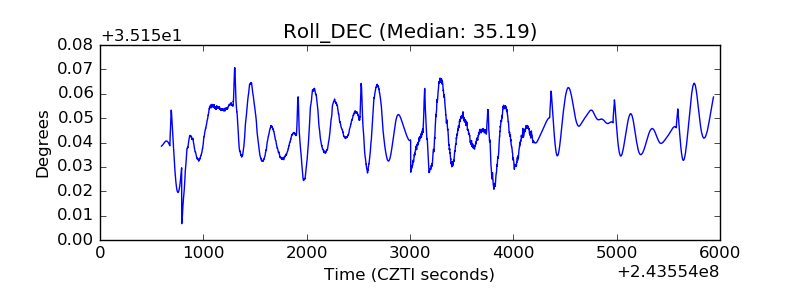 |
| _Roll_RA | 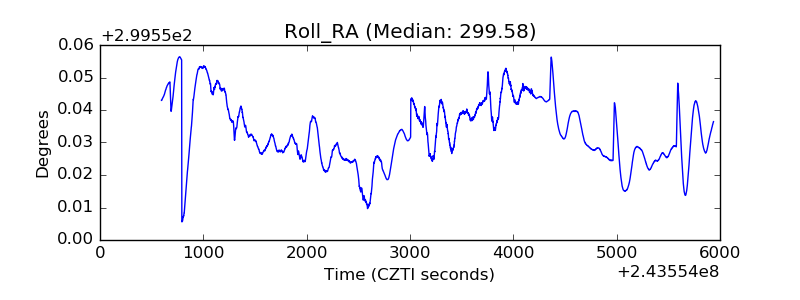 |
| Veto Counter | 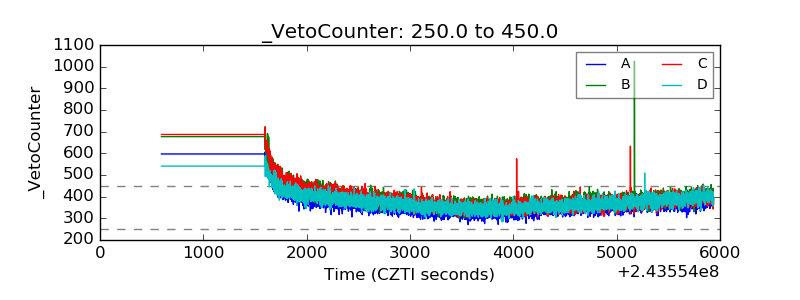 |