| Param | Original file | Final file |
|---|---|---|
| Filename | modeM0/AS1G07_076T01_9000001538cztM0_level2.fits | modeM0/AS1G07_076T01_9000001538cztM0_level2_quad_clean.evt |
| Size (bytes) | 150,920,640 | 126,285,120 |
| Size | 143.9 MB | 120.4 MB |
| Events in quadrant A | 878,942 | 672,186 |
| Events in quadrant B | 856,764 | 680,561 |
| Events in quadrant C | 889,922 | 675,489 |
| Events in quadrant D | 767,904 | 618,862 |
| Mode M9 | |||
|---|---|---|---|
| Quadrant | BADHDUFLAG | Total packets | Discarded packets |
| A | 0 | 3 | 0 |
| B | 0 | 3 | 0 |
| C | 0 | 3 | 0 |
| D | 0 | 3 | 0 |
| Mode M0 | |||
|---|---|---|---|
| Quadrant | BADHDUFLAG | Total packets | Discarded packets |
| A | 0 | 38774 | 0 |
| B | 0 | 43144 | 0 |
| C | 0 | 35981 | 0 |
| D | 0 | 42519 | 0 |
| Mode SS | |||
|---|---|---|---|
| Quadrant | BADHDUFLAG | Total packets | Discarded packets |
| A | 0 | 346 | 0 |
| B | 0 | 344 | 0 |
| C | 0 | 344 | 0 |
| D | 0 | 346 | 0 |
| Quadrant | Total seconds | Saturated seconds | Saturation percentage |
|---|---|---|---|
| A | 17058 | 717 | 4.203306% |
| B | 17058 | 972 | 5.698206% |
| C | 17050 | 291 | 1.706745% |
| D | 17058 | 296 | 1.735256% |
Noise dominated data is calculated using 1-second bins in cleaned event files. If a bin has >2000 counts, and if more than 50% of those come from <1% of pixels, then it is considered to be noise-dominated and hence unusable.
| Quadrant | # 1 sec bins | Bins with >0 counts | Bins with >2000 counts | High rate bins dominated by noise | Noise dominated (total time) | Noise dominated (detector-on time) | Marked lightcurve |
|---|---|---|---|---|---|---|---|
| A | 17483 | 17059 | 0 | 0 | 0.00% | 0.00% | 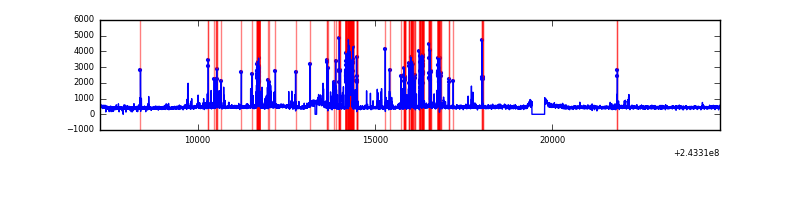 |
| B | 17483 | 17072 | 0 | 0 | 0.00% | 0.00% |  |
| C | 17483 | 17078 | 0 | 0 | 0.00% | 0.00% |  |
| D | 17483 | 17063 | 0 | 0 | 0.00% | 0.00% |  |
Top three noisy pixels from each quadrant. If the there are fewer than three noisy pixels in the level2.evt file, extra rows are filled as -1
| Pixel properties | Quadrant properties | ||||||
|---|---|---|---|---|---|---|---|
| Quadrant | DetID | PixID | Counts | Sigma | Mean | Median | Sigma |
| A | 14 | 188 | 870 | 10.83 | 228 | 212 | 60.8 |
| A | 0 | 29 | 837 | 10.29 | 228 | 212 | 60.8 |
| A | 14 | 204 | 741 | 8.71 | 228 | 212 | 60.8 |
| B | 2 | 9 | 759 | 11.51 | 225 | 214 | 47.3 |
| B | 3 | 17 | 586 | 7.86 | 225 | 214 | 47.3 |
| B | 14 | 254 | 584 | 7.82 | 225 | 214 | 47.3 |
| C | 12 | 241 | 662 | 7.11 | 235 | 218 | 62.4 |
| C | 2 | 191 | 619 | 6.42 | 235 | 218 | 62.4 |
| C | 3 | 158 | 599 | 6.1 | 235 | 218 | 62.4 |
| D | 3 | 14 | 602 | 6.61 | 219 | 198 | 61.1 |
| D | 3 | 31 | 596 | 6.51 | 219 | 198 | 61.1 |
| D | 6 | 231 | 554 | 5.83 | 219 | 198 | 61.1 |
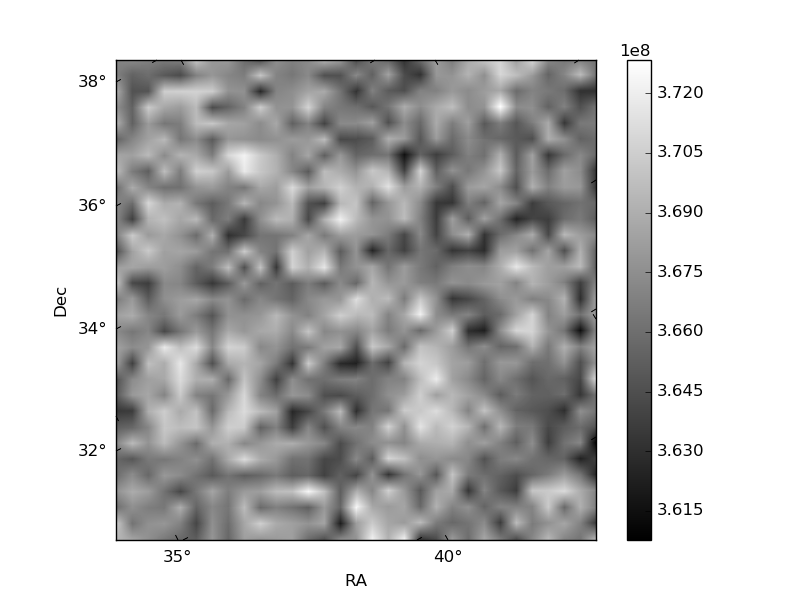
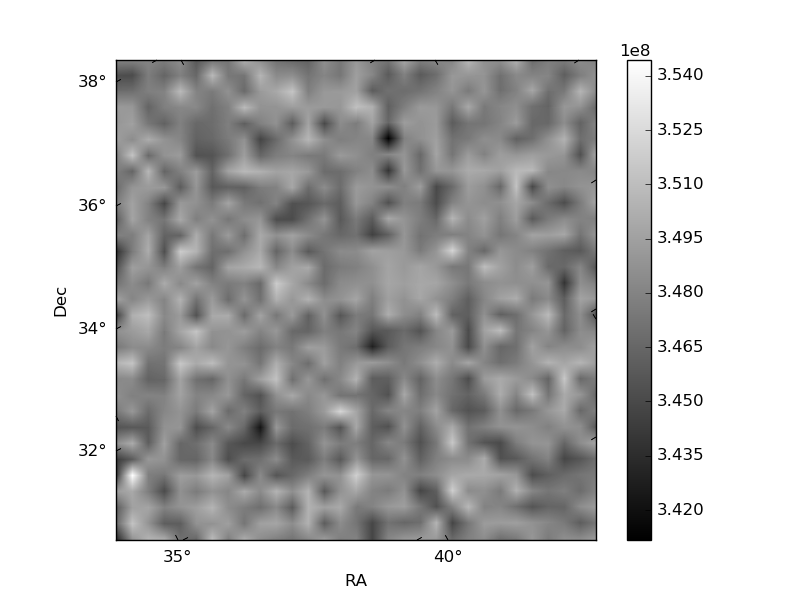
Histogram calculated using DETX and DETY for each event in the final _common_clean file
| Quadrant A |  |
 |
Quadrant B |
|---|---|---|---|
| Quadrant D | 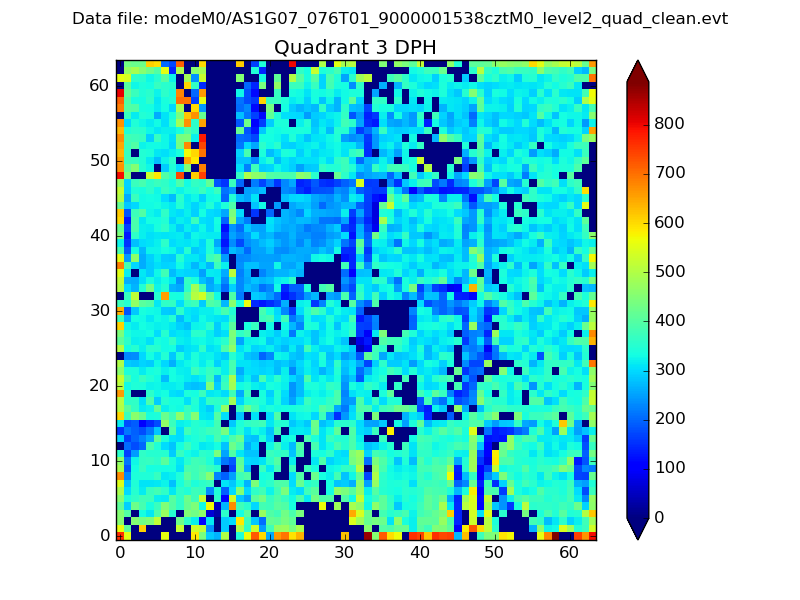 |
 |
Quadrant C |
| Plot type | Count rate plots | Images |
|---|---|---|
| Comparison with Poisson distribution Blue bars denote a histogram of data divided into 1 sec bins. Red curve is a Poisson curve with rate = median count rate of data. |
 |
 |
| Quadrant-wise count rates Data is divided into 100 sec bins |
 |
|
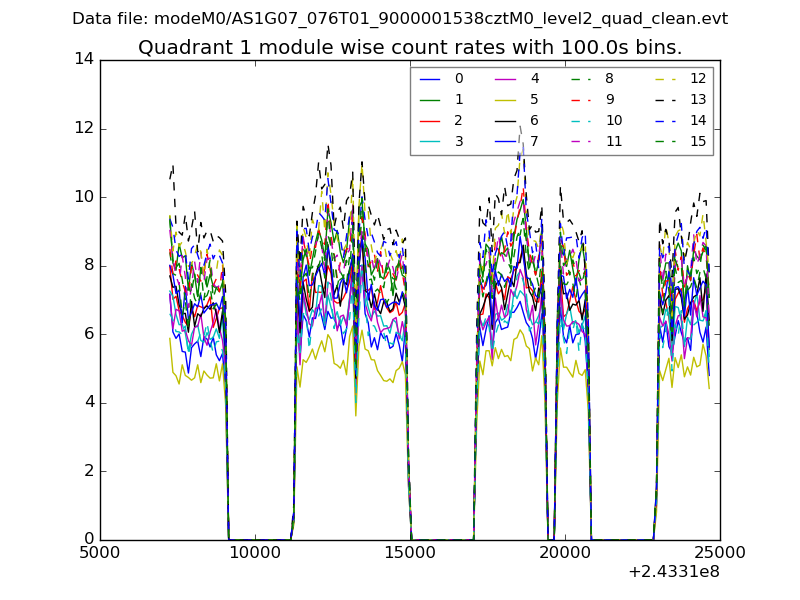
| Module-wise count rates for Quadrant A Data is divided into 100 sec bins |
 |
 |
| Module-wise count rates for Quadrant B Data is divided into 100 sec bins |
 |
 |
| Module-wise count rates for Quadrant C Data is divided into 100 sec bins |
 |
 |
| Module-wise count rates for Quadrant D Data is divided into 100 sec bins |
 |
 |
| Parameter | Plot |
|---|---|
| CZT HV Monitor | 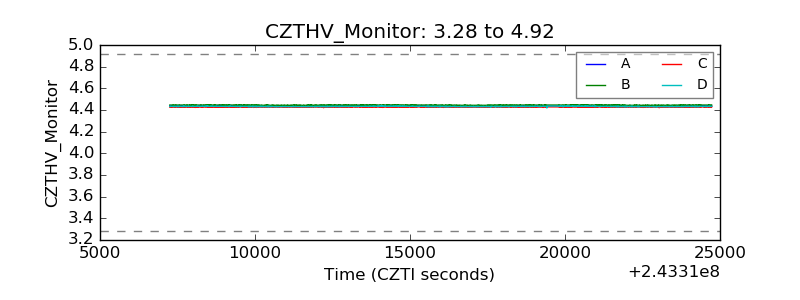 |
| D_VDD | 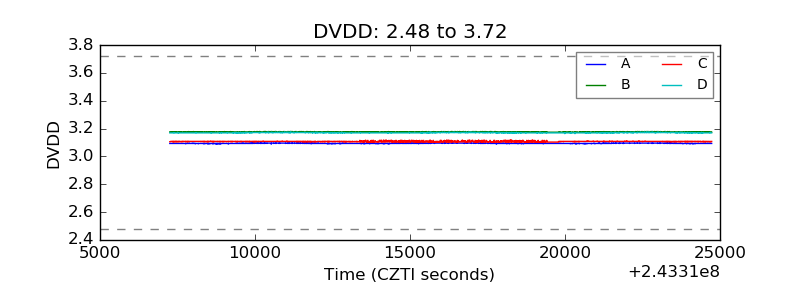 |
| Temperature 1 |  |
| Veto HV Monitor |  |
| Veto LLD |  |
| Alpha Counter |  |
| _CPM_Rate |  |
| CZT Counter |  |
| +2.5 Volts monitor |  |
| +5 Volts monitor |  |
| _ROLL_ROT | 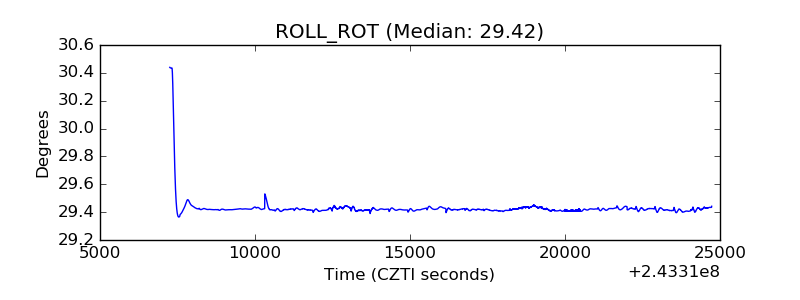 |
| _Roll_DEC |  |
| _Roll_RA |  |
| Veto Counter | 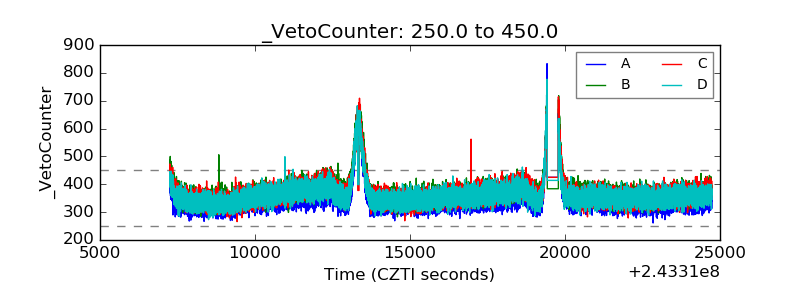 |