| Param | Original file | Final file |
|---|---|---|
| Filename | modeM0/AS1G07_076T01_9000001538_10657cztM0_level2.evt | modeM0/AS1G07_076T01_9000001538_10657cztM0_level2_quad_clean.evt |
| Size (bytes) | 93,240,000 | 24,215,040 |
| Size | 88.9 MB | 23.1 MB |
| Events in quadrant A | 581,564 | 156,383 |
| Events in quadrant B | 745,381 | 160,161 |
| Events in quadrant C | 705,865 | 159,806 |
| Events in quadrant D | 694,380 | 153,724 |
| Mode M0 | |||
|---|---|---|---|
| Quadrant | BADHDUFLAG | Total packets | Discarded packets |
| A | 0 | 2832 | 39 |
| B | 0 | 3190 | 47 |
| C | 0 | 3201 | 70 |
| D | 0 | 2986 | 40 |
| Mode SS | |||
|---|---|---|---|
| Quadrant | BADHDUFLAG | Total packets | Discarded packets |
| A | 0 | 28 | 0 |
| B | 0 | 28 | 2 |
| C | 0 | 28 | 2 |
| D | 0 | 28 | 0 |
| Quadrant | Total seconds | Saturated seconds | Saturation percentage |
|---|---|---|---|
| A | 1380 | 2 | 0.144928% |
| B | 1380 | 12 | 0.869565% |
| C | 1372 | 32 | 2.332362% |
| D | 1380 | 1 | 0.072464% |
Noise dominated data is calculated using 1-second bins in cleaned event files. If a bin has >2000 counts, and if more than 50% of those come from <1% of pixels, then it is considered to be noise-dominated and hence unusable.
| Quadrant | # 1 sec bins | Bins with >0 counts | Bins with >2000 counts | High rate bins dominated by noise | Noise dominated (total time) | Noise dominated (detector-on time) | Marked lightcurve |
|---|---|---|---|---|---|---|---|
| A | 1399 | 1398 | 1 | 1 | 0.07% | 0.07% | 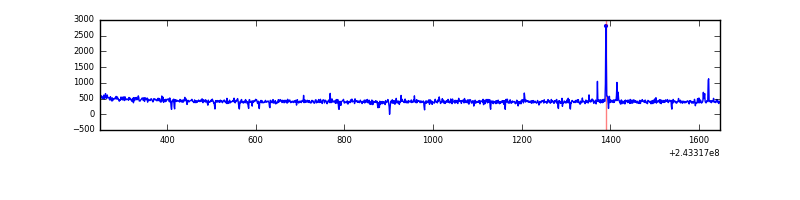 |
| B | 1399 | 1398 | 9 | 9 | 0.64% | 0.64% | 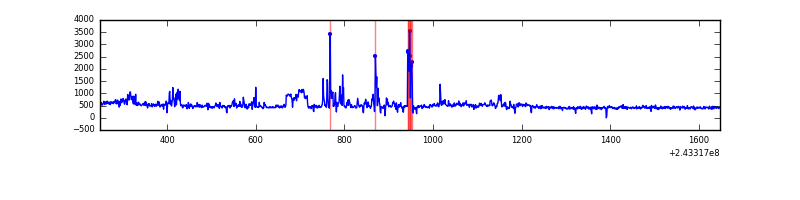 |
| C | 1399 | 1399 | 27 | 27 | 1.93% | 1.93% | 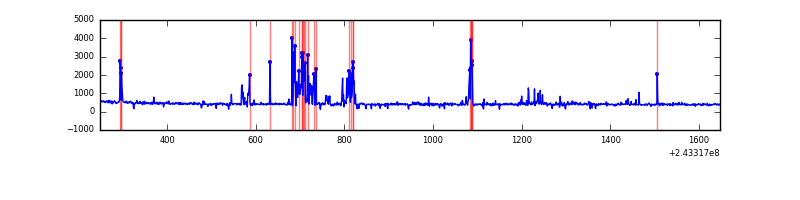 |
| D | 1399 | 1398 | 2 | 2 | 0.14% | 0.14% | 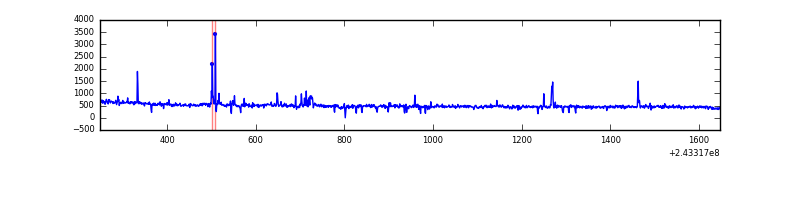 |
Top three noisy pixels from each quadrant. If the there are fewer than three noisy pixels in the level2.evt file, extra rows are filled as -1
| Pixel properties | Quadrant properties | ||||||
|---|---|---|---|---|---|---|---|
| Quadrant | DetID | PixID | Counts | Sigma | Mean | Median | Sigma |
| A | 15 | 223 | 8884 | 272.27 | 147 | 143 | 32.1 |
| A | 15 | 239 | 3675 | 110.02 | 147 | 143 | 32.1 |
| A | 1 | 162 | 1793 | 51.4 | 147 | 143 | 32.1 |
| B | 4 | 239 | 82444 | 2606.09 | 149 | 145 | 31.6 |
| B | 4 | 81 | 44828 | 1414.94 | 149 | 145 | 31.6 |
| B | 15 | 204 | 16131 | 506.21 | 149 | 145 | 31.6 |
| C | 4 | 254 | 136679 | 3886.67 | 143 | 144 | 35.1 |
| C | 14 | 234 | 5676 | 157.48 | 143 | 144 | 35.1 |
| C | 1 | 0 | 2334 | 62.34 | 143 | 144 | 35.1 |
| D | 1 | 20 | 116396 | 3279.75 | 140 | 136 | 35.4 |
| D | 13 | 249 | 13841 | 386.63 | 140 | 136 | 35.4 |
| D | 1 | 52 | 12378 | 345.35 | 140 | 136 | 35.4 |
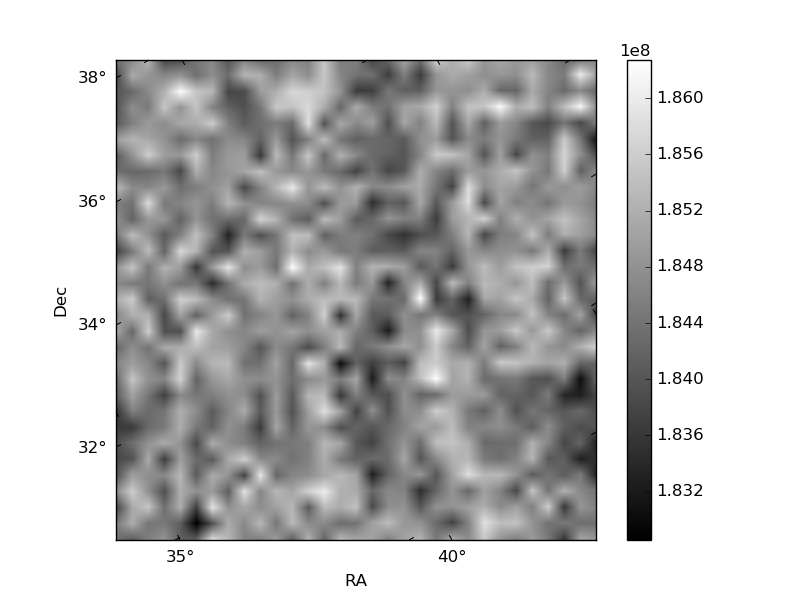
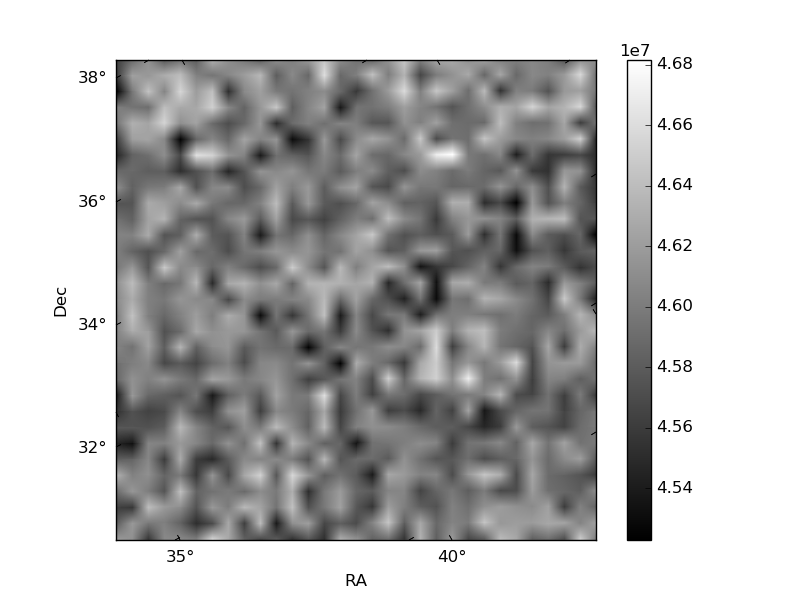
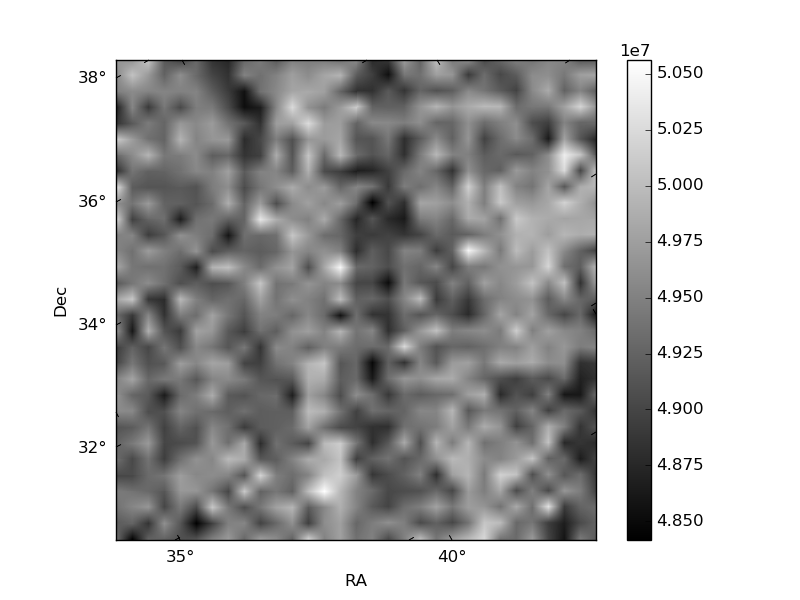
Histogram calculated using DETX and DETY for each event in the final _common_clean file
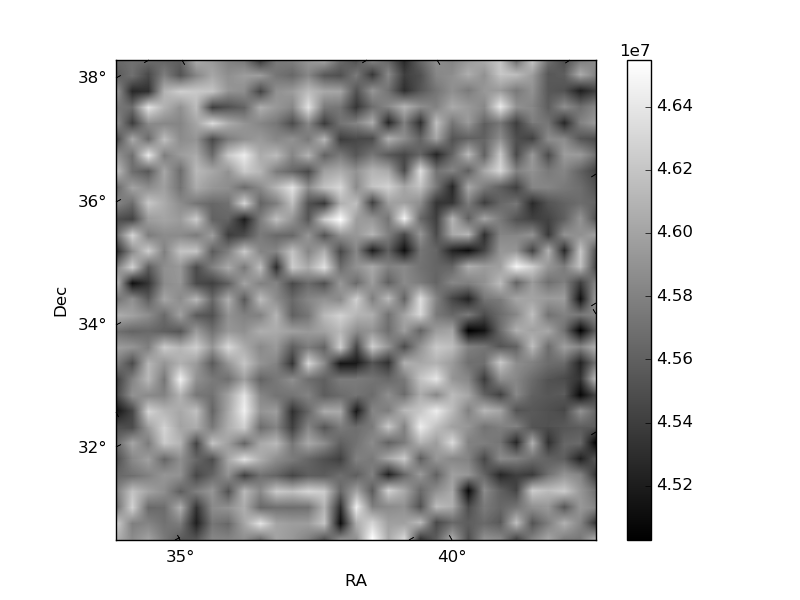
| Quadrant A | 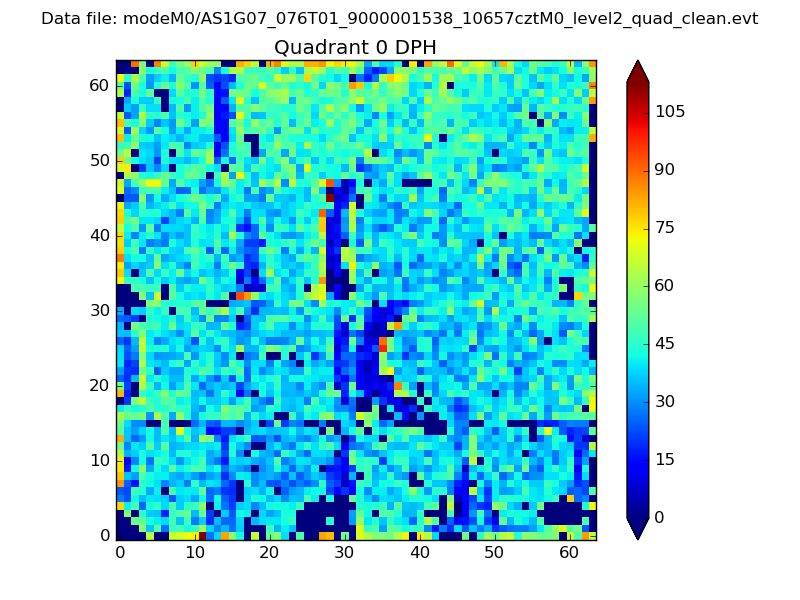 |
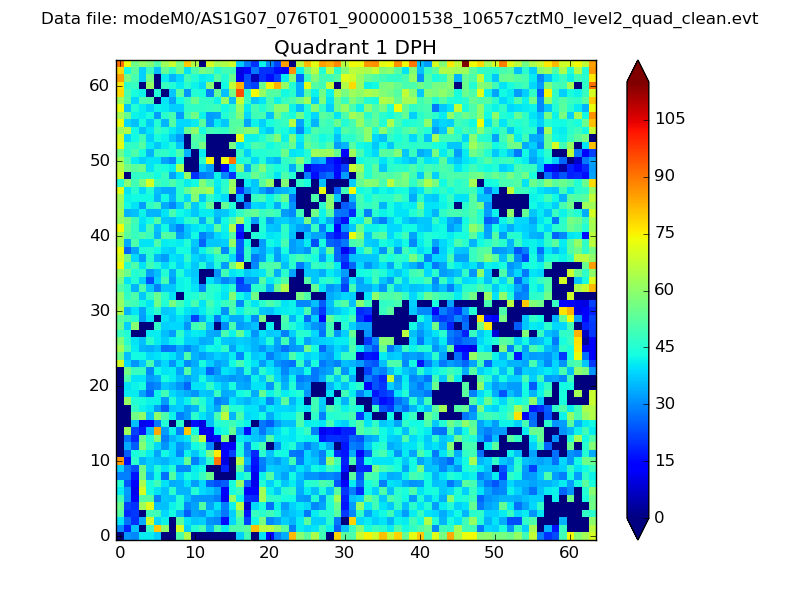 |
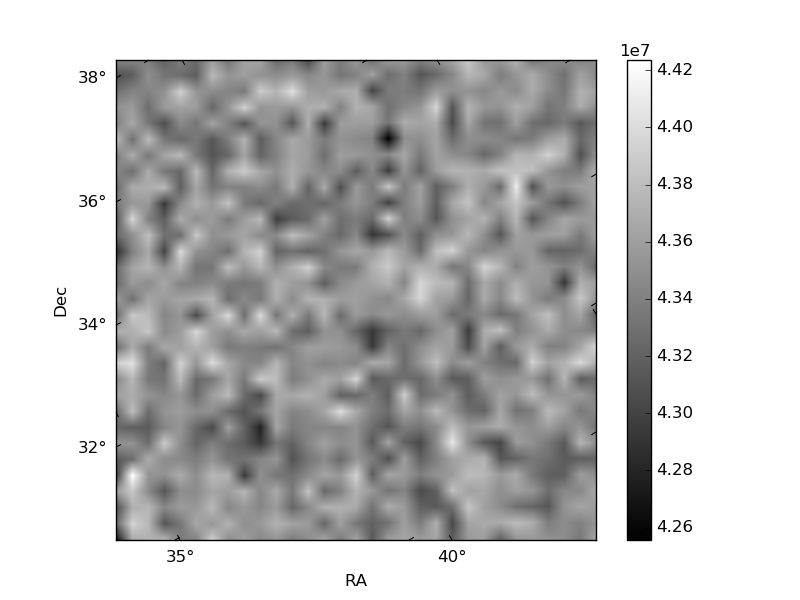
Quadrant B |
|---|---|---|---|
| Quadrant D | 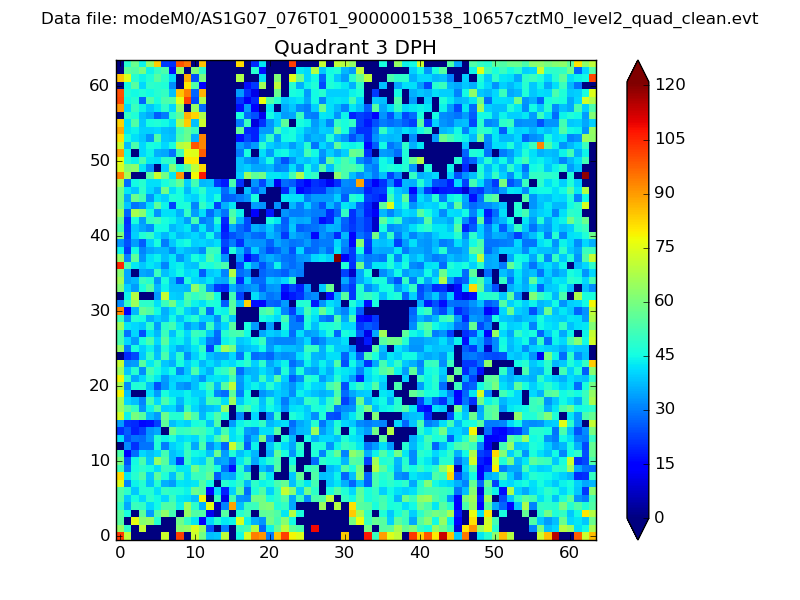 |
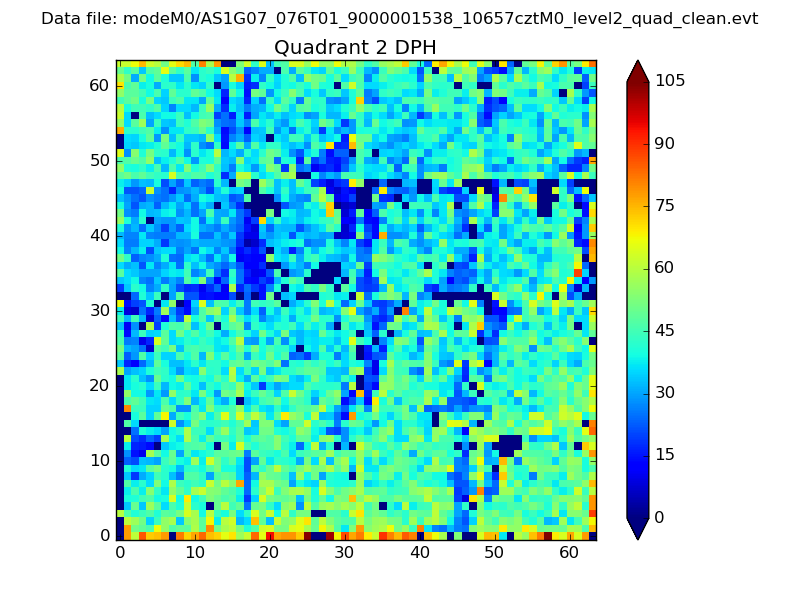 |
Quadrant C |
| Plot type | Count rate plots | Images |
|---|---|---|
| Comparison with Poisson distribution Blue bars denote a histogram of data divided into 1 sec bins. Red curve is a Poisson curve with rate = median count rate of data. |
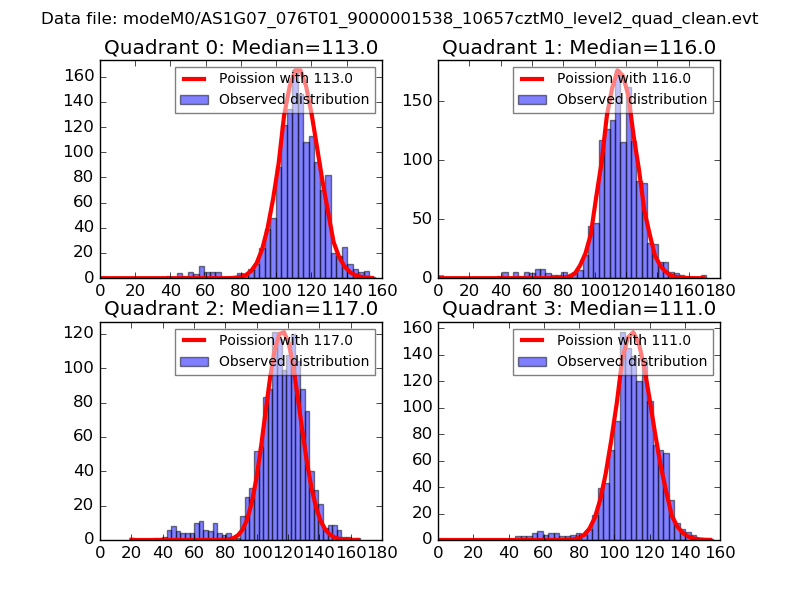 |
 |
| Quadrant-wise count rates Data is divided into 100 sec bins |
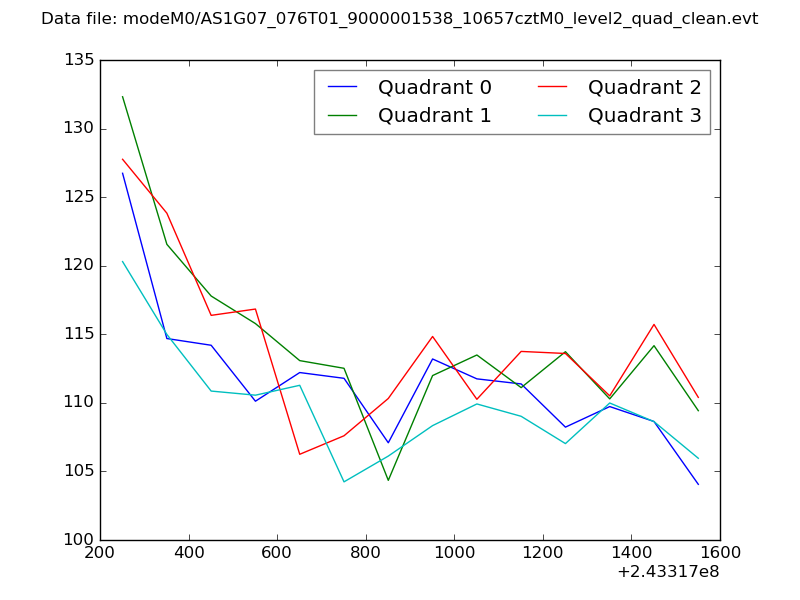 |
|
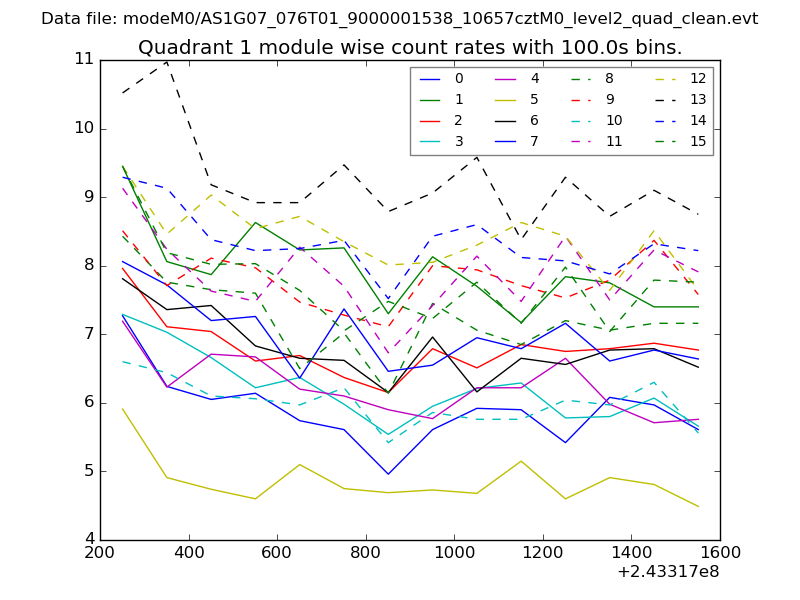
| Module-wise count rates for Quadrant A Data is divided into 100 sec bins |
 |
 |
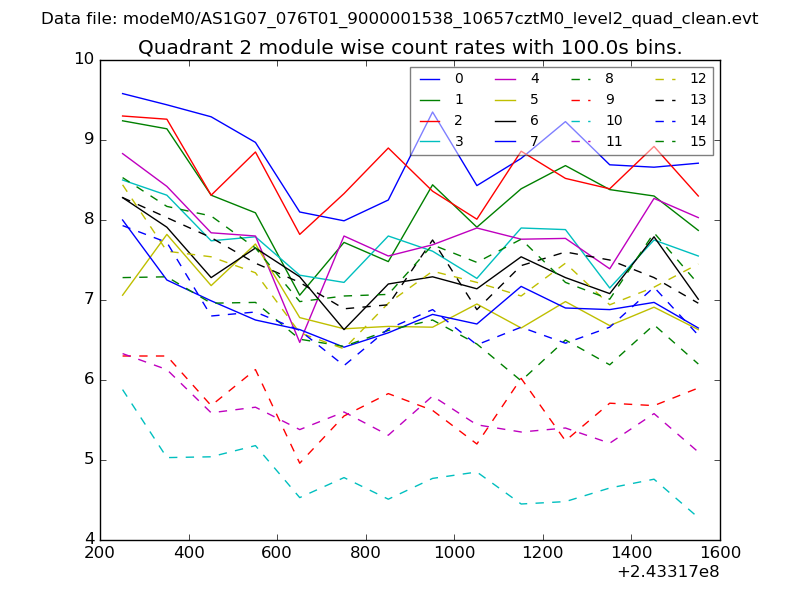
| Module-wise count rates for Quadrant B Data is divided into 100 sec bins |
 |
 |
| Module-wise count rates for Quadrant C Data is divided into 100 sec bins |
 |
 |
| Module-wise count rates for Quadrant D Data is divided into 100 sec bins |
 |
 |
| Parameter | Plot |
|---|---|
| CZT HV Monitor | 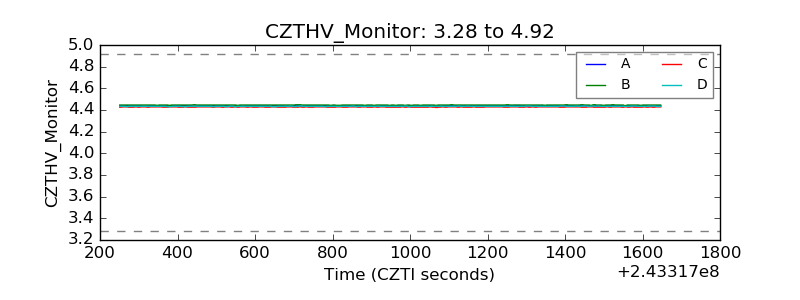 |
| D_VDD | 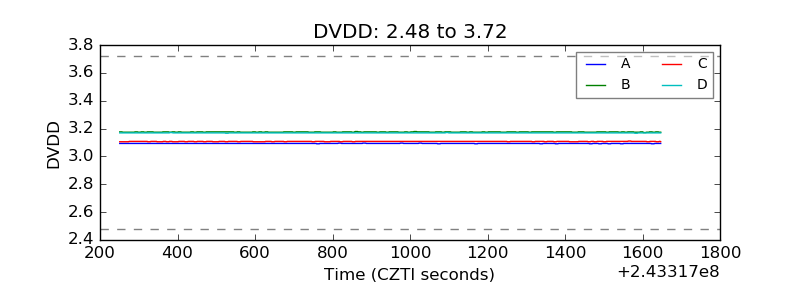 |
| Temperature 1 | 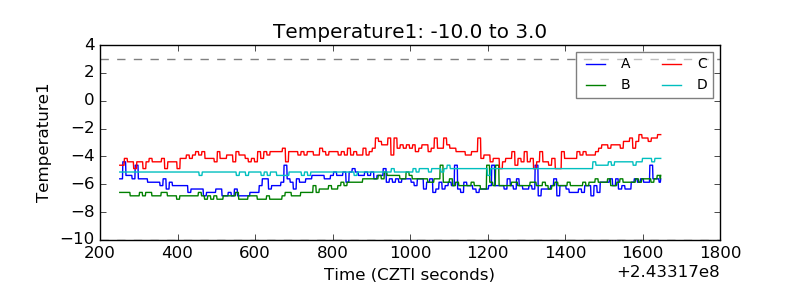 |
| Veto HV Monitor | 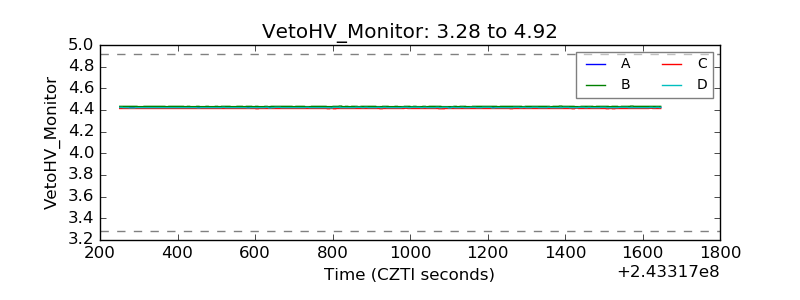 |
| Veto LLD | 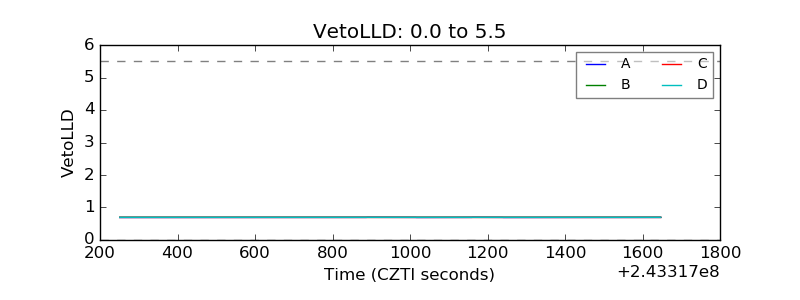 |
| Alpha Counter | 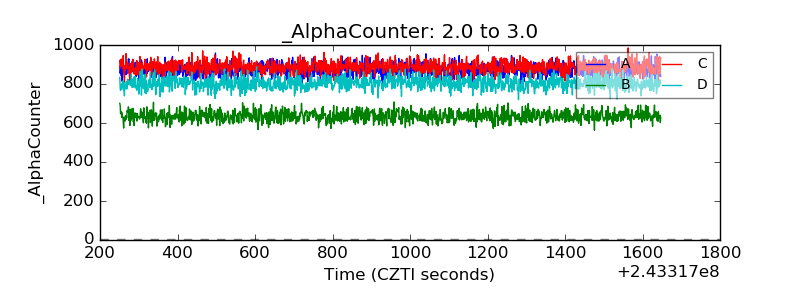 |
| _CPM_Rate | 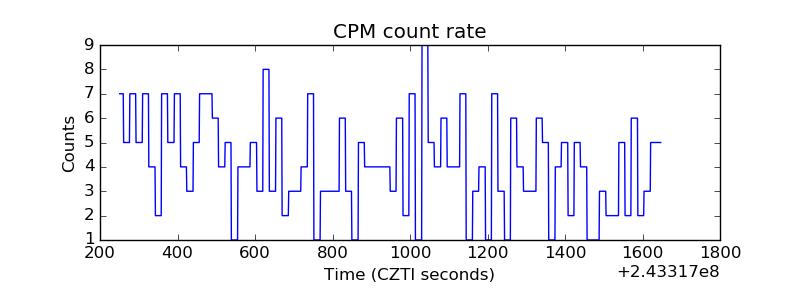 |
| CZT Counter | 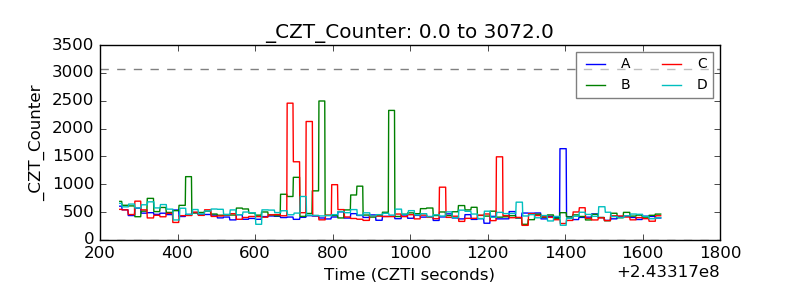 |
| +2.5 Volts monitor |  |
| +5 Volts monitor |  |
| _ROLL_ROT | 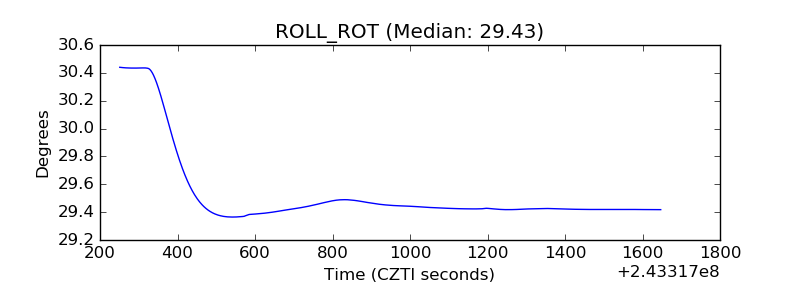 |
| _Roll_DEC | 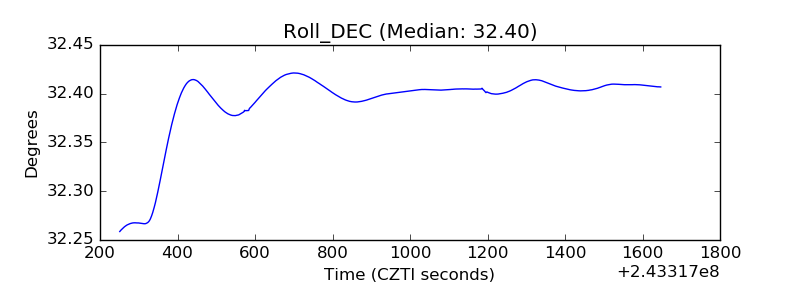 |
| _Roll_RA | 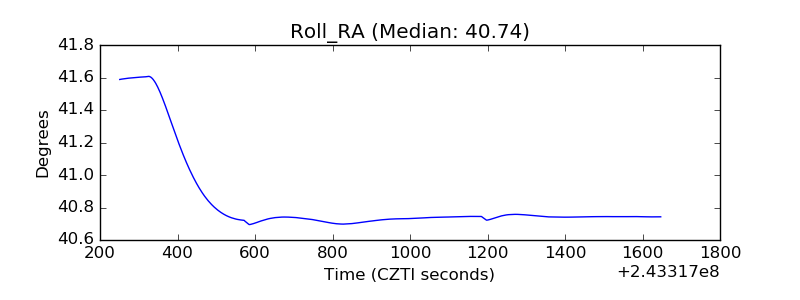 |
| Veto Counter |  |