| Param | Original file | Final file |
|---|---|---|
| Filename | modeM0/AS1G07_076T01_9000001538_10661cztM0_level2.evt | modeM0/AS1G07_076T01_9000001538_10661cztM0_level2_quad_clean.evt |
| Size (bytes) | 825,338,880 | 125,268,480 |
| Size | 787.1 MB | 119.5 MB |
| Events in quadrant A | 5,883,147 | 750,319 |
| Events in quadrant B | 6,872,029 | 769,473 |
| Events in quadrant C | 4,967,638 | 779,708 |
| Events in quadrant D | 6,536,988 | 741,389 |
| Mode M9 | |||
|---|---|---|---|
| Quadrant | BADHDUFLAG | Total packets | Discarded packets |
| A | 0 | 3 | 0 |
| B | 0 | 3 | 0 |
| C | 0 | 3 | 0 |
| D | 0 | 3 | 0 |
| Mode M0 | |||
|---|---|---|---|
| Quadrant | BADHDUFLAG | Total packets | Discarded packets |
| A | 0 | 24967 | 3 |
| B | 0 | 27517 | 1 |
| C | 0 | 22466 | 1 |
| D | 0 | 26678 | 6 |
| Mode SS | |||
|---|---|---|---|
| Quadrant | BADHDUFLAG | Total packets | Discarded packets |
| A | 0 | 220 | 0 |
| B | 0 | 220 | 0 |
| C | 0 | 220 | 0 |
| D | 0 | 220 | 0 |
| Quadrant | Total seconds | Saturated seconds | Saturation percentage |
|---|---|---|---|
| A | 10869 | 422 | 3.882602% |
| B | 10870 | 551 | 5.068997% |
| C | 10870 | 102 | 0.938362% |
| D | 10868 | 118 | 1.085756% |
Noise dominated data is calculated using 1-second bins in cleaned event files. If a bin has >2000 counts, and if more than 50% of those come from <1% of pixels, then it is considered to be noise-dominated and hence unusable.
| Quadrant | # 1 sec bins | Bins with >0 counts | Bins with >2000 counts | High rate bins dominated by noise | Noise dominated (total time) | Noise dominated (detector-on time) | Marked lightcurve |
|---|---|---|---|---|---|---|---|
| A | 11231 | 10871 | 216 | 216 | 1.92% | 1.99% | 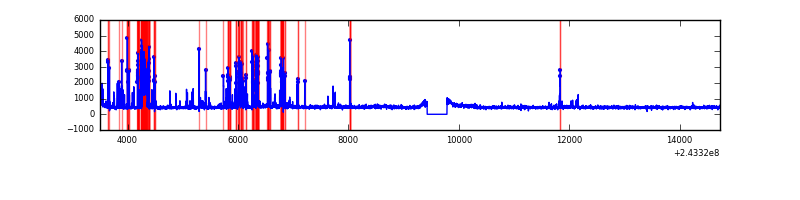 |
| B | 11231 | 10872 | 286 | 286 | 2.55% | 2.63% | 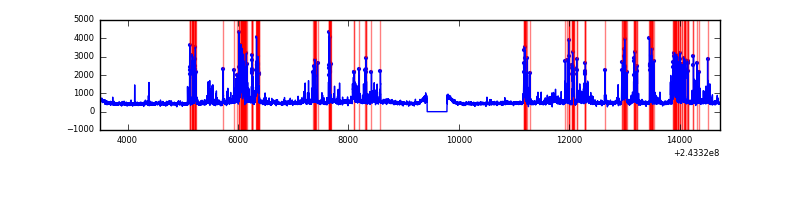 |
| C | 11231 | 10872 | 24 | 24 | 0.21% | 0.22% | 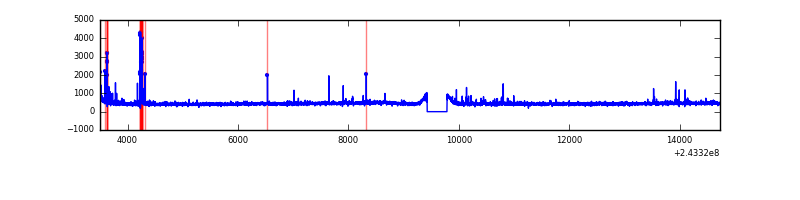 |
| D | 11231 | 10872 | 23 | 23 | 0.20% | 0.21% | 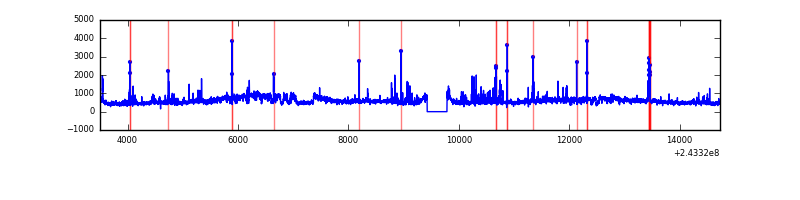 |
Top three noisy pixels from each quadrant. If the there are fewer than three noisy pixels in the level2.evt file, extra rows are filled as -1
| Pixel properties | Quadrant properties | ||||||
|---|---|---|---|---|---|---|---|
| Quadrant | DetID | PixID | Counts | Sigma | Mean | Median | Sigma |
| A | 15 | 223 | 563061 | 2241.83 | 1223 | 1194 | 250.6 |
| A | 15 | 239 | 247495 | 982.73 | 1223 | 1194 | 250.6 |
| A | 15 | 174 | 211868 | 840.58 | 1223 | 1194 | 250.6 |
| B | 4 | 239 | 1627554 | 6863.2 | 1231 | 1197 | 237.0 |
| B | 15 | 204 | 279956 | 1176.36 | 1231 | 1197 | 237.0 |
| B | 0 | 214 | 64124 | 265.55 | 1231 | 1197 | 237.0 |
| C | 4 | 254 | 202491 | 717.76 | 1210 | 1216 | 280.4 |
| C | 4 | 175 | 13011 | 42.06 | 1210 | 1216 | 280.4 |
| C | 8 | 128 | 11741 | 37.53 | 1210 | 1216 | 280.4 |
| D | 1 | 20 | 1400467 | 4796.9 | 1201 | 1166 | 291.7 |
| D | 13 | 249 | 211228 | 720.11 | 1201 | 1166 | 291.7 |
| D | 8 | 195 | 154112 | 524.31 | 1201 | 1166 | 291.7 |
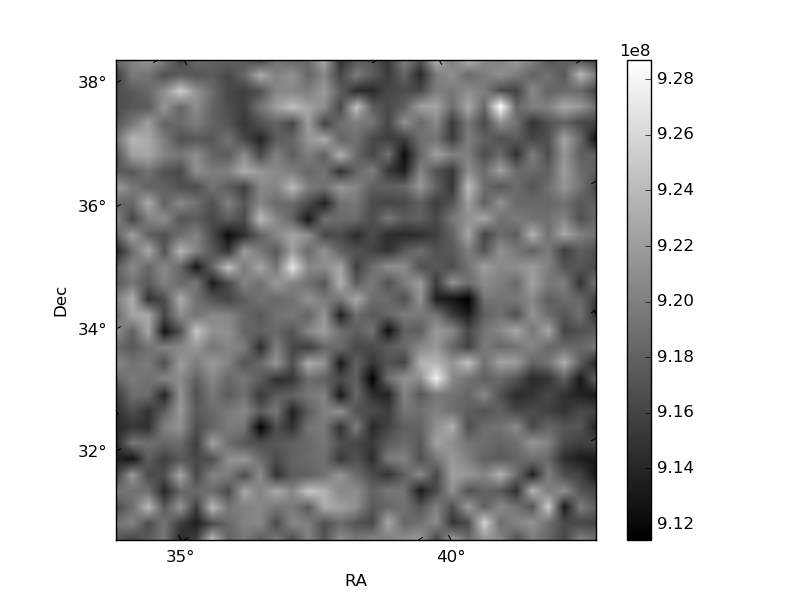
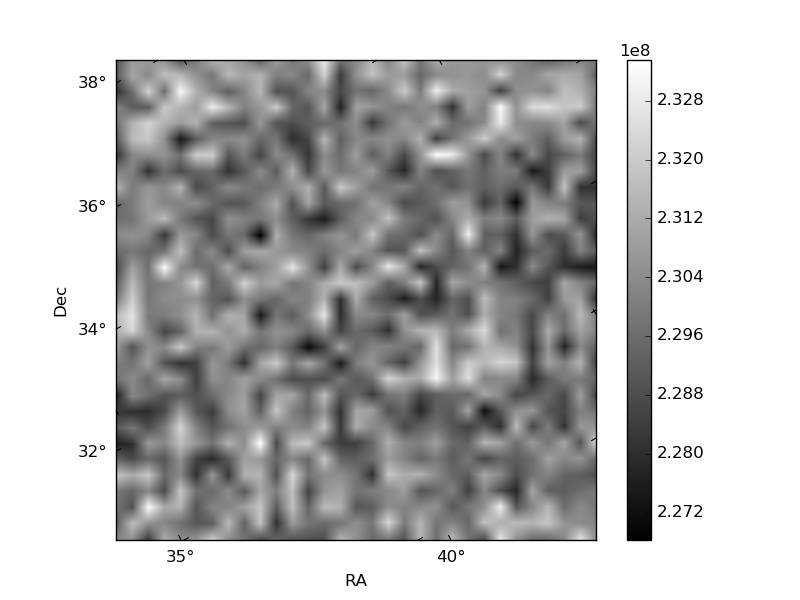
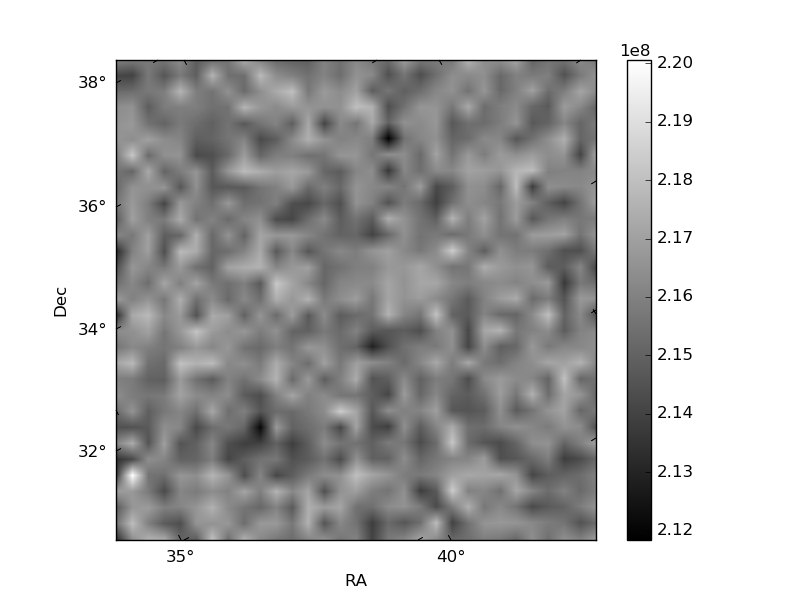
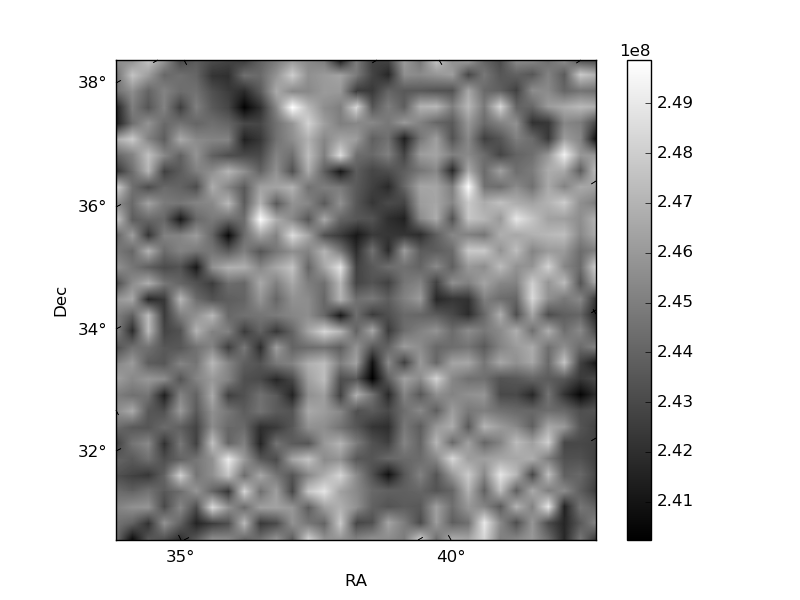
Histogram calculated using DETX and DETY for each event in the final _common_clean file
| Quadrant A | 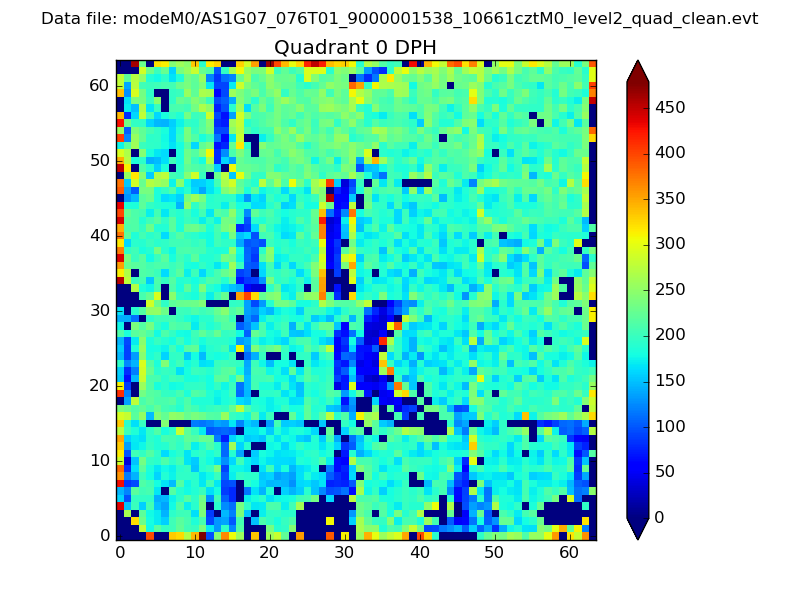 |
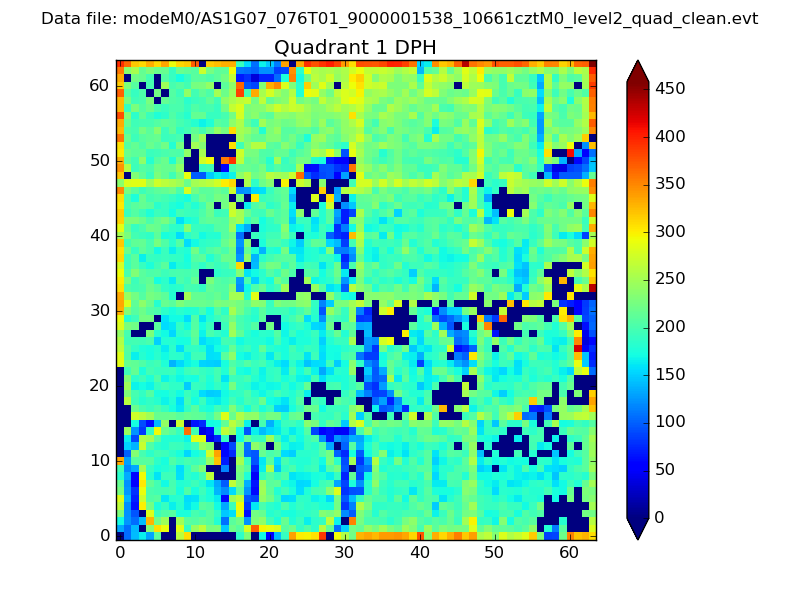 |
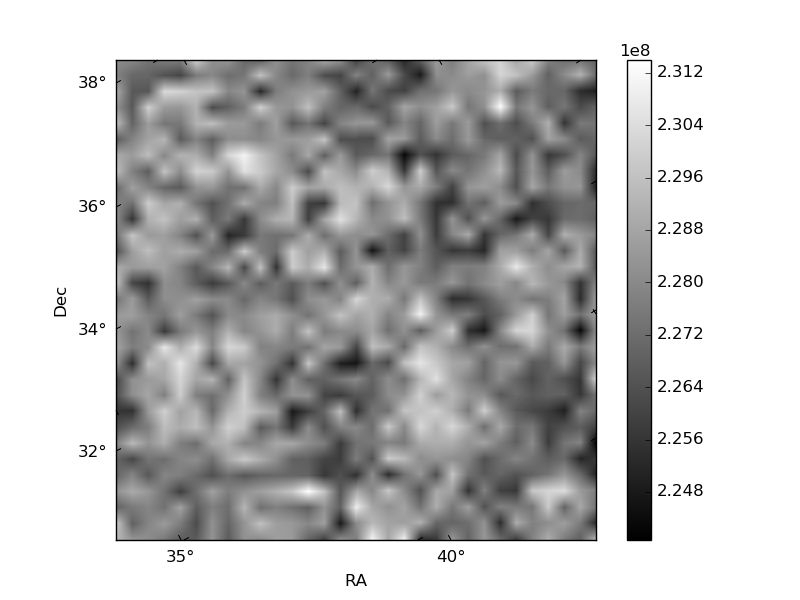
Quadrant B |
|---|---|---|---|
| Quadrant D | 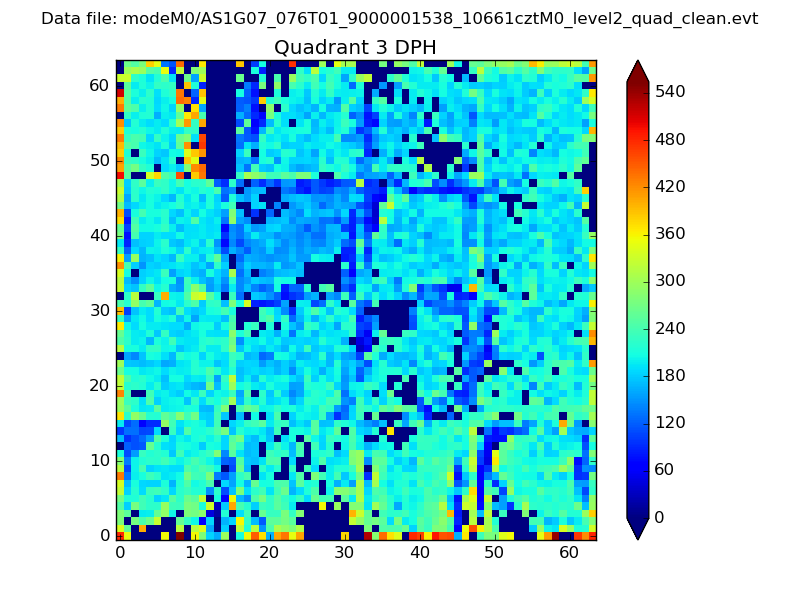 |
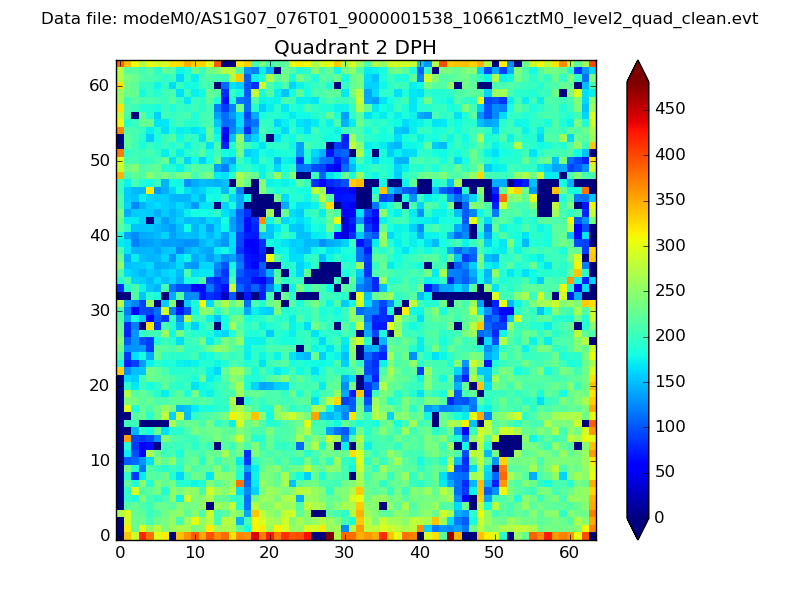 |
Quadrant C |
| Plot type | Count rate plots | Images |
|---|---|---|
| Comparison with Poisson distribution Blue bars denote a histogram of data divided into 1 sec bins. Red curve is a Poisson curve with rate = median count rate of data. |
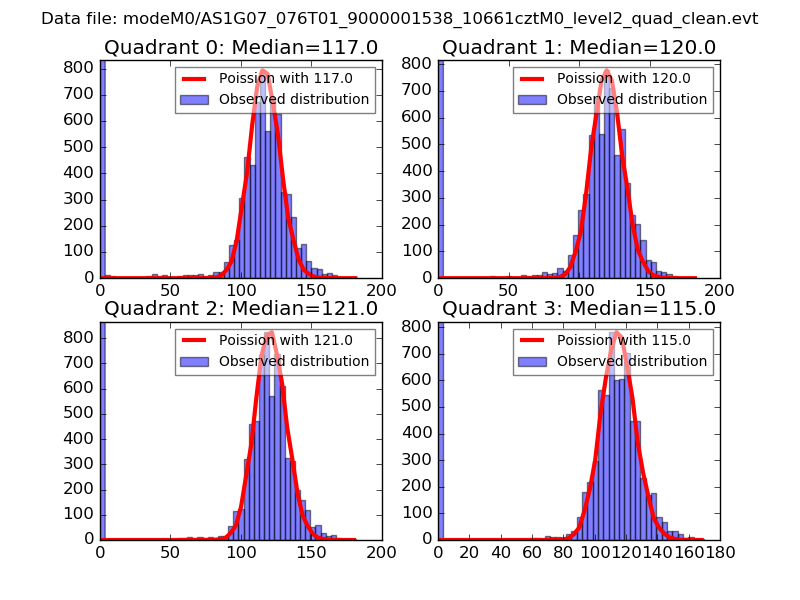 |
 |
| Quadrant-wise count rates Data is divided into 100 sec bins |
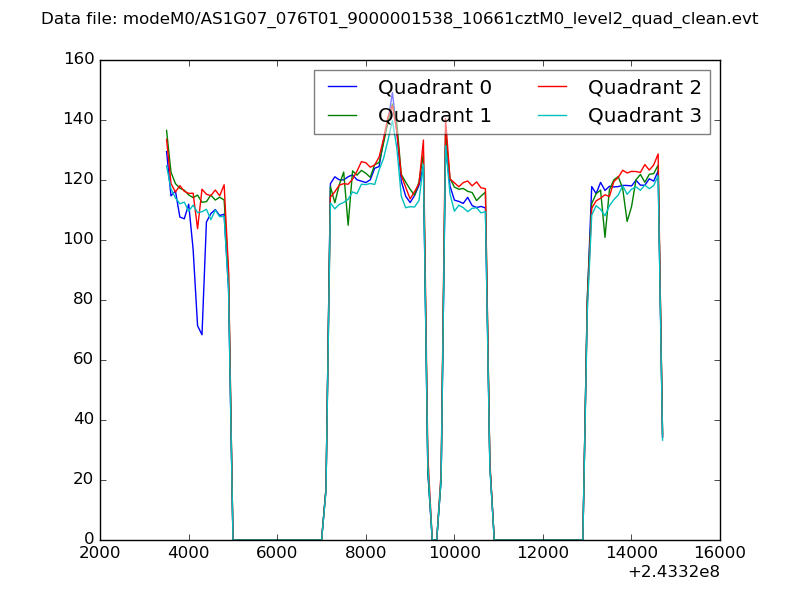 |
|
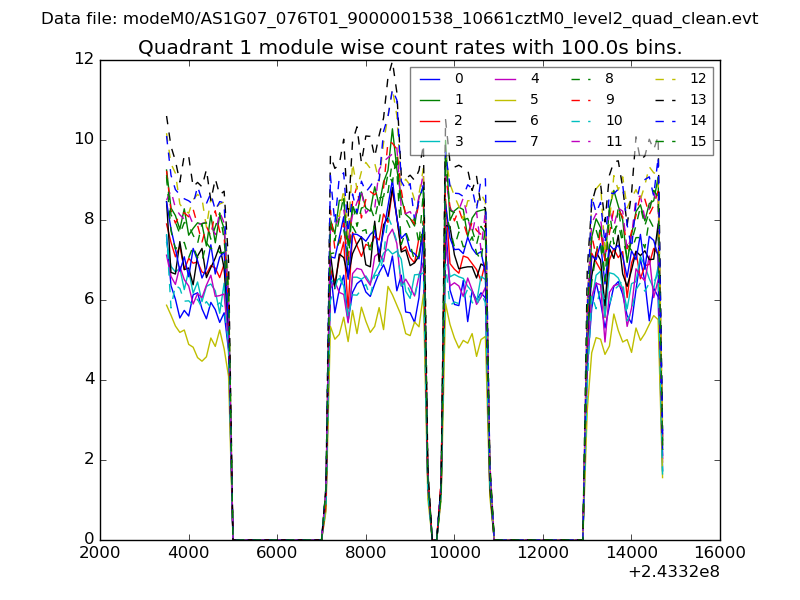
| Module-wise count rates for Quadrant A Data is divided into 100 sec bins |
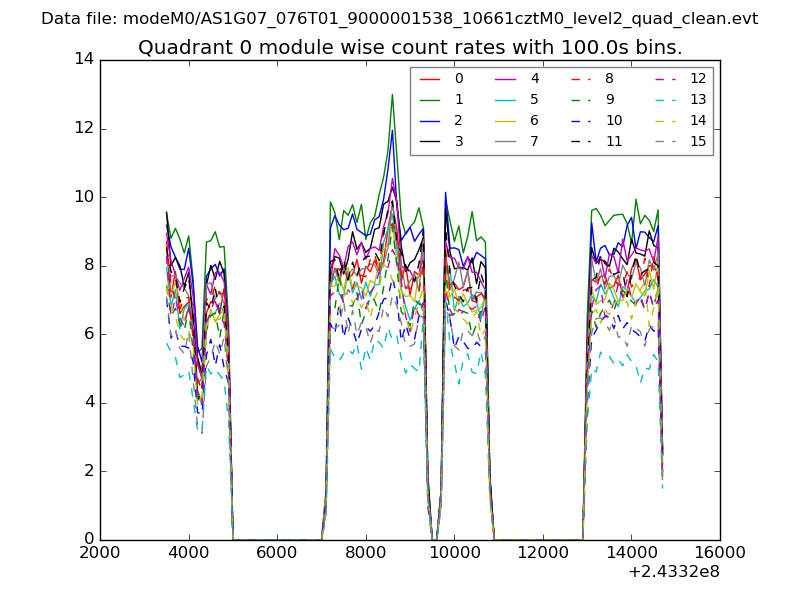 |
 |
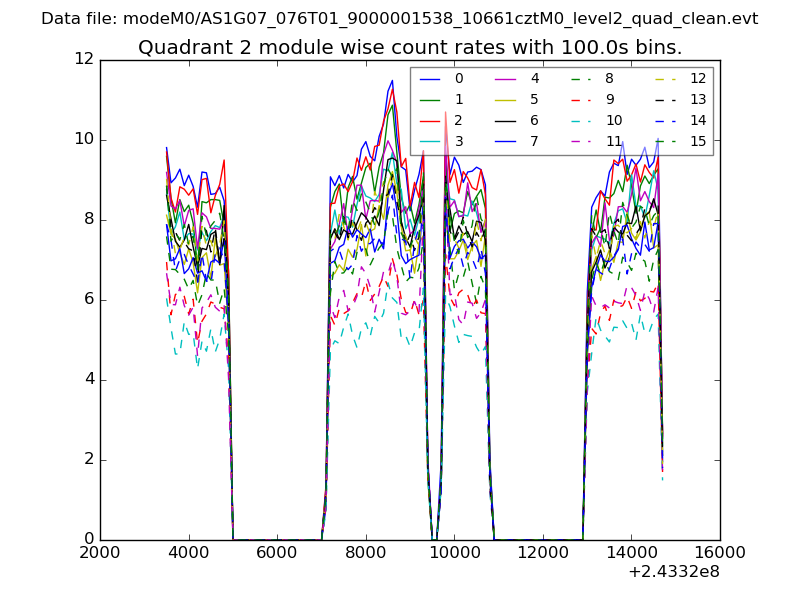
| Module-wise count rates for Quadrant B Data is divided into 100 sec bins |
 |
 |
| Module-wise count rates for Quadrant C Data is divided into 100 sec bins |
 |
 |
| Module-wise count rates for Quadrant D Data is divided into 100 sec bins |
 |
 |
| Parameter | Plot |
|---|---|
| CZT HV Monitor | 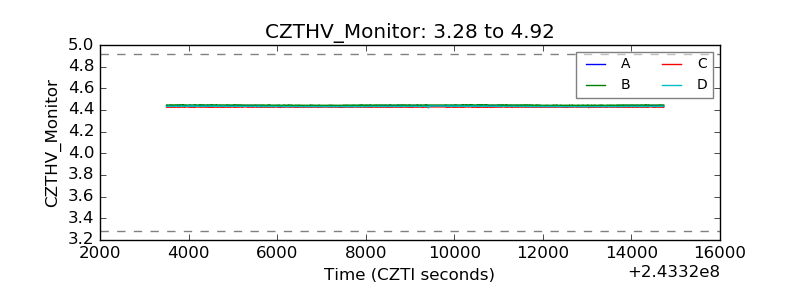 |
| D_VDD | 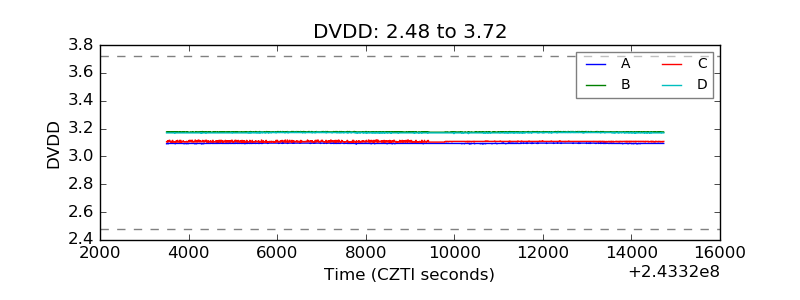 |
| Temperature 1 | 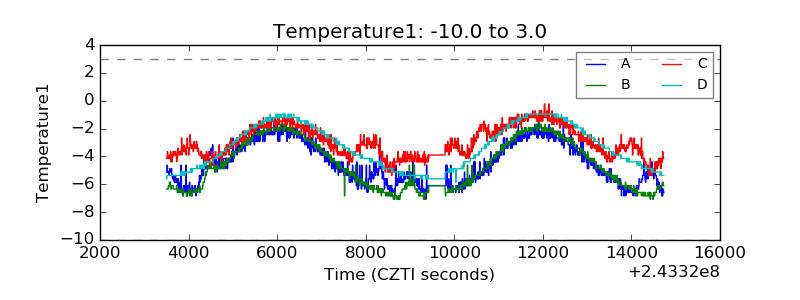 |
| Veto HV Monitor | 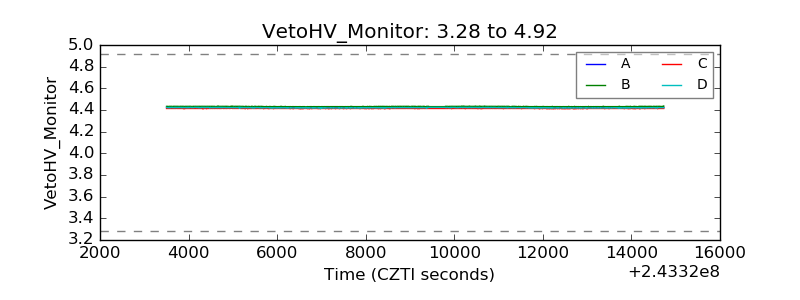 |
| Veto LLD | 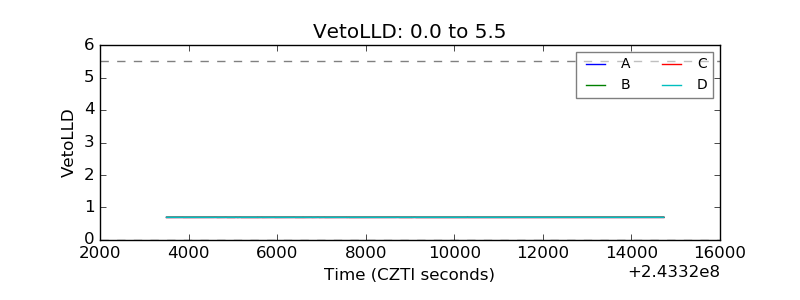 |
| Alpha Counter | 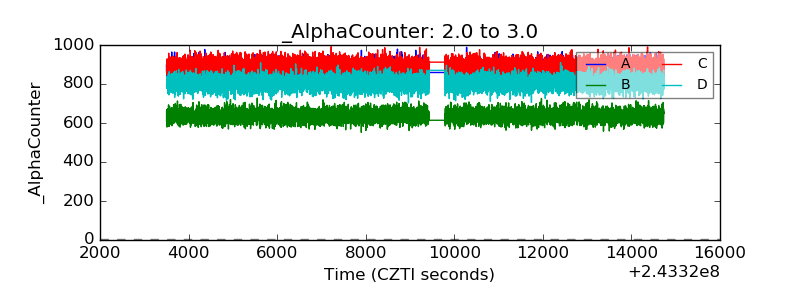 |
| _CPM_Rate |  |
| CZT Counter | 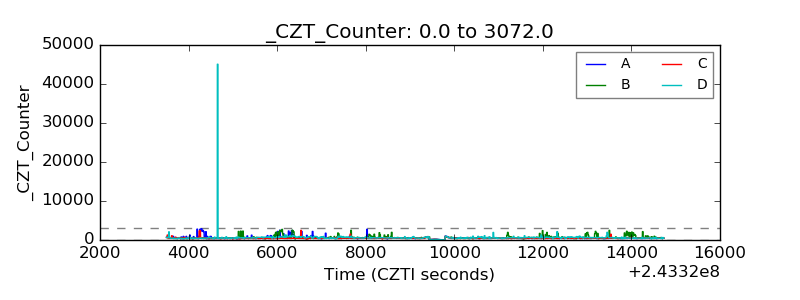 |
| +2.5 Volts monitor |  |
| +5 Volts monitor |  |
| _ROLL_ROT | 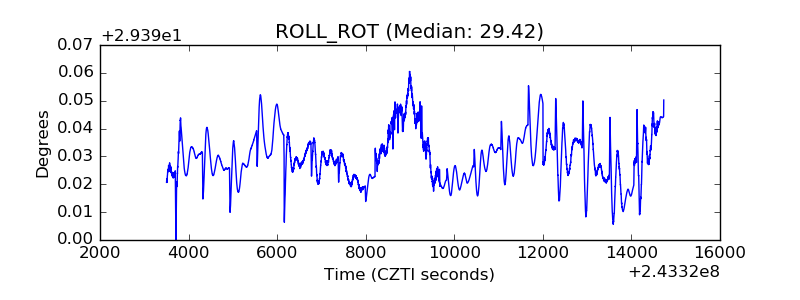 |
| _Roll_DEC | 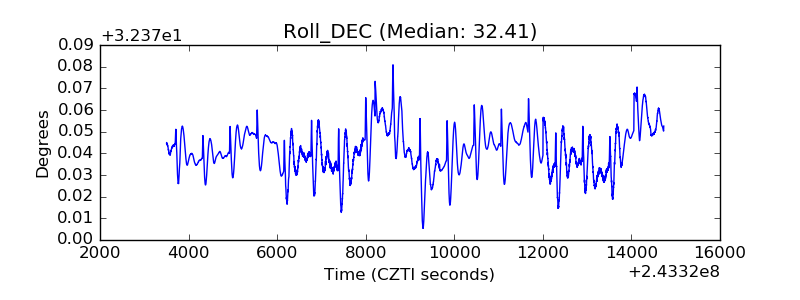 |
| _Roll_RA | 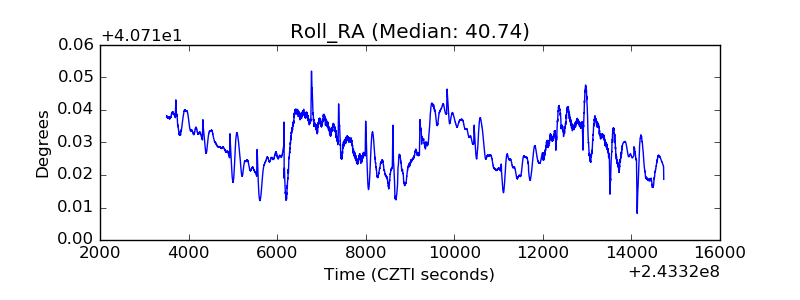 |
| Veto Counter | 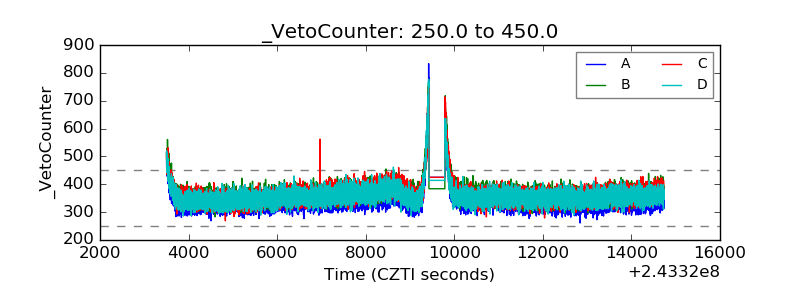 |