| Param | Original file | Final file |
|---|---|---|
| Filename | modeM0/AS1G07_076T01_9000001538_10662cztM0_level2.evt | modeM0/AS1G07_076T01_9000001538_10662cztM0_level2_quad_clean.evt |
| Size (bytes) | 1,271,995,200 | 193,795,200 |
| Size | 1.2 GB | 184.8 MB |
| Events in quadrant A | 8,882,129 | 1,165,238 |
| Events in quadrant B | 10,496,271 | 1,194,794 |
| Events in quadrant C | 7,811,094 | 1,210,771 |
| Events in quadrant D | 10,209,435 | 1,151,243 |
| Mode M9 | |||
|---|---|---|---|
| Quadrant | BADHDUFLAG | Total packets | Discarded packets |
| A | 0 | 3 | 0 |
| B | 0 | 3 | 0 |
| C | 0 | 3 | 0 |
| D | 0 | 3 | 0 |
| Mode M0 | |||
|---|---|---|---|
| Quadrant | BADHDUFLAG | Total packets | Discarded packets |
| A | 0 | 37902 | 2 |
| B | 0 | 42129 | 2 |
| C | 0 | 35001 | 2 |
| D | 0 | 41511 | 2 |
| Mode SS | |||
|---|---|---|---|
| Quadrant | BADHDUFLAG | Total packets | Discarded packets |
| A | 0 | 336 | 0 |
| B | 0 | 336 | 0 |
| C | 0 | 336 | 0 |
| D | 0 | 336 | 0 |
| Quadrant | Total seconds | Saturated seconds | Saturation percentage |
|---|---|---|---|
| A | 16623 | 716 | 4.307285% |
| B | 16623 | 972 | 5.847320% |
| C | 16623 | 279 | 1.678397% |
| D | 16623 | 295 | 1.774650% |
Noise dominated data is calculated using 1-second bins in cleaned event files. If a bin has >2000 counts, and if more than 50% of those come from <1% of pixels, then it is considered to be noise-dominated and hence unusable.
| Quadrant | # 1 sec bins | Bins with >0 counts | Bins with >2000 counts | High rate bins dominated by noise | Noise dominated (total time) | Noise dominated (detector-on time) | Marked lightcurve |
|---|---|---|---|---|---|---|---|
| A | 17029 | 16625 | 281 | 281 | 1.65% | 1.69% | 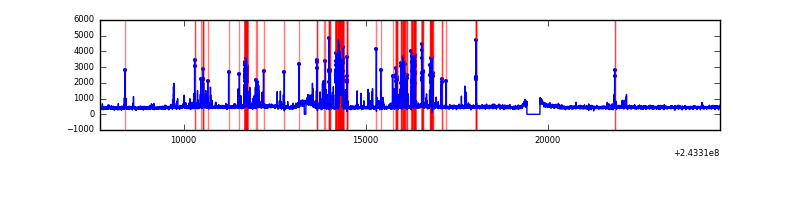 |
| B | 17029 | 16626 | 418 | 418 | 2.45% | 2.51% | 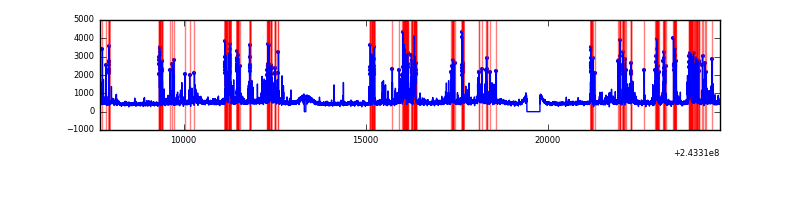 |
| C | 17029 | 16626 | 68 | 68 | 0.40% | 0.41% | 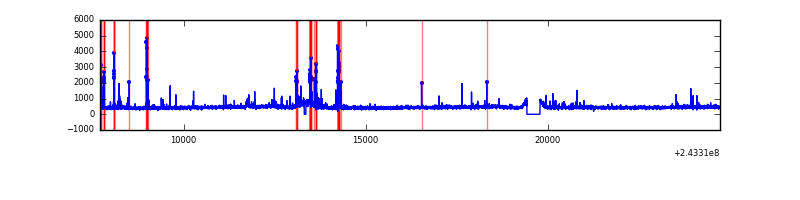 |
| D | 17029 | 16626 | 62 | 62 | 0.36% | 0.37% | 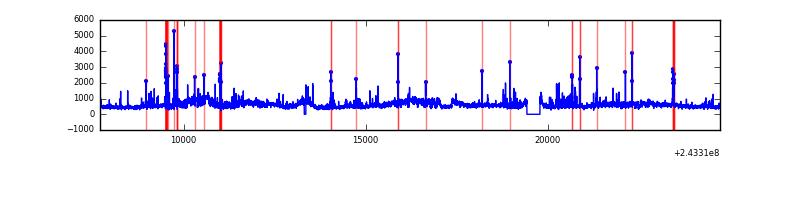 |
Top three noisy pixels from each quadrant. If the there are fewer than three noisy pixels in the level2.evt file, extra rows are filled as -1
| Pixel properties | Quadrant properties | ||||||
|---|---|---|---|---|---|---|---|
| Quadrant | DetID | PixID | Counts | Sigma | Mean | Median | Sigma |
| A | 15 | 223 | 744612 | 1913.32 | 1890 | 1843 | 388.2 |
| A | 15 | 174 | 357655 | 916.55 | 1890 | 1843 | 388.2 |
| A | 15 | 239 | 319079 | 817.18 | 1890 | 1843 | 388.2 |
| B | 4 | 239 | 2395027 | 6634.69 | 1894 | 1843 | 360.7 |
| B | 15 | 204 | 391270 | 1079.62 | 1894 | 1843 | 360.7 |
| B | 0 | 214 | 93510 | 254.13 | 1894 | 1843 | 360.7 |
| C | 4 | 254 | 439254 | 1015.59 | 1863 | 1872 | 430.7 |
| C | 14 | 234 | 58606 | 131.74 | 1863 | 1872 | 430.7 |
| C | 4 | 175 | 15528 | 31.71 | 1863 | 1872 | 430.7 |
| D | 1 | 20 | 2239274 | 5000.97 | 1851 | 1796 | 447.4 |
| D | 8 | 195 | 257192 | 570.83 | 1851 | 1796 | 447.4 |
| D | 13 | 249 | 228011 | 505.61 | 1851 | 1796 | 447.4 |
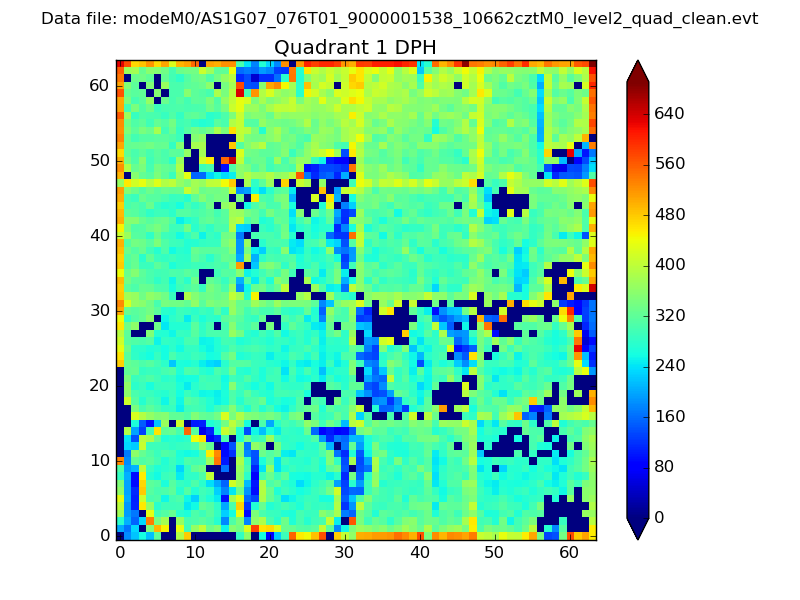
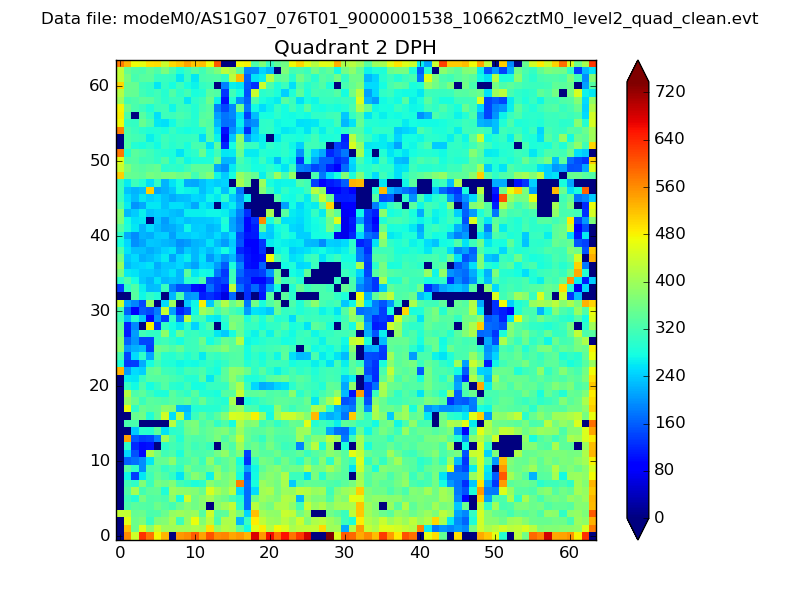
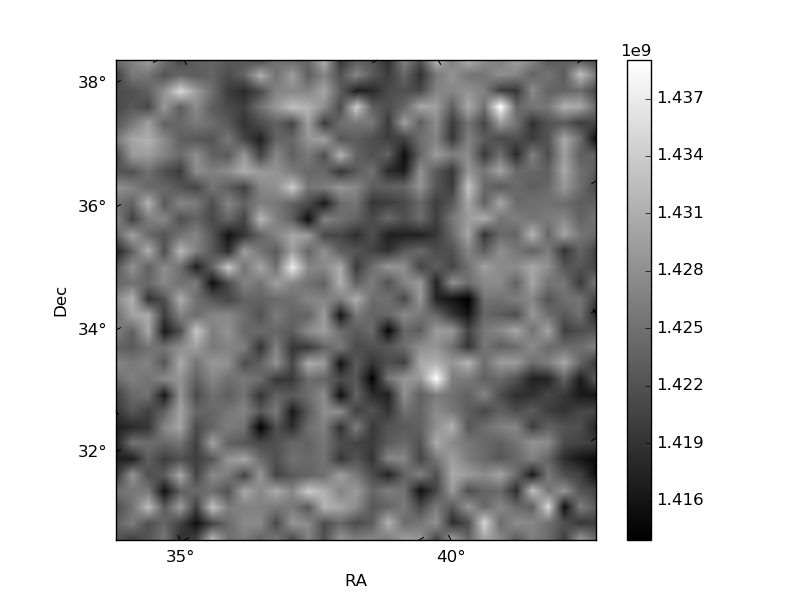
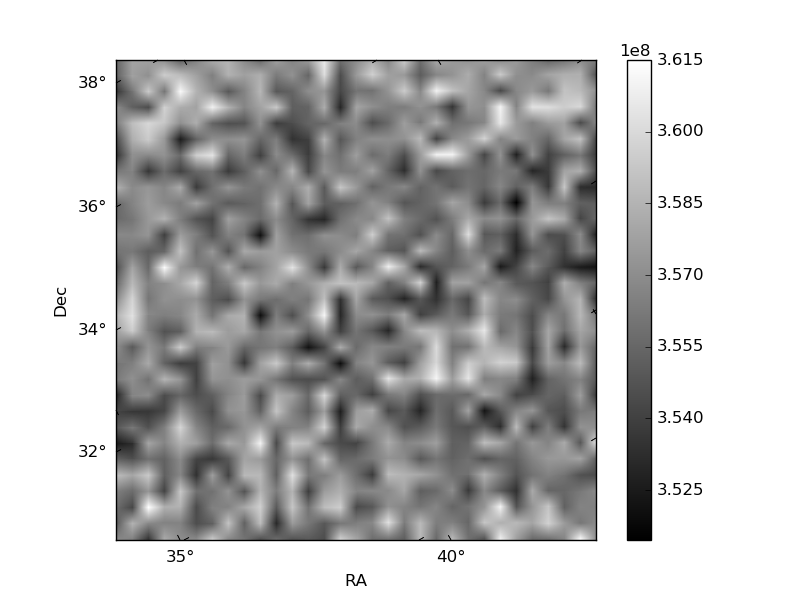
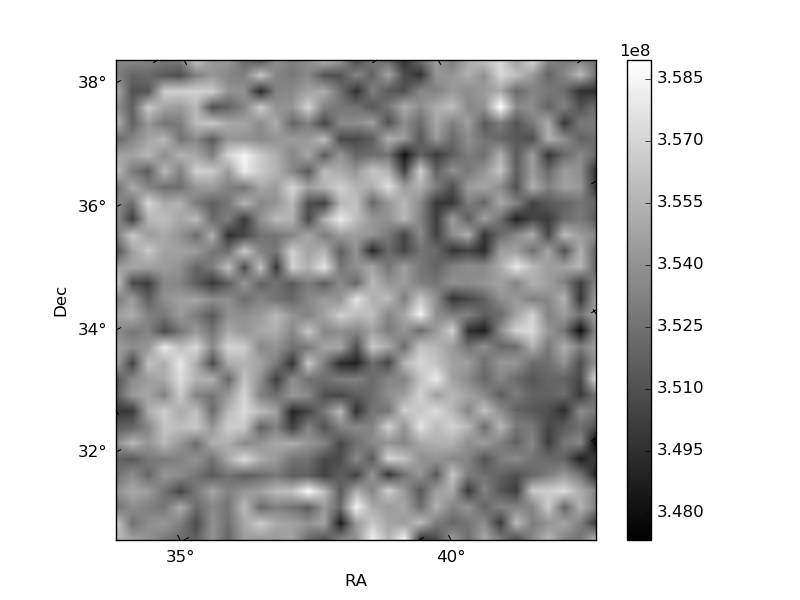
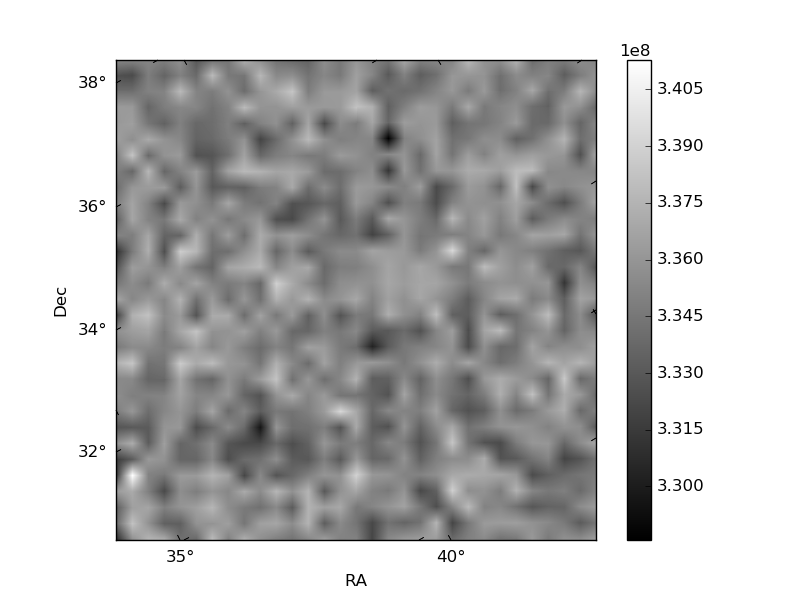
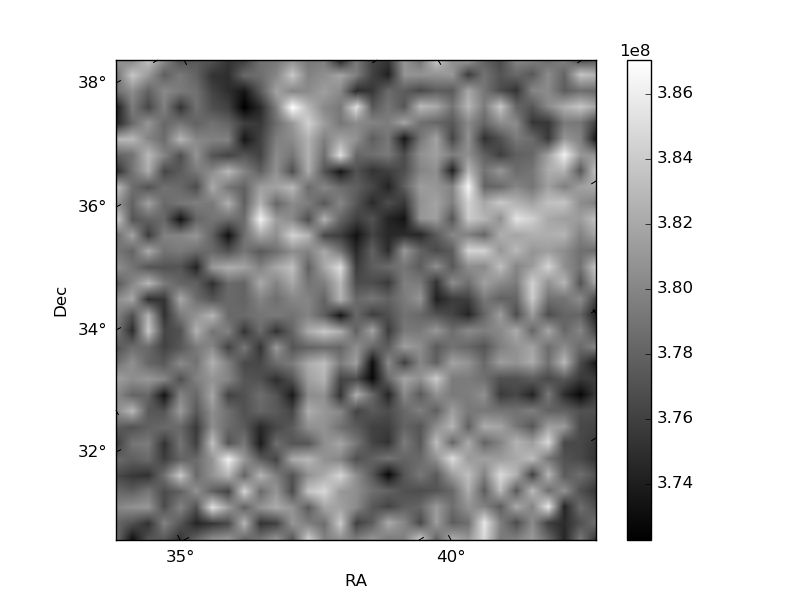
Histogram calculated using DETX and DETY for each event in the final _common_clean file
| Quadrant A |  |
 |
Quadrant B |
|---|---|---|---|
| Quadrant D | 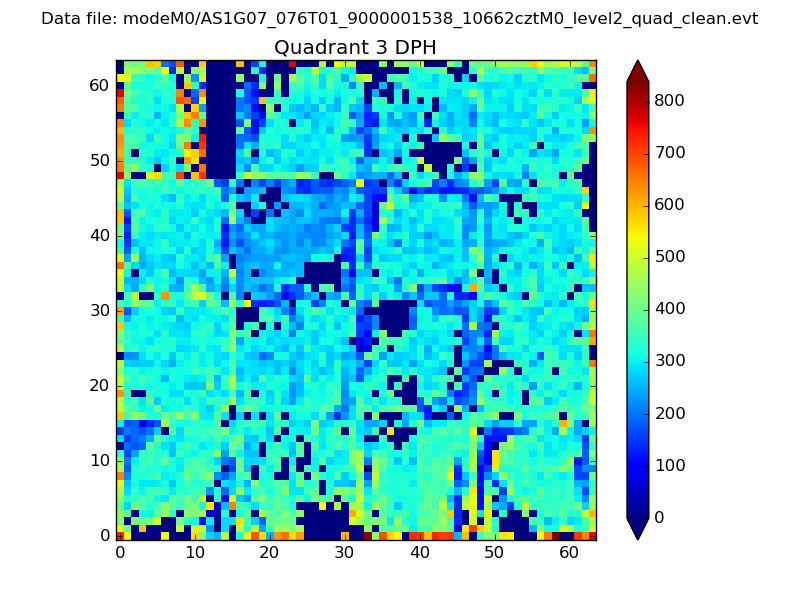 |
 |
Quadrant C |
| Plot type | Count rate plots | Images |
|---|---|---|
| Comparison with Poisson distribution Blue bars denote a histogram of data divided into 1 sec bins. Red curve is a Poisson curve with rate = median count rate of data. |
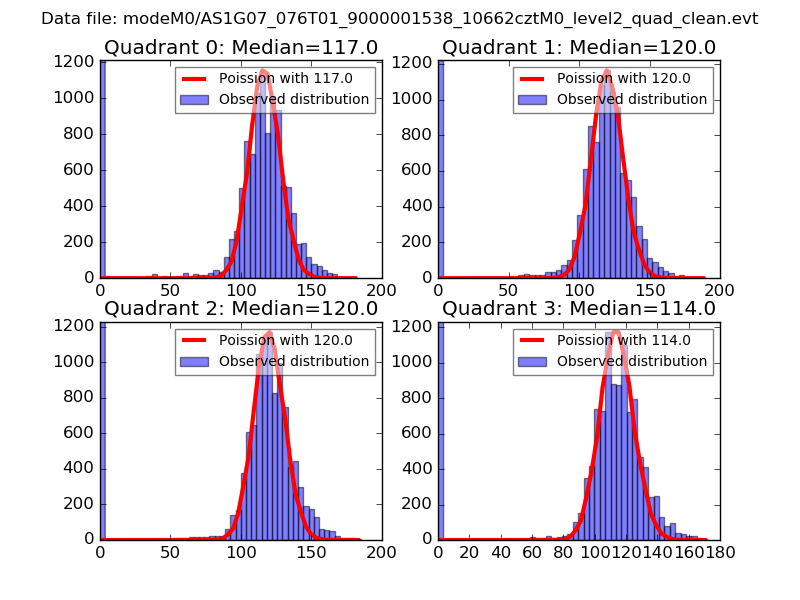 |
 |
| Quadrant-wise count rates Data is divided into 100 sec bins |
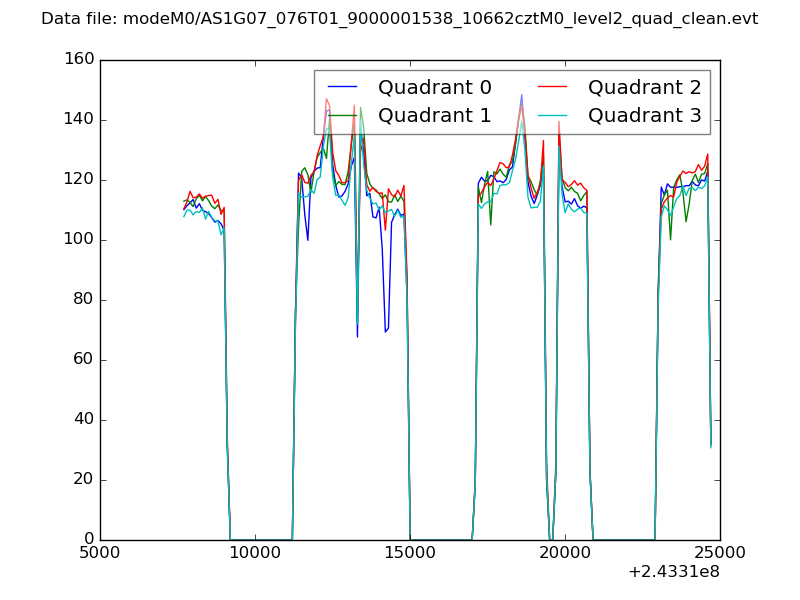 |
|
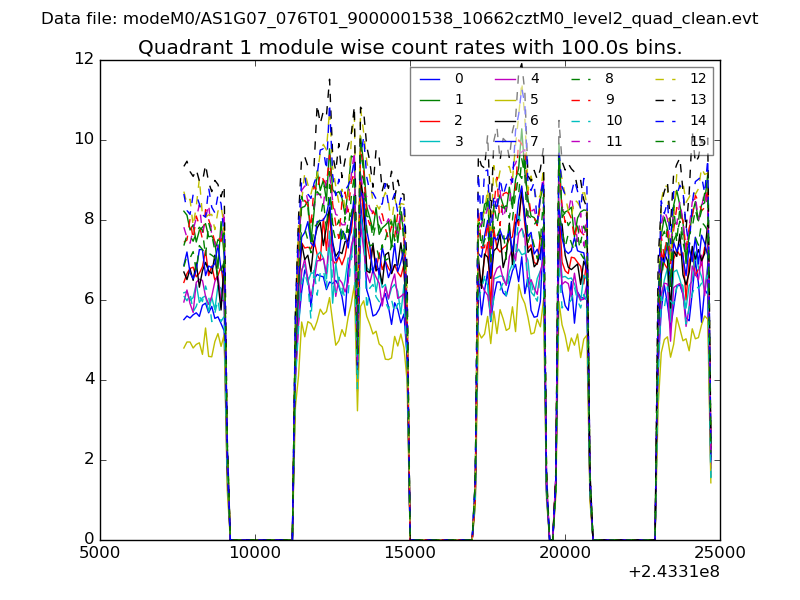
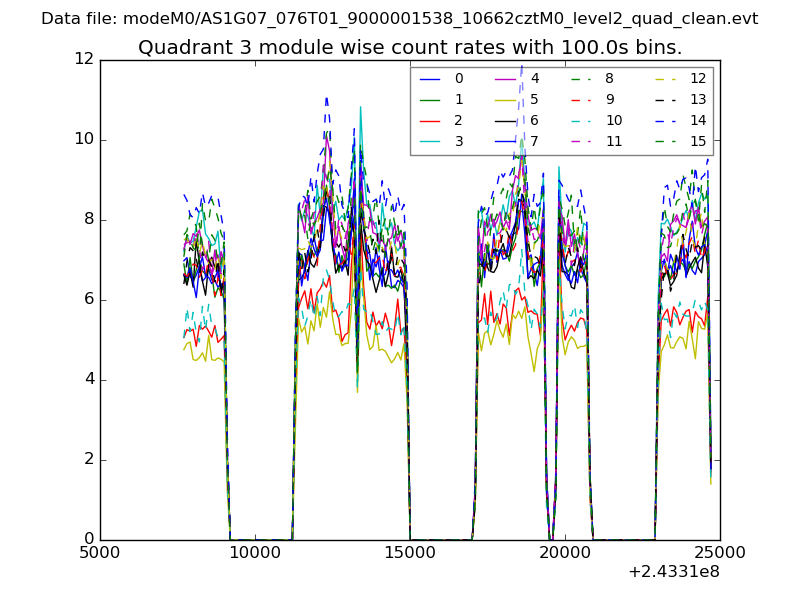
| Module-wise count rates for Quadrant A Data is divided into 100 sec bins |
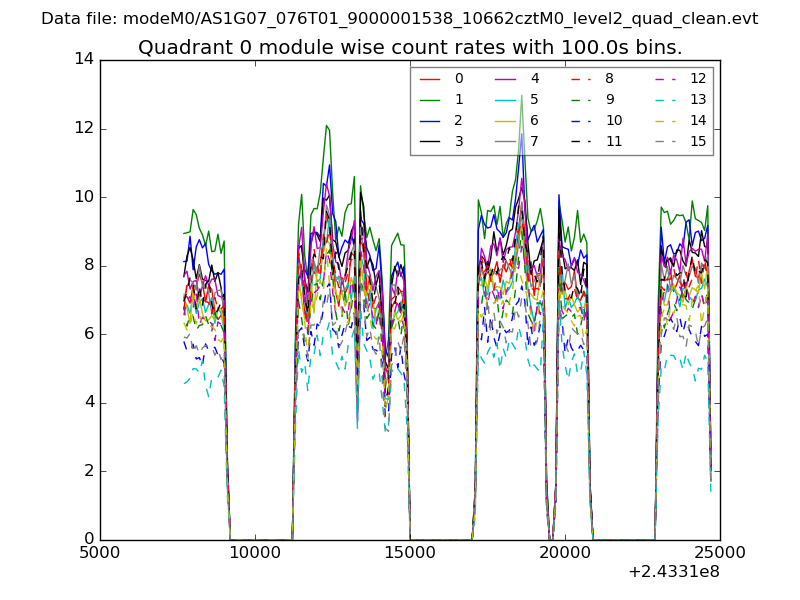 |
 |
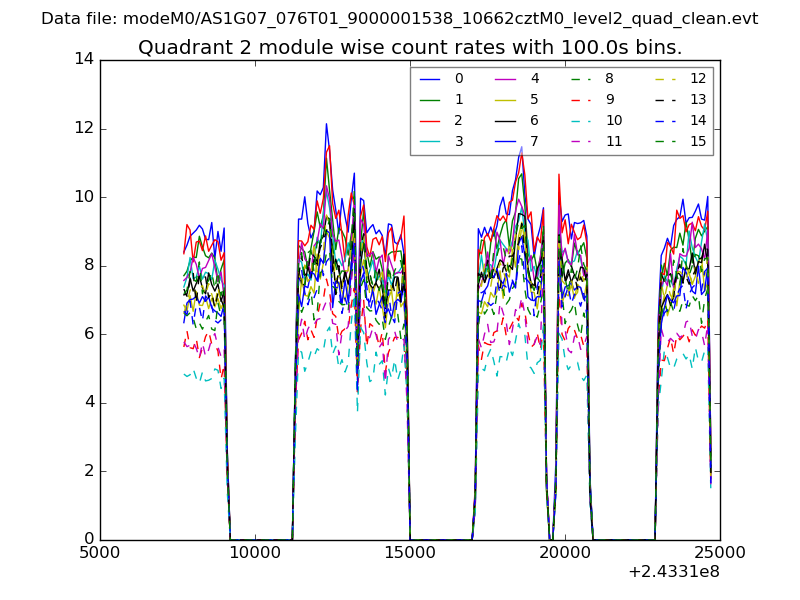
| Module-wise count rates for Quadrant B Data is divided into 100 sec bins |
 |
 |
| Module-wise count rates for Quadrant C Data is divided into 100 sec bins |
 |
 |
| Module-wise count rates for Quadrant D Data is divided into 100 sec bins |
 |
 |
| Parameter | Plot |
|---|---|
| CZT HV Monitor |  |
| D_VDD | 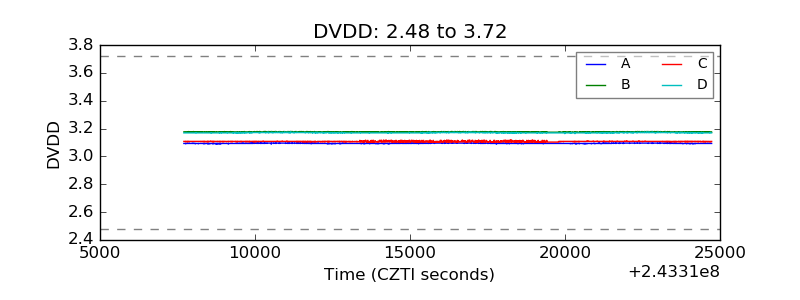 |
| Temperature 1 | 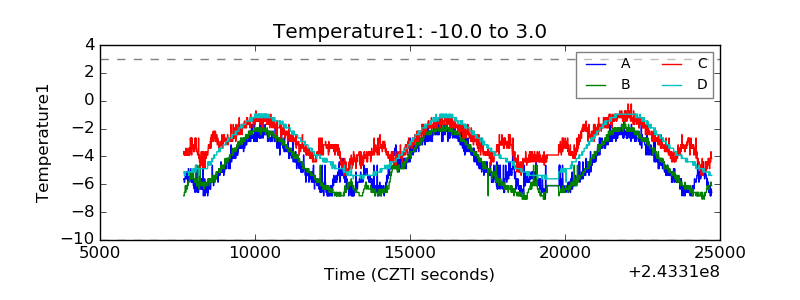 |
| Veto HV Monitor | 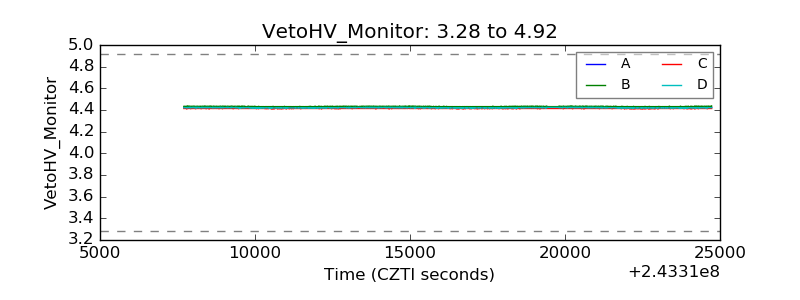 |
| Veto LLD | 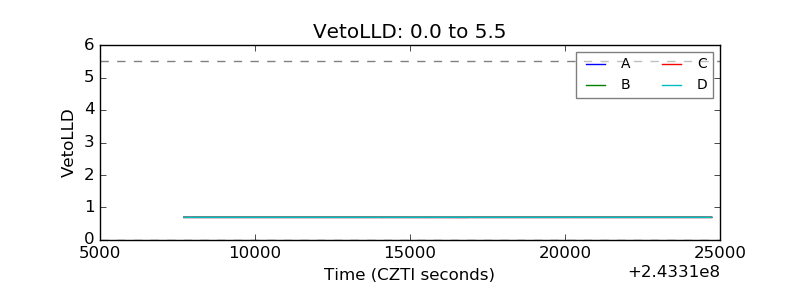 |
| Alpha Counter |  |
| _CPM_Rate |  |
| CZT Counter | 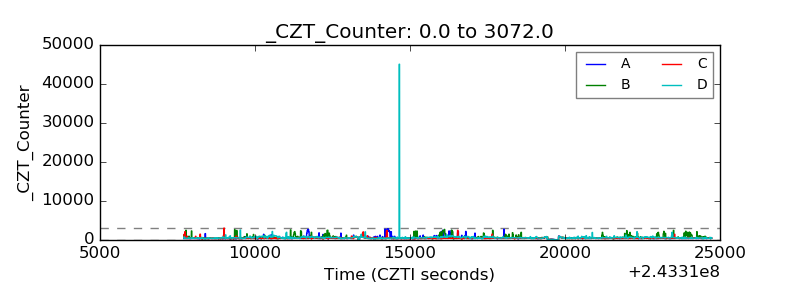 |
| +2.5 Volts monitor |  |
| +5 Volts monitor |  |
| _ROLL_ROT |  |
| _Roll_DEC | 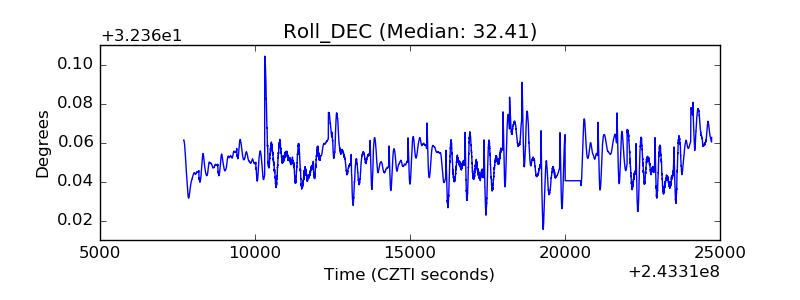 |
| _Roll_RA | 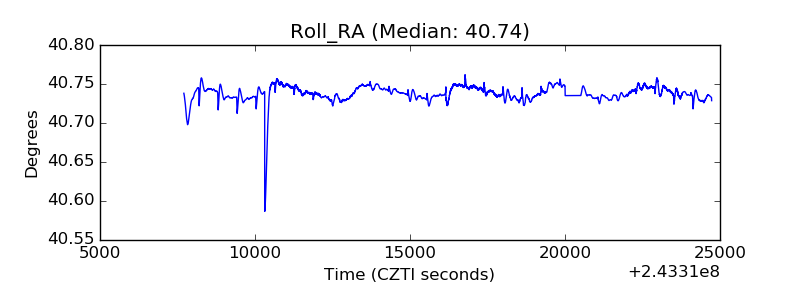 |
| Veto Counter | 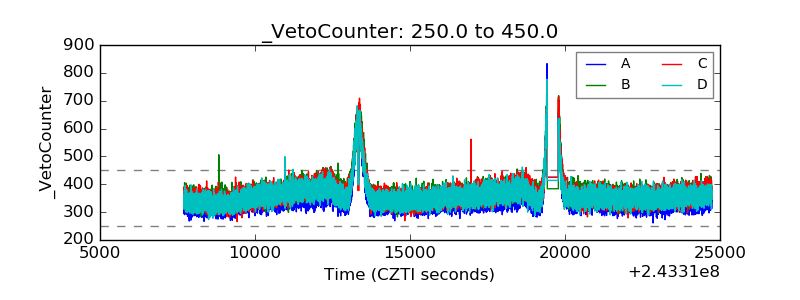 |