| Param | Original file | Final file |
|---|---|---|
| Filename | modeM0/AS1A03_053T01_9000001542cztM0_level2.fits | modeM0/AS1A03_053T01_9000001542cztM0_level2_quad_clean.evt |
| Size (bytes) | 914,028,480 | 847,422,720 |
| Size | 871.7 MB | 808.2 MB |
| Events in quadrant A | 5,546,668 | 5,067,293 |
| Events in quadrant B | 5,221,414 | 4,793,543 |
| Events in quadrant C | 5,439,934 | 4,785,827 |
| Events in quadrant D | 4,626,952 | 4,175,458 |
| Mode M0 | |||
|---|---|---|---|
| Quadrant | BADHDUFLAG | Total packets | Discarded packets |
| A | 0 | 212092 | 0 |
| B | 0 | 271014 | 0 |
| C | 0 | 215813 | 0 |
| D | 0 | 276248 | 0 |
| Mode M9 | |||
|---|---|---|---|
| Quadrant | BADHDUFLAG | Total packets | Discarded packets |
| A | 0 | 127 | 0 |
| B | 0 | 127 | 0 |
| C | 0 | 127 | 0 |
| D | 0 | 127 | 0 |
| Mode SS | |||
|---|---|---|---|
| Quadrant | BADHDUFLAG | Total packets | Discarded packets |
| A | 0 | 2038 | 0 |
| B | 0 | 2038 | 0 |
| C | 0 | 2038 | 0 |
| D | 0 | 2038 | 0 |
| Quadrant | Total seconds | Saturated seconds | Saturation percentage |
|---|---|---|---|
| A | 99789 | 1763 | 1.766728% |
| B | 99780 | 6657 | 6.671678% |
| C | 99788 | 2065 | 2.069387% |
| D | 99777 | 4517 | 4.527095% |
Noise dominated data is calculated using 1-second bins in cleaned event files. If a bin has >2000 counts, and if more than 50% of those come from <1% of pixels, then it is considered to be noise-dominated and hence unusable.
| Quadrant | # 1 sec bins | Bins with >0 counts | Bins with >2000 counts | High rate bins dominated by noise | Noise dominated (total time) | Noise dominated (detector-on time) | Marked lightcurve |
|---|---|---|---|---|---|---|---|
| A | 117856 | 99806 | 0 | 0 | 0.00% | 0.00% |  |
| B | 117856 | 99796 | 0 | 0 | 0.00% | 0.00% |  |
| C | 117856 | 99797 | 0 | 0 | 0.00% | 0.00% |  |
| D | 117856 | 99794 | 0 | 0 | 0.00% | 0.00% |  |
Top three noisy pixels from each quadrant. If the there are fewer than three noisy pixels in the level2.evt file, extra rows are filled as -1
| Pixel properties | Quadrant properties | ||||||
|---|---|---|---|---|---|---|---|
| Quadrant | DetID | PixID | Counts | Sigma | Mean | Median | Sigma |
| A | 0 | 29 | 5333 | 10.91 | 1443 | 1346 | 365.5 |
| A | 7 | 110 | 4664 | 9.08 | 1443 | 1346 | 365.5 |
| A | 0 | 30 | 4116 | 7.58 | 1443 | 1346 | 365.5 |
| B | 2 | 9 | 4661 | 12.18 | 1378 | 1308 | 275.4 |
| B | 12 | 226 | 3498 | 7.95 | 1378 | 1308 | 275.4 |
| B | 3 | 17 | 3477 | 7.88 | 1378 | 1308 | 275.4 |
| C | 12 | 241 | 3897 | 6.87 | 1436 | 1324 | 374.8 |
| C | 7 | 111 | 3648 | 6.2 | 1436 | 1324 | 374.8 |
| C | 2 | 191 | 3594 | 6.06 | 1436 | 1324 | 374.8 |
| D | 3 | 14 | 3449 | 6.31 | 1319 | 1194 | 357.1 |
| D | 6 | 231 | 3382 | 6.13 | 1319 | 1194 | 357.1 |
| D | 7 | 5 | 3331 | 5.98 | 1319 | 1194 | 357.1 |
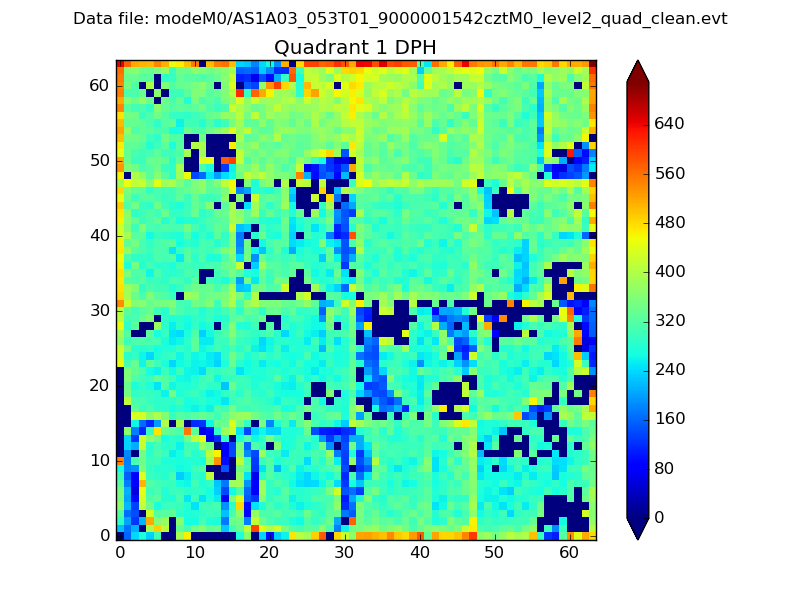
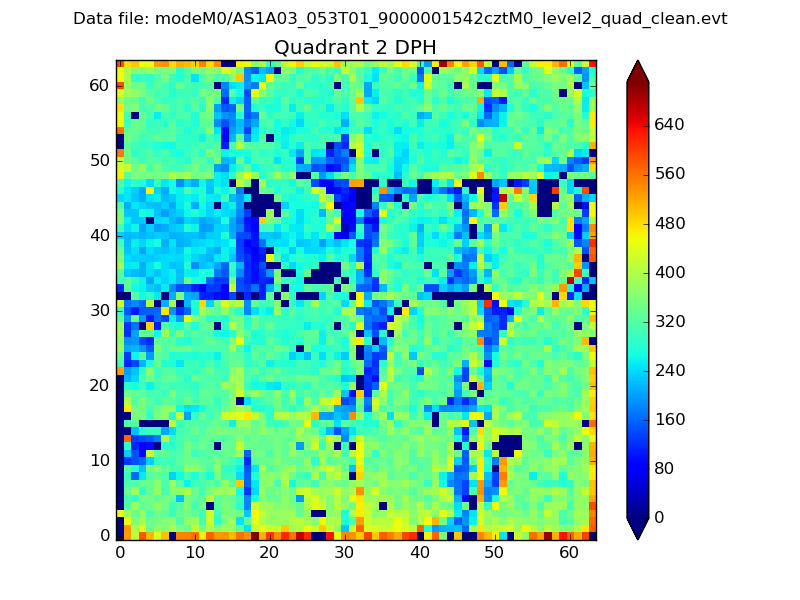
Histogram calculated using DETX and DETY for each event in the final _common_clean file
| Quadrant A |  |
 |
Quadrant B |
|---|---|---|---|
| Quadrant D | 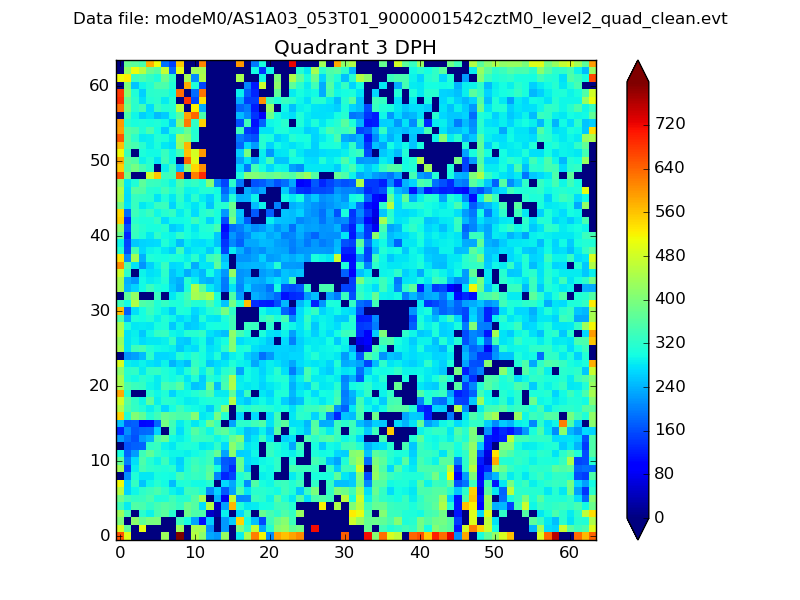 |
 |
Quadrant C |
| Plot type | Count rate plots | Images |
|---|---|---|
| Comparison with Poisson distribution Blue bars denote a histogram of data divided into 1 sec bins. Red curve is a Poisson curve with rate = median count rate of data. |
 |
 |
| Quadrant-wise count rates Data is divided into 100 sec bins |
 |
|
| Module-wise count rates for Quadrant A Data is divided into 100 sec bins |
 |
 |
| Module-wise count rates for Quadrant B Data is divided into 100 sec bins |
 |
 |
| Module-wise count rates for Quadrant C Data is divided into 100 sec bins |
 |
 |
| Module-wise count rates for Quadrant D Data is divided into 100 sec bins |
 |
 |
| Parameter | Plot |
|---|---|
| CZT HV Monitor |  |
| D_VDD |  |
| Temperature 1 |  |
| Veto HV Monitor |  |
| Veto LLD |  |
| Alpha Counter |  |
| _CPM_Rate |  |
| CZT Counter |  |
| +2.5 Volts monitor |  |
| +5 Volts monitor |  |
| _ROLL_ROT |  |
| _Roll_DEC |  |
| _Roll_RA |  |
| Veto Counter |  |