| Param | Original file | Final file |
|---|---|---|
| Filename | modeM0/AS1A03_053T01_9000001542_10699cztM0_level2.evt | modeM0/AS1A03_053T01_9000001542_10699cztM0_level2_quad_clean.evt |
| Size (bytes) | 159,566,400 | 18,720,000 |
| Size | 152.2 MB | 17.9 MB |
| Events in quadrant A | 985,319 | 111,655 |
| Events in quadrant B | 1,304,211 | 108,577 |
| Events in quadrant C | 847,456 | 112,185 |
| Events in quadrant D | 1,571,408 | 102,632 |
| Mode M0 | |||
|---|---|---|---|
| Quadrant | BADHDUFLAG | Total packets | Discarded packets |
| A | 0 | 4111 | 2 |
| B | 0 | 5067 | 1 |
| C | 0 | 3804 | 1 |
| D | 0 | 5911 | 1 |
| Mode M9 | |||
|---|---|---|---|
| Quadrant | BADHDUFLAG | Total packets | Discarded packets |
| A | 0 | 7 | 0 |
| B | 0 | 7 | 0 |
| C | 0 | 7 | 0 |
| D | 0 | 7 | 0 |
| Mode SS | |||
|---|---|---|---|
| Quadrant | BADHDUFLAG | Total packets | Discarded packets |
| A | 0 | 38 | 0 |
| B | 0 | 38 | 0 |
| C | 0 | 38 | 0 |
| D | 0 | 38 | 0 |
| Quadrant | Total seconds | Saturated seconds | Saturation percentage |
|---|---|---|---|
| A | 1790 | 46 | 2.569832% |
| B | 1790 | 143 | 7.988827% |
| C | 1790 | 14 | 0.782123% |
| D | 1790 | 66 | 3.687151% |
Noise dominated data is calculated using 1-second bins in cleaned event files. If a bin has >2000 counts, and if more than 50% of those come from <1% of pixels, then it is considered to be noise-dominated and hence unusable.
| Quadrant | # 1 sec bins | Bins with >0 counts | Bins with >2000 counts | High rate bins dominated by noise | Noise dominated (total time) | Noise dominated (detector-on time) | Marked lightcurve |
|---|---|---|---|---|---|---|---|
| A | 2515 | 1791 | 15 | 15 | 0.60% | 0.84% | 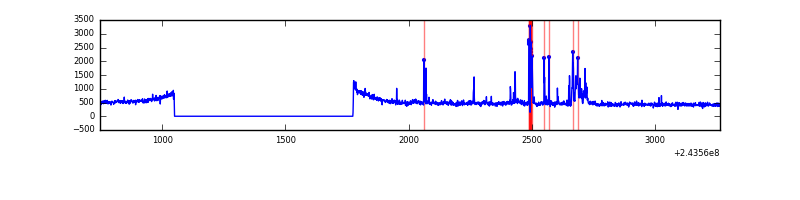 |
| B | 2515 | 1791 | 56 | 56 | 2.23% | 3.13% | 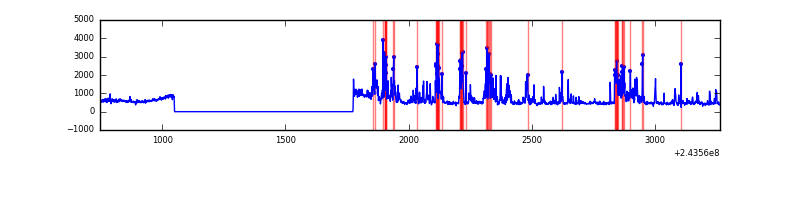 |
| C | 2515 | 1791 | 0 | 0 | 0.00% | 0.00% | 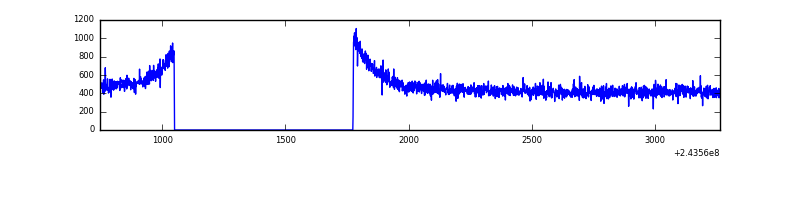 |
| D | 2515 | 1791 | 32 | 32 | 1.27% | 1.79% | 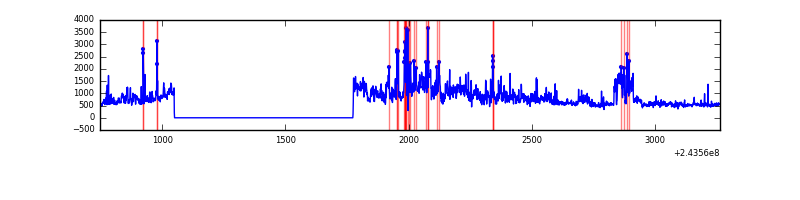 |
Top three noisy pixels from each quadrant. If the there are fewer than three noisy pixels in the level2.evt file, extra rows are filled as -1
| Pixel properties | Quadrant properties | ||||||
|---|---|---|---|---|---|---|---|
| Quadrant | DetID | PixID | Counts | Sigma | Mean | Median | Sigma |
| A | 15 | 174 | 100220 | 2143.18 | 219 | 214 | 46.7 |
| A | 15 | 239 | 14977 | 316.38 | 219 | 214 | 46.7 |
| A | 4 | 2 | 6943 | 144.21 | 219 | 214 | 46.7 |
| B | 4 | 239 | 369653 | 8341.16 | 218 | 213 | 44.3 |
| B | 15 | 204 | 19610 | 437.94 | 218 | 213 | 44.3 |
| B | 0 | 168 | 17515 | 390.64 | 218 | 213 | 44.3 |
| C | 8 | 128 | 3835 | 69.69 | 215 | 215 | 51.9 |
| C | 8 | 112 | 1991 | 34.19 | 215 | 215 | 51.9 |
| C | 13 | 61 | 1599 | 26.65 | 215 | 215 | 51.9 |
| D | 2 | 16 | 431465 | 8083.19 | 209 | 202 | 53.4 |
| D | 10 | 199 | 158522 | 2967.4 | 209 | 202 | 53.4 |
| D | 8 | 195 | 72632 | 1357.56 | 209 | 202 | 53.4 |
Histogram calculated using DETX and DETY for each event in the final _common_clean file
| Quadrant A | 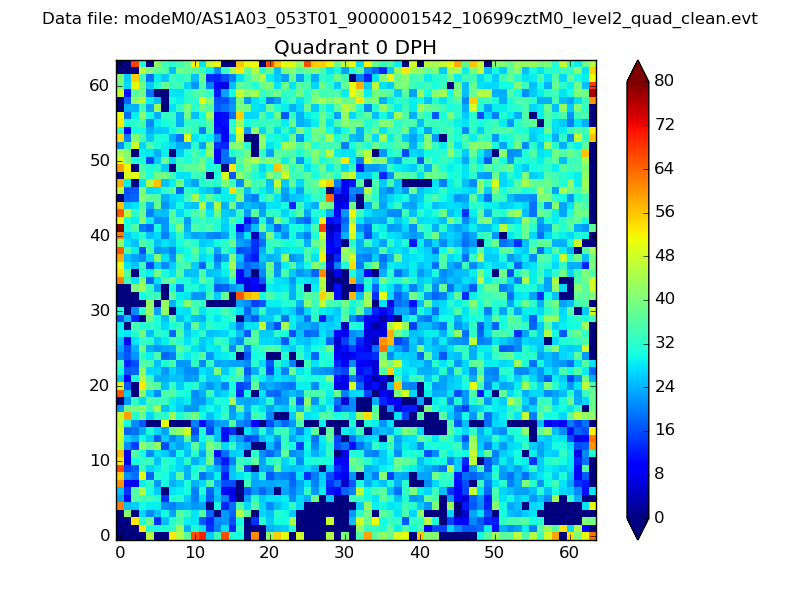 |
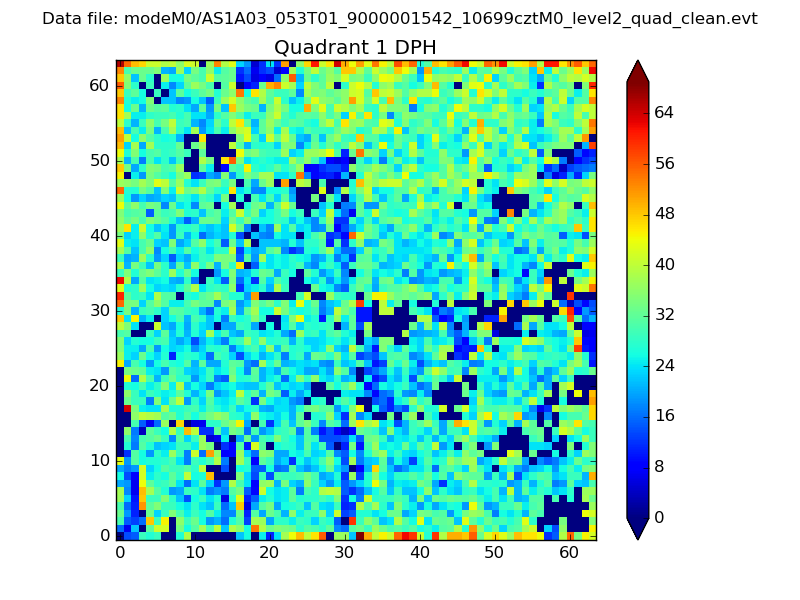 |
Quadrant B |
|---|---|---|---|
| Quadrant D |  |
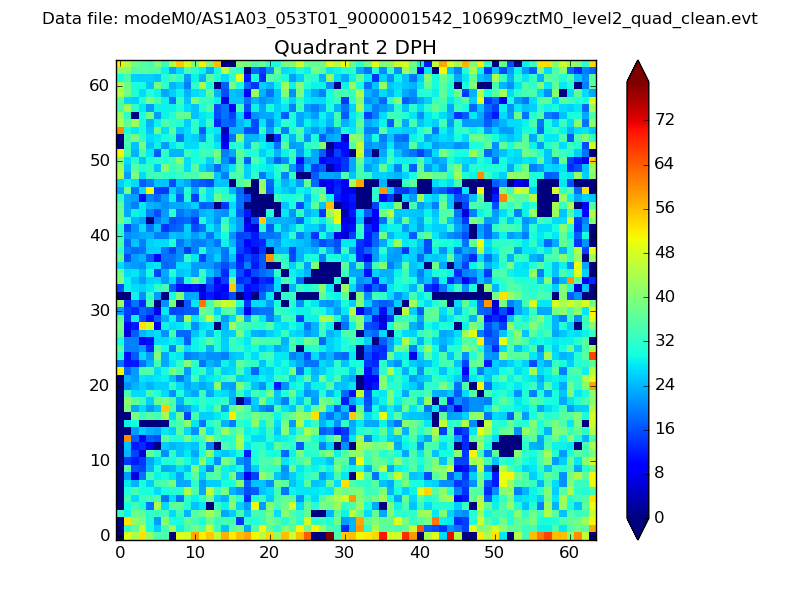 |
Quadrant C |
| Plot type | Count rate plots | Images |
|---|---|---|
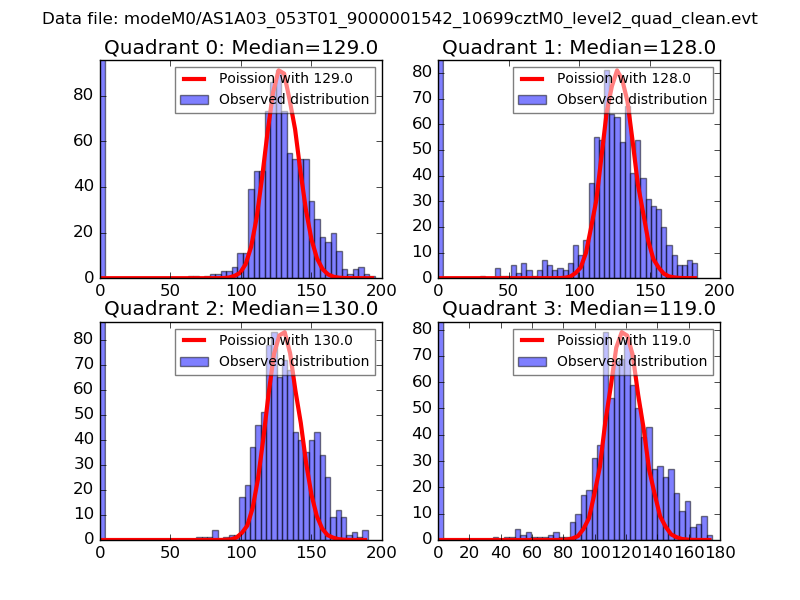
| Comparison with Poisson distribution Blue bars denote a histogram of data divided into 1 sec bins. Red curve is a Poisson curve with rate = median count rate of data. |
 |
 |
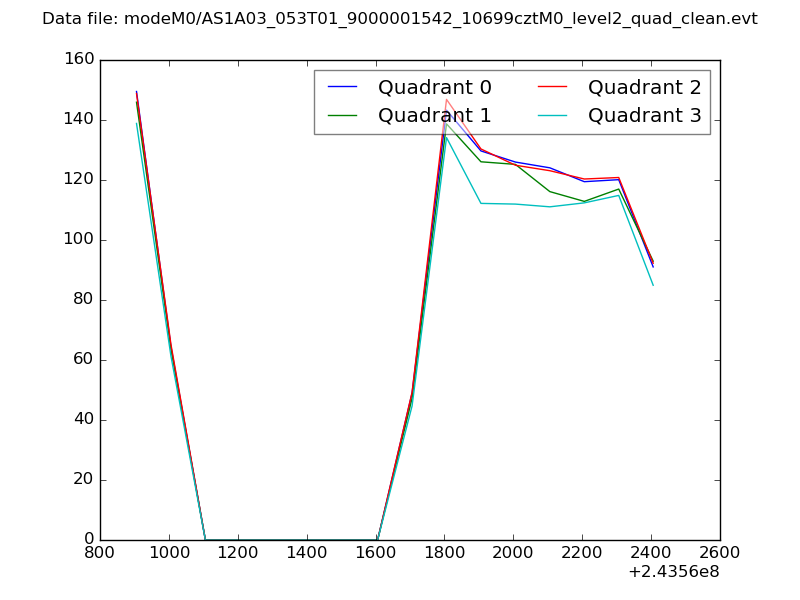
| Quadrant-wise count rates Data is divided into 100 sec bins |
 |
|
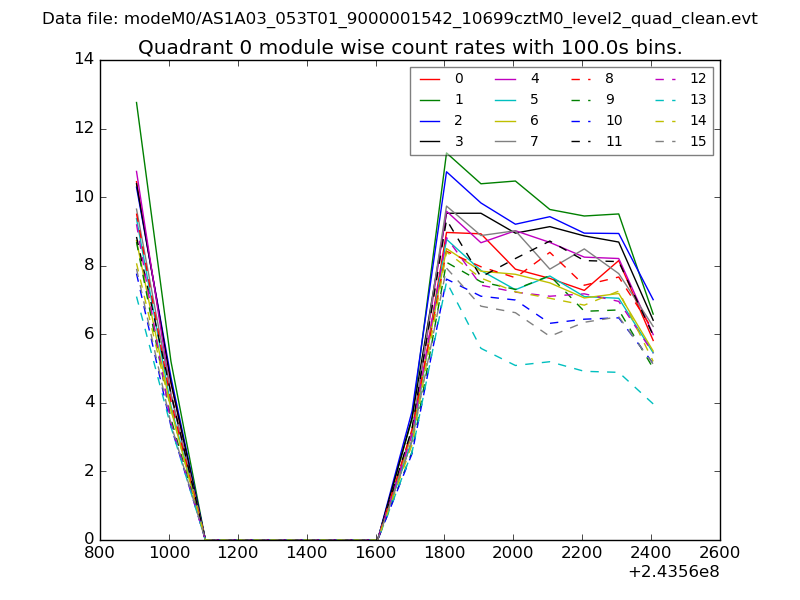
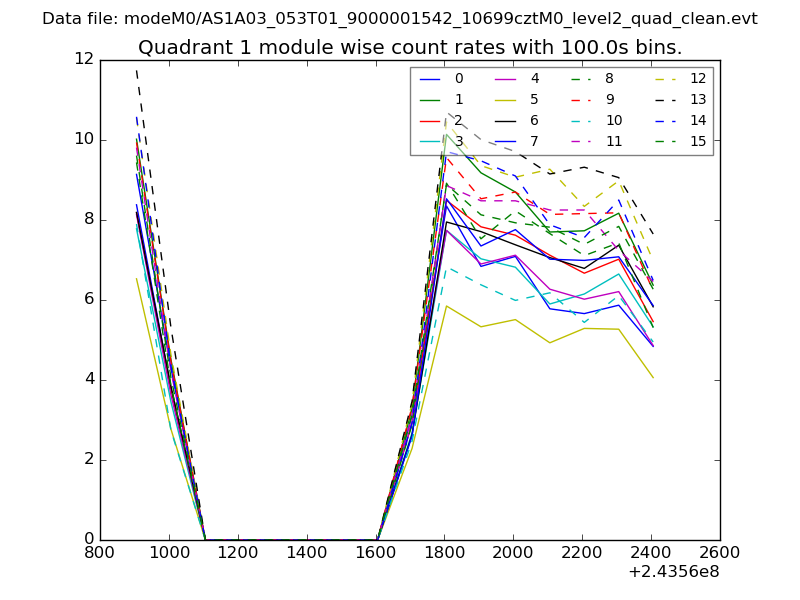
| Module-wise count rates for Quadrant A Data is divided into 100 sec bins |
 |
 |
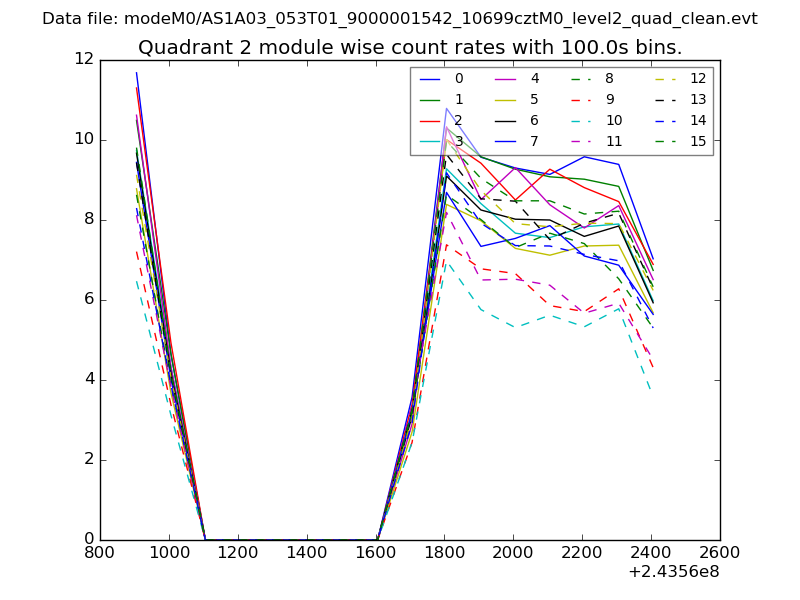
| Module-wise count rates for Quadrant B Data is divided into 100 sec bins |
 |
 |
| Module-wise count rates for Quadrant C Data is divided into 100 sec bins |
 |
 |
| Module-wise count rates for Quadrant D Data is divided into 100 sec bins |
 |
 |
| Parameter | Plot |
|---|---|
| CZT HV Monitor | 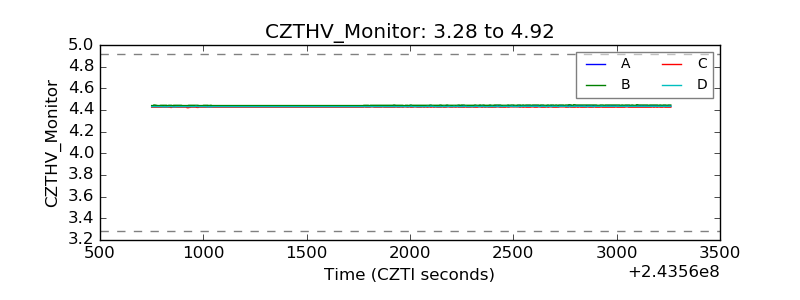 |
| D_VDD | 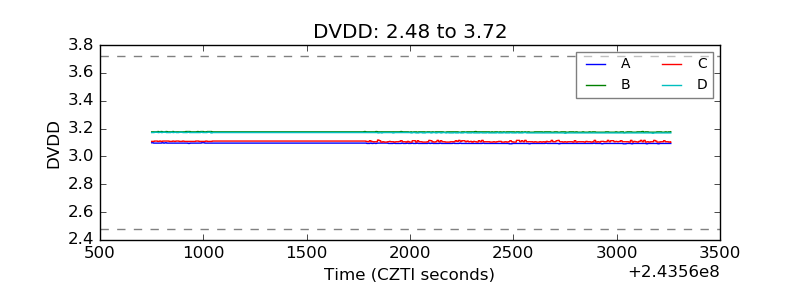 |
| Temperature 1 | 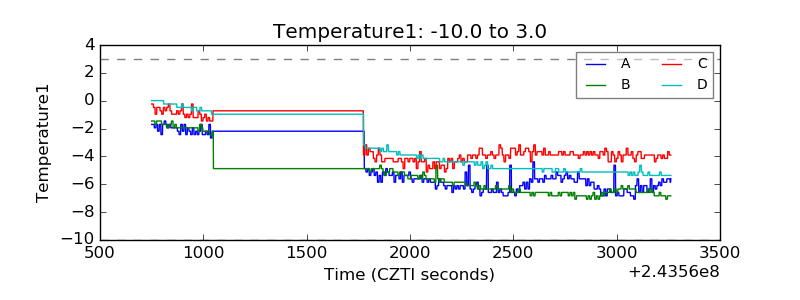 |
| Veto HV Monitor | 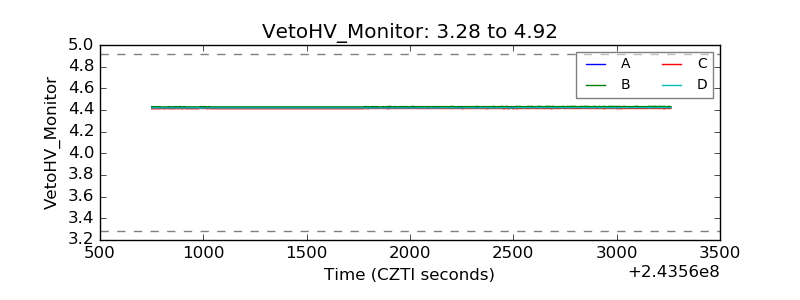 |
| Veto LLD | 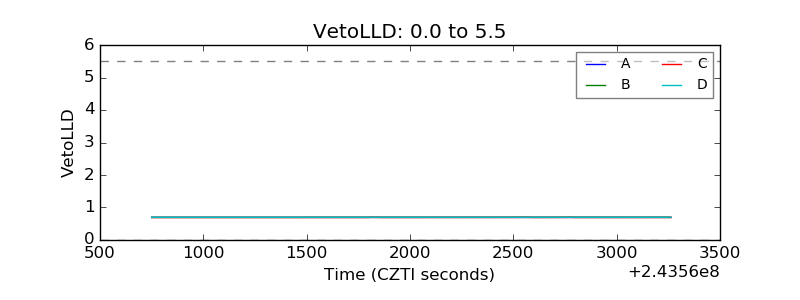 |
| Alpha Counter | 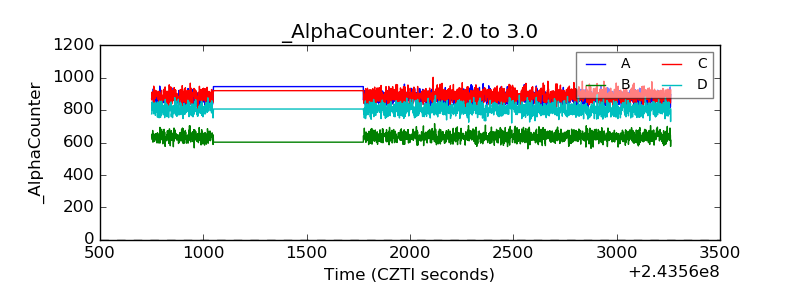 |
| _CPM_Rate | 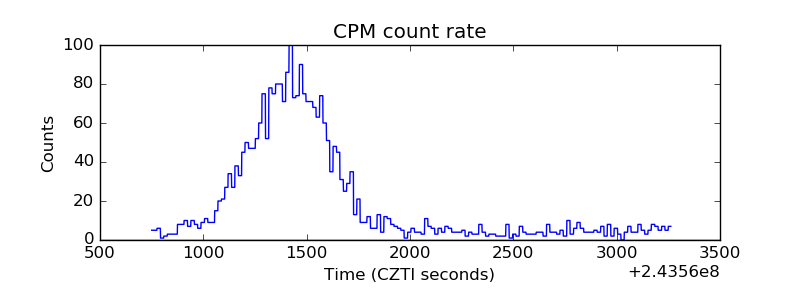 |
| CZT Counter | 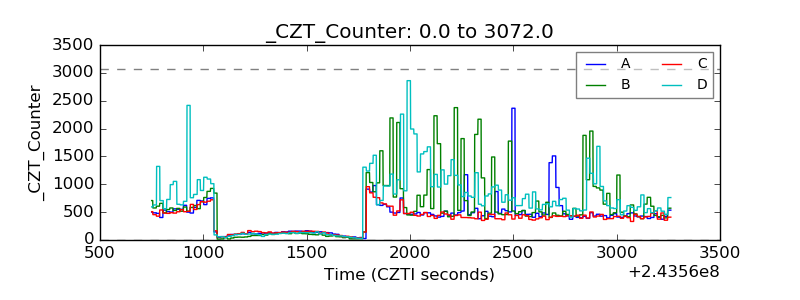 |
| +2.5 Volts monitor | 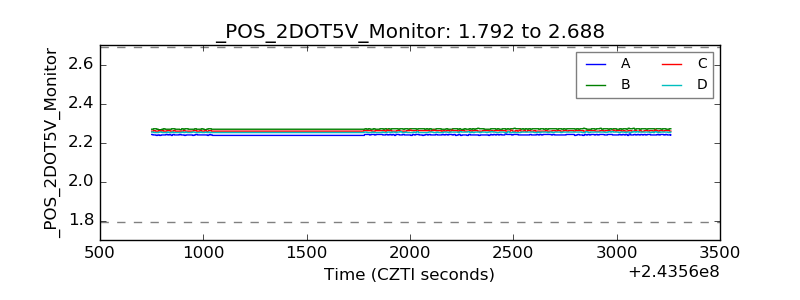 |
| +5 Volts monitor | 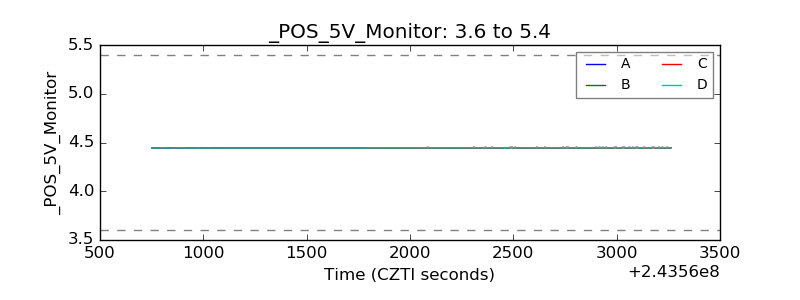 |
| _ROLL_ROT | 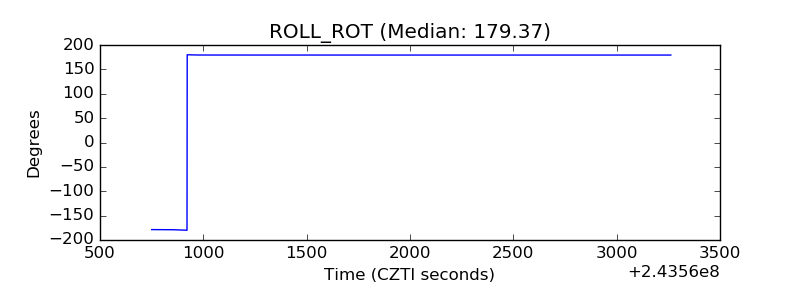 |
| _Roll_DEC | 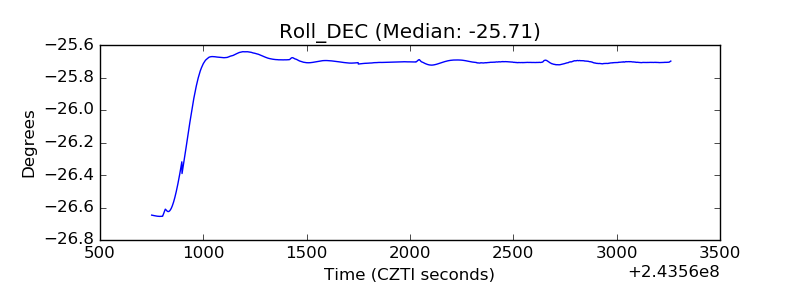 |
| _Roll_RA | 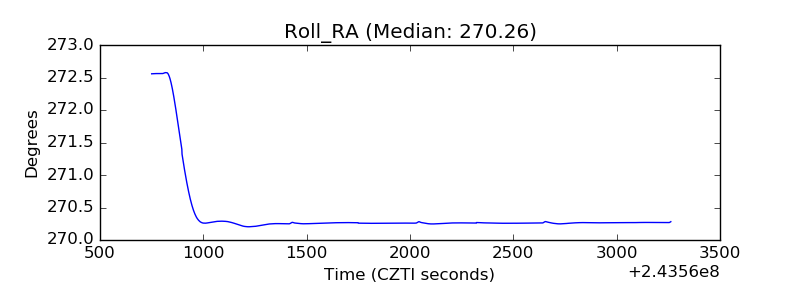 |
| Veto Counter | 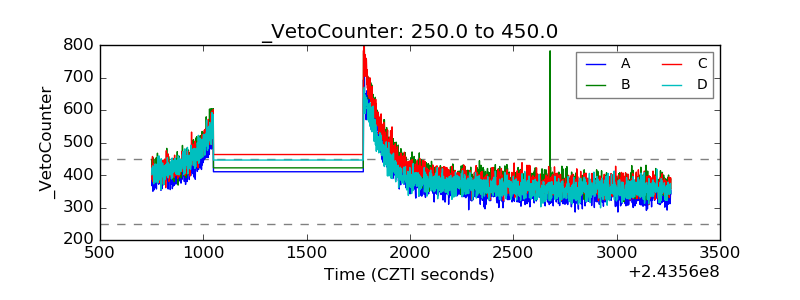 |