| Param | Original file | Final file |
|---|---|---|
| Filename | modeM0/AS1A03_053T01_9000001542_10700cztM0_level2.evt | modeM0/AS1A03_053T01_9000001542_10700cztM0_level2_quad_clean.evt |
| Size (bytes) | 652,763,520 | 87,672,960 |
| Size | 622.5 MB | 83.6 MB |
| Events in quadrant A | 3,934,510 | 540,528 |
| Events in quadrant B | 5,289,605 | 535,791 |
| Events in quadrant C | 3,627,162 | 541,192 |
| Events in quadrant D | 6,385,788 | 490,819 |
| Mode M0 | |||
|---|---|---|---|
| Quadrant | BADHDUFLAG | Total packets | Discarded packets |
| A | 0 | 16999 | 3 |
| B | 0 | 20874 | 2 |
| C | 0 | 16409 | 2 |
| D | 0 | 24225 | 2 |
| Mode M9 | |||
|---|---|---|---|
| Quadrant | BADHDUFLAG | Total packets | Discarded packets |
| A | 0 | 9 | 0 |
| B | 0 | 9 | 0 |
| C | 0 | 9 | 0 |
| D | 0 | 9 | 0 |
| Mode SS | |||
|---|---|---|---|
| Quadrant | BADHDUFLAG | Total packets | Discarded packets |
| A | 0 | 162 | 0 |
| B | 0 | 162 | 0 |
| C | 0 | 162 | 0 |
| D | 0 | 162 | 0 |
| Quadrant | Total seconds | Saturated seconds | Saturation percentage |
|---|---|---|---|
| A | 7853 | 145 | 1.846428% |
| B | 7853 | 517 | 6.583471% |
| C | 7853 | 70 | 0.891379% |
| D | 7853 | 448 | 5.704826% |
Noise dominated data is calculated using 1-second bins in cleaned event files. If a bin has >2000 counts, and if more than 50% of those come from <1% of pixels, then it is considered to be noise-dominated and hence unusable.
| Quadrant | # 1 sec bins | Bins with >0 counts | Bins with >2000 counts | High rate bins dominated by noise | Noise dominated (total time) | Noise dominated (detector-on time) | Marked lightcurve |
|---|---|---|---|---|---|---|---|
| A | 8833 | 7855 | 19 | 19 | 0.22% | 0.24% | 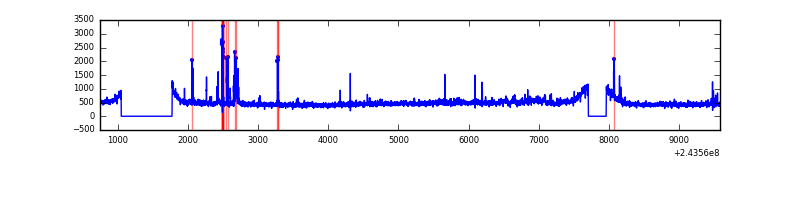 |
| B | 8833 | 7855 | 224 | 224 | 2.54% | 2.85% | 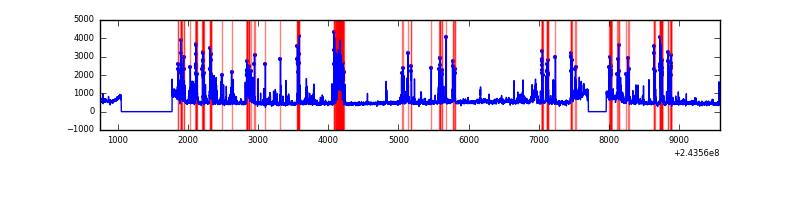 |
| C | 8833 | 7855 | 1 | 1 | 0.01% | 0.01% | 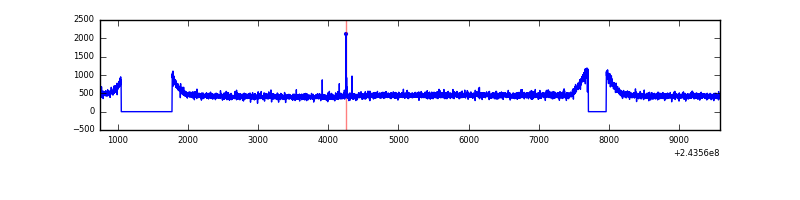 |
| D | 8833 | 7855 | 330 | 330 | 3.74% | 4.20% | 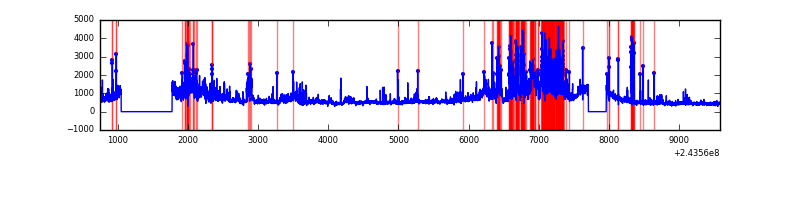 |
Top three noisy pixels from each quadrant. If the there are fewer than three noisy pixels in the level2.evt file, extra rows are filled as -1
| Pixel properties | Quadrant properties | ||||||
|---|---|---|---|---|---|---|---|
| Quadrant | DetID | PixID | Counts | Sigma | Mean | Median | Sigma |
| A | 15 | 174 | 155019 | 797.09 | 947 | 926 | 193.3 |
| A | 14 | 254 | 29151 | 146.0 | 947 | 926 | 193.3 |
| A | 4 | 2 | 27370 | 136.79 | 947 | 926 | 193.3 |
| B | 4 | 239 | 1300442 | 7126.62 | 936 | 912 | 182.3 |
| B | 0 | 168 | 102815 | 558.83 | 936 | 912 | 182.3 |
| B | 15 | 204 | 67630 | 365.88 | 936 | 912 | 182.3 |
| C | 8 | 128 | 10677 | 45.17 | 920 | 925 | 215.9 |
| C | 14 | 234 | 9551 | 39.95 | 920 | 925 | 215.9 |
| C | 13 | 61 | 6858 | 27.48 | 920 | 925 | 215.9 |
| D | 2 | 16 | 1244835 | 5674.33 | 895 | 868 | 219.2 |
| D | 10 | 199 | 914323 | 4166.71 | 895 | 868 | 219.2 |
| D | 8 | 195 | 375387 | 1708.36 | 895 | 868 | 219.2 |
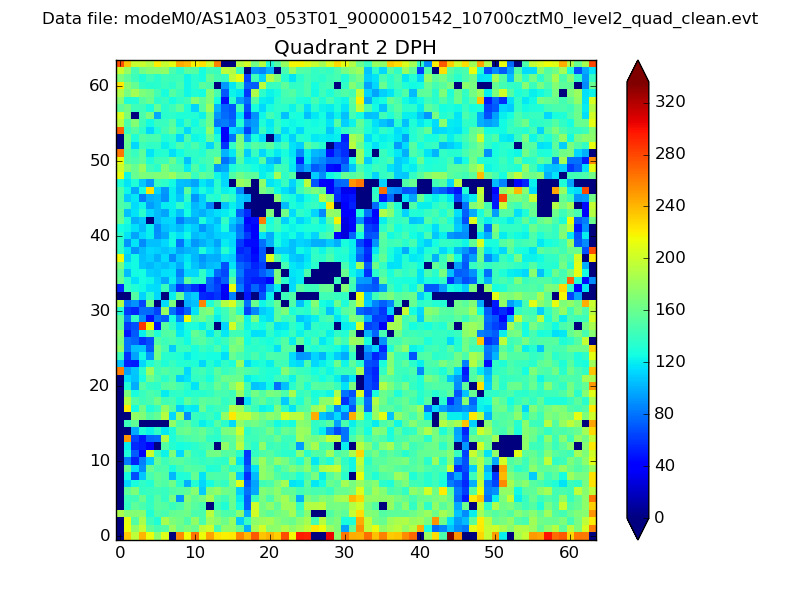
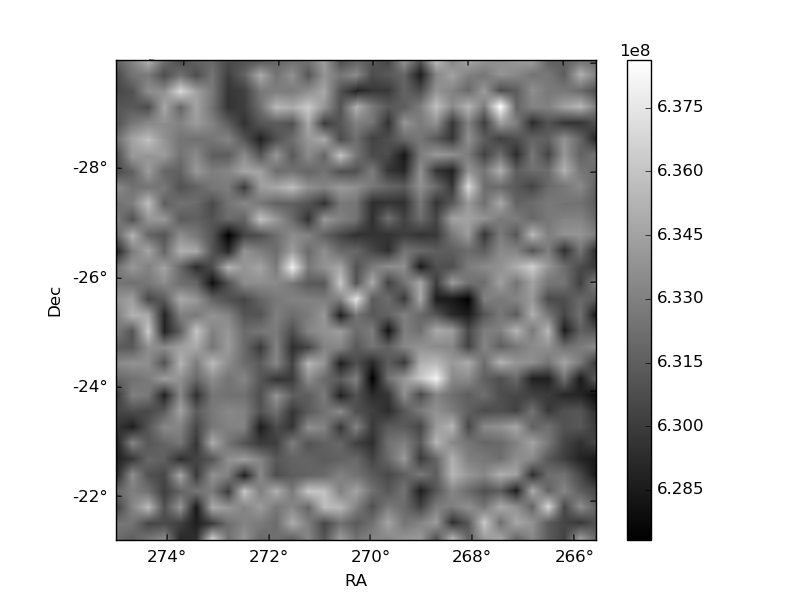
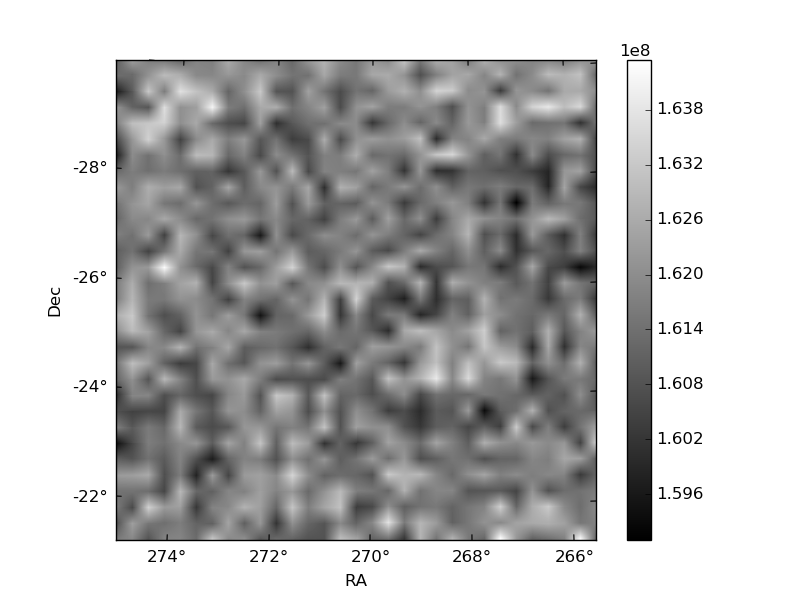
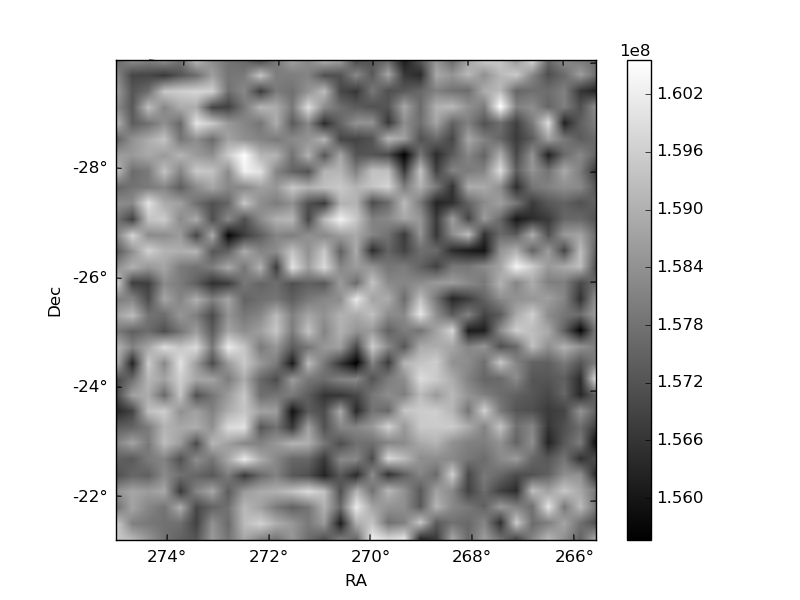
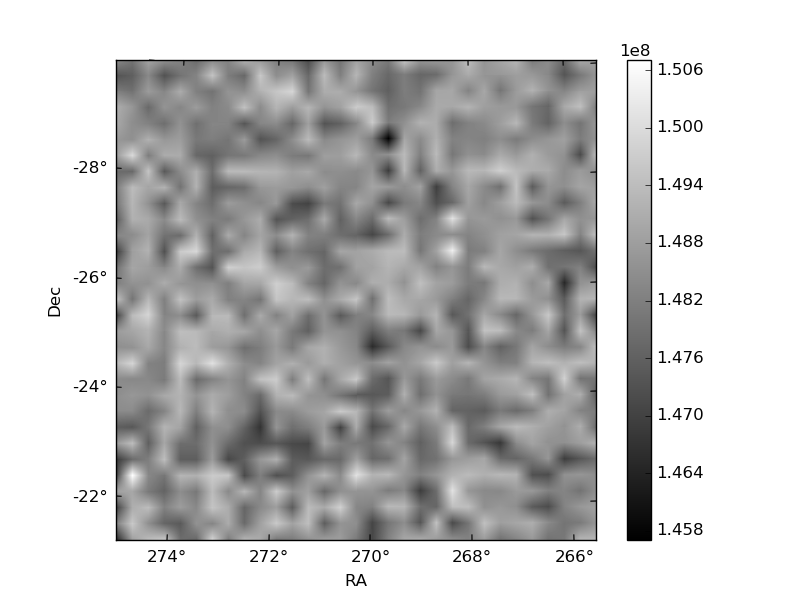
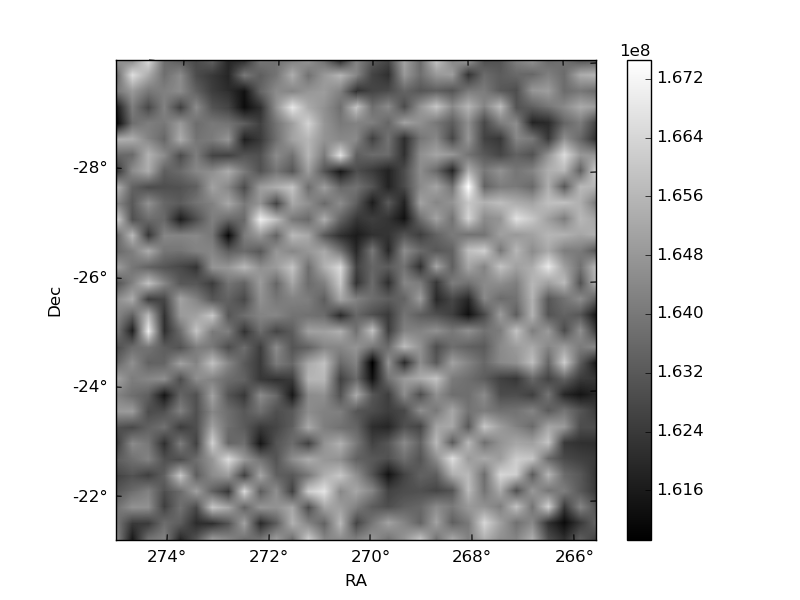
Histogram calculated using DETX and DETY for each event in the final _common_clean file
| Quadrant A | 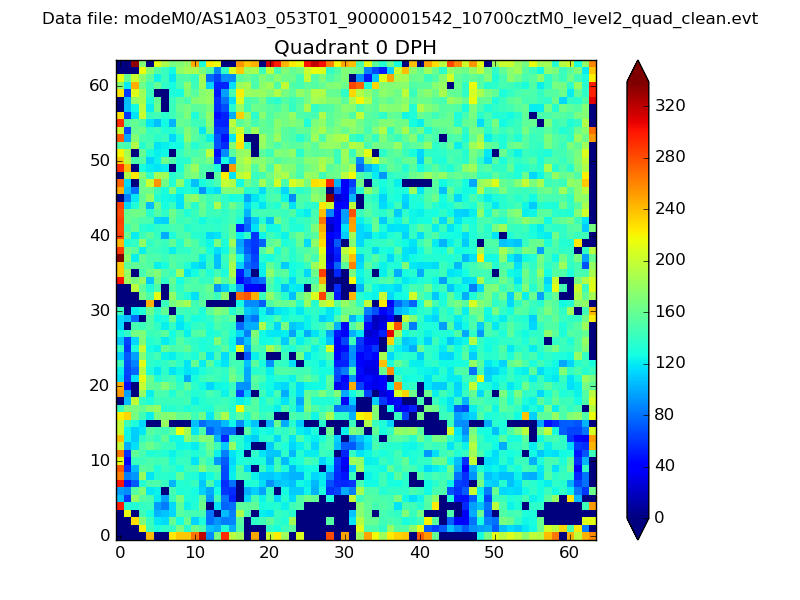 |
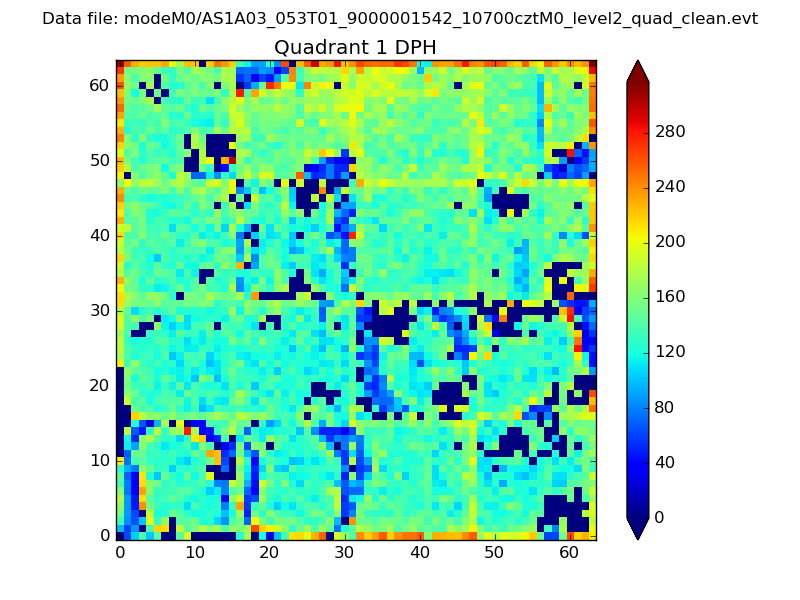 |
Quadrant B |
|---|---|---|---|
| Quadrant D | 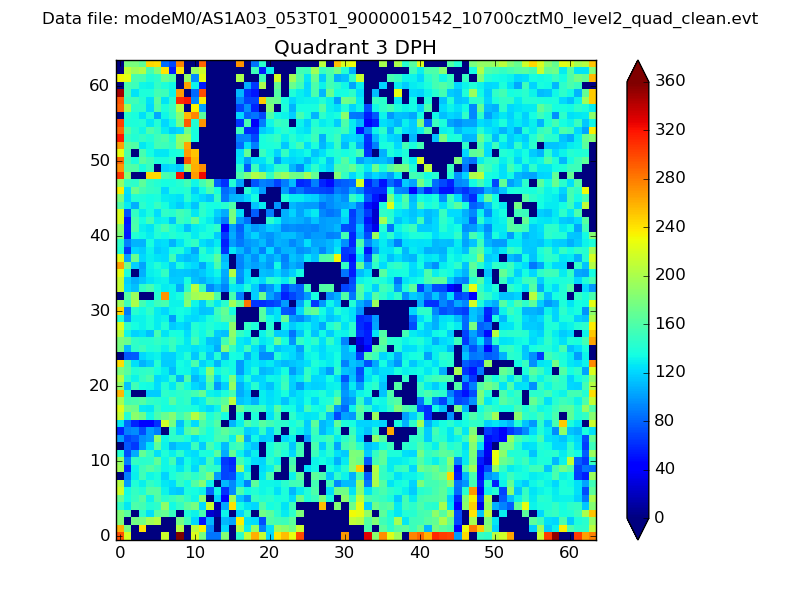 |
 |
Quadrant C |
| Plot type | Count rate plots | Images |
|---|---|---|
| Comparison with Poisson distribution Blue bars denote a histogram of data divided into 1 sec bins. Red curve is a Poisson curve with rate = median count rate of data. |
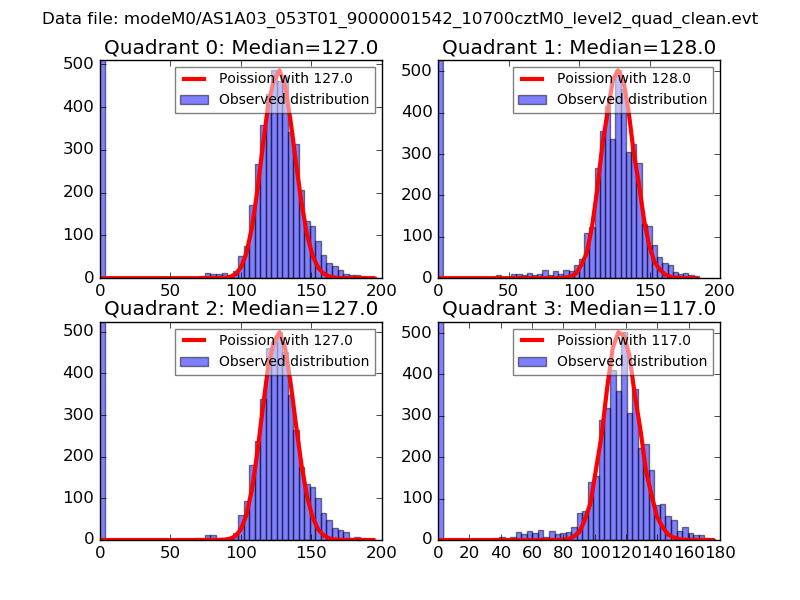 |
 |
| Quadrant-wise count rates Data is divided into 100 sec bins |
 |
|
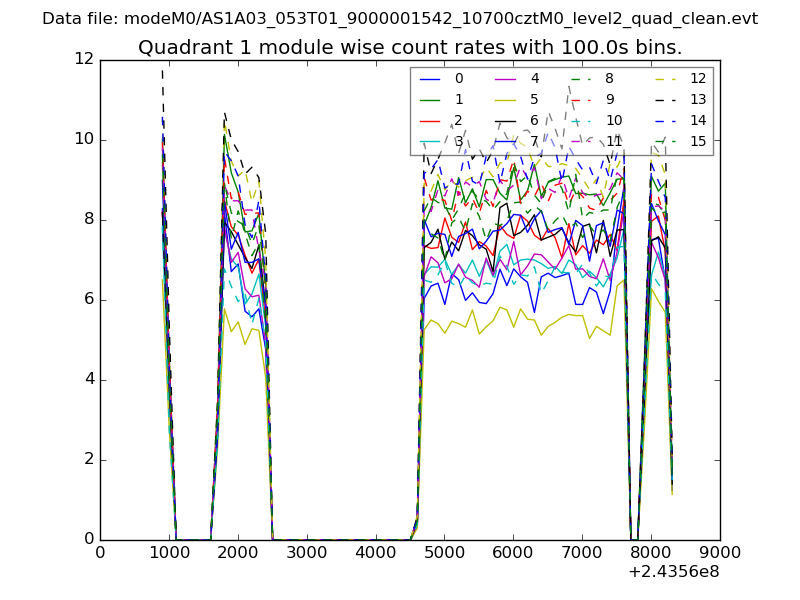
| Module-wise count rates for Quadrant A Data is divided into 100 sec bins |
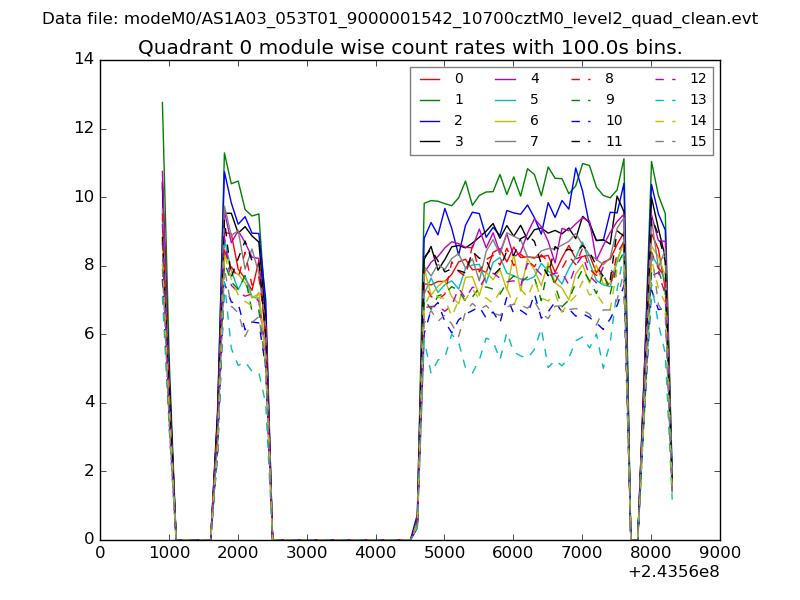 |
 |
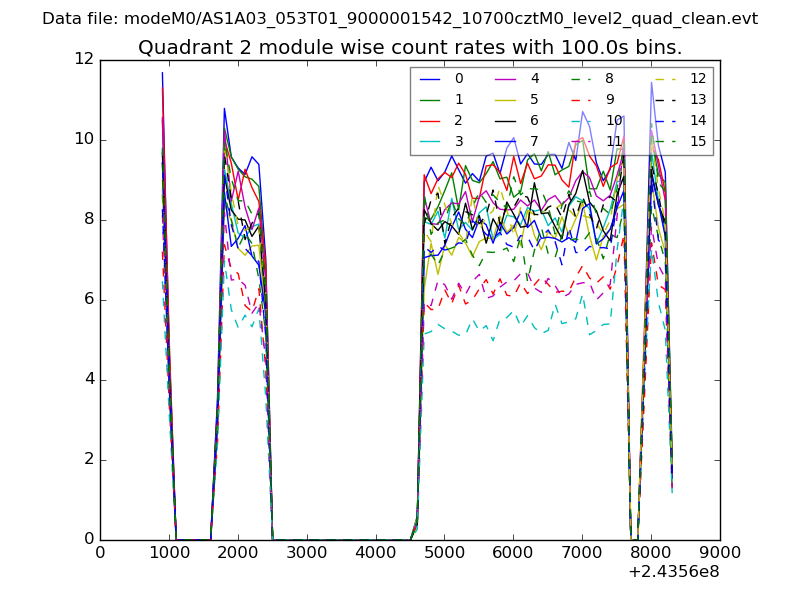
| Module-wise count rates for Quadrant B Data is divided into 100 sec bins |
 |
 |
| Module-wise count rates for Quadrant C Data is divided into 100 sec bins |
 |
 |
| Module-wise count rates for Quadrant D Data is divided into 100 sec bins |
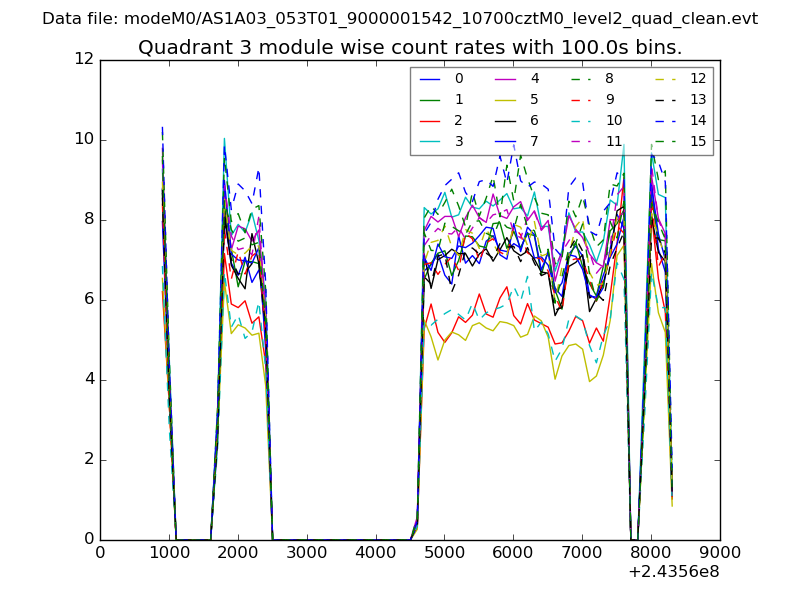 |
 |
| Parameter | Plot |
|---|---|
| CZT HV Monitor | 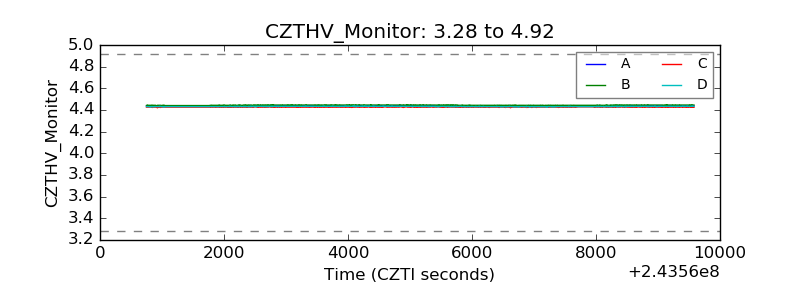 |
| D_VDD | 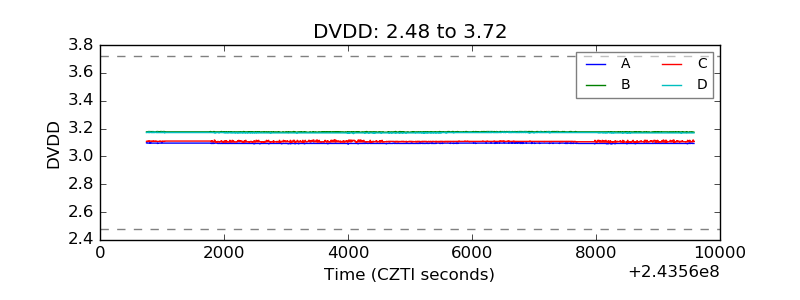 |
| Temperature 1 | 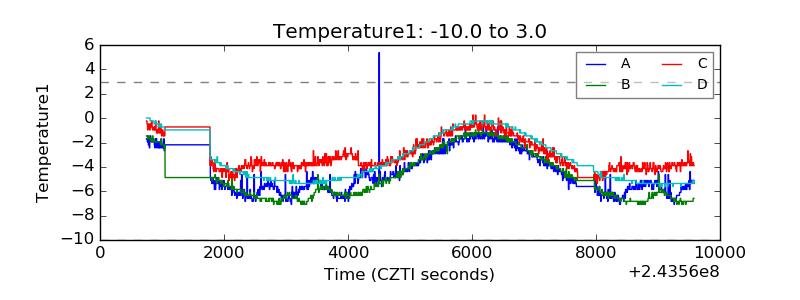 |
| Veto HV Monitor | 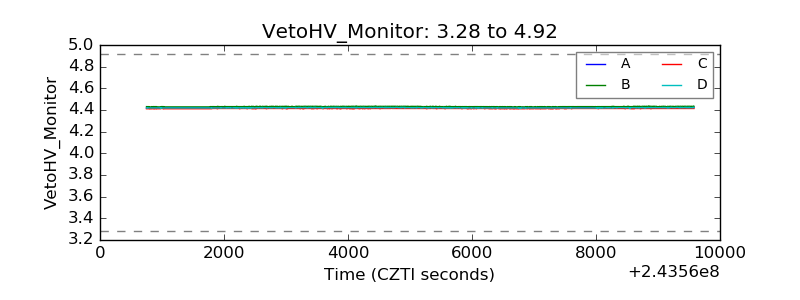 |
| Veto LLD | 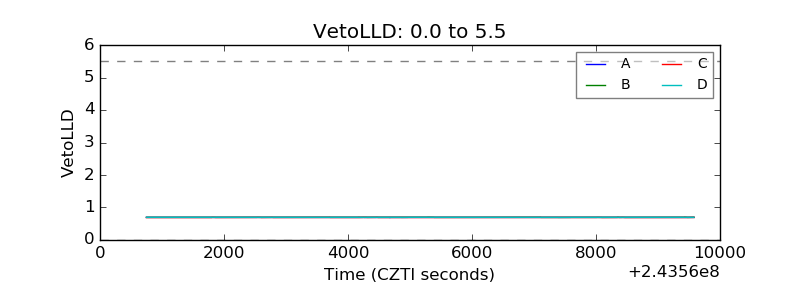 |
| Alpha Counter | 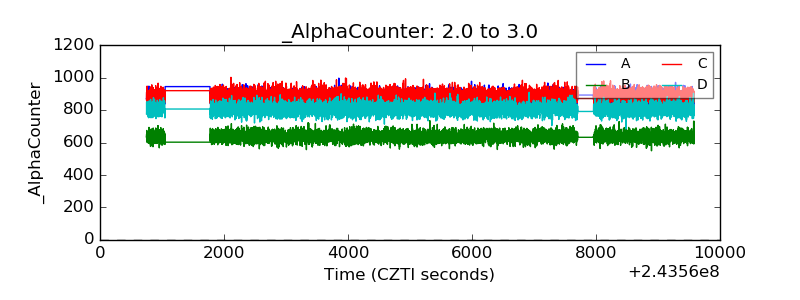 |
| _CPM_Rate | 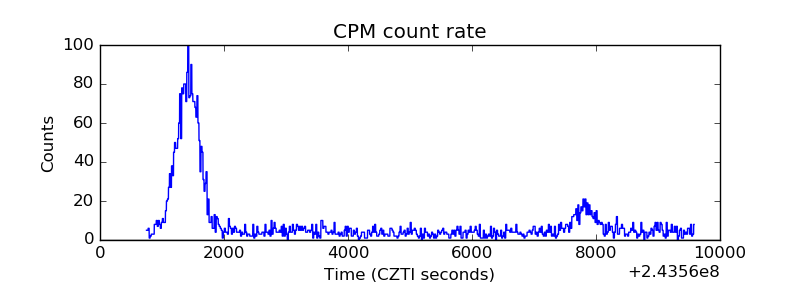 |
| CZT Counter | 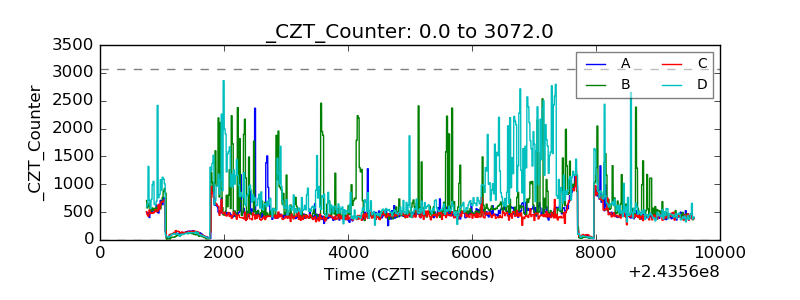 |
| +2.5 Volts monitor |  |
| +5 Volts monitor |  |
| _ROLL_ROT | 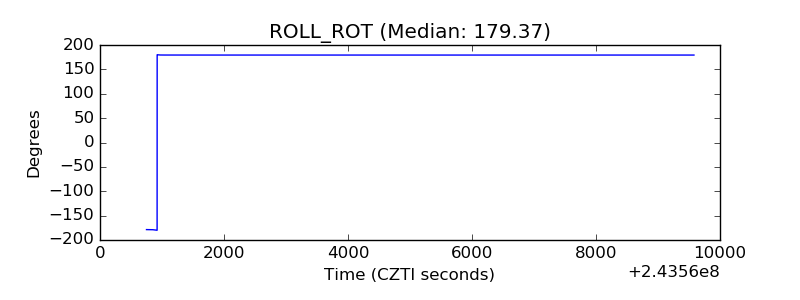 |
| _Roll_DEC | 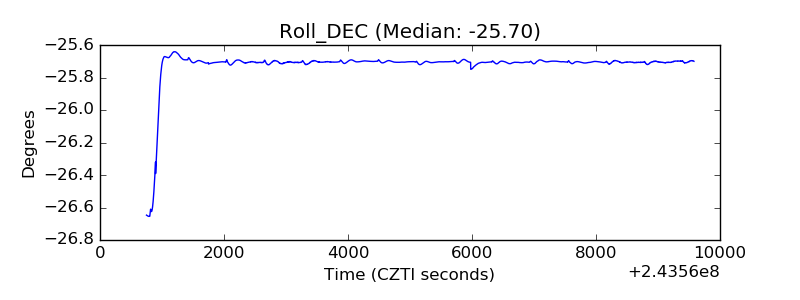 |
| _Roll_RA | 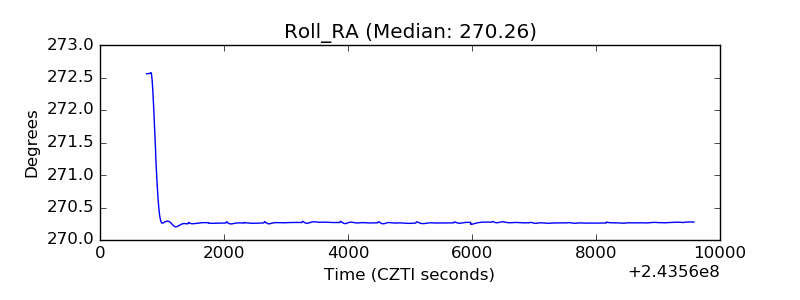 |
| Veto Counter | 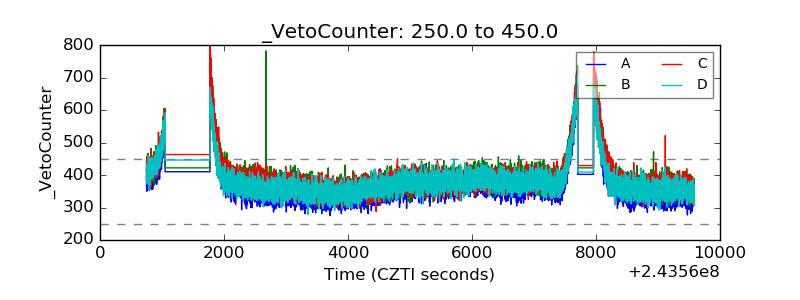 |