| Param | Original file | Final file |
|---|---|---|
| Filename | modeM0/AS1A03_053T01_9000001542_10701cztM0_level2.evt | modeM0/AS1A03_053T01_9000001542_10701cztM0_level2_quad_clean.evt |
| Size (bytes) | 673,850,880 | 94,754,880 |
| Size | 642.6 MB | 90.4 MB |
| Events in quadrant A | 4,754,284 | 578,236 |
| Events in quadrant B | 5,355,417 | 574,374 |
| Events in quadrant C | 4,075,605 | 579,922 |
| Events in quadrant D | 5,638,705 | 538,591 |
| Mode M0 | |||
|---|---|---|---|
| Quadrant | BADHDUFLAG | Total packets | Discarded packets |
| A | 0 | 20023 | 6 |
| B | 0 | 21554 | 7 |
| C | 0 | 18361 | 3 |
| D | 0 | 22687 | 1 |
| Mode M9 | |||
|---|---|---|---|
| Quadrant | BADHDUFLAG | Total packets | Discarded packets |
| A | 0 | 2 | 0 |
| B | 0 | 2 | 0 |
| C | 0 | 2 | 0 |
| D | 0 | 2 | 0 |
| Mode SS | |||
|---|---|---|---|
| Quadrant | BADHDUFLAG | Total packets | Discarded packets |
| A | 0 | 176 | 0 |
| B | 0 | 176 | 0 |
| C | 0 | 176 | 0 |
| D | 0 | 176 | 0 |
| Quadrant | Total seconds | Saturated seconds | Saturation percentage |
|---|---|---|---|
| A | 8602 | 498 | 5.789351% |
| B | 8602 | 596 | 6.928621% |
| C | 8603 | 206 | 2.394514% |
| D | 8604 | 408 | 4.741980% |
Noise dominated data is calculated using 1-second bins in cleaned event files. If a bin has >2000 counts, and if more than 50% of those come from <1% of pixels, then it is considered to be noise-dominated and hence unusable.
| Quadrant | # 1 sec bins | Bins with >0 counts | Bins with >2000 counts | High rate bins dominated by noise | Noise dominated (total time) | Noise dominated (detector-on time) | Marked lightcurve |
|---|---|---|---|---|---|---|---|
| A | 8859 | 8605 | 157 | 157 | 1.77% | 1.82% | 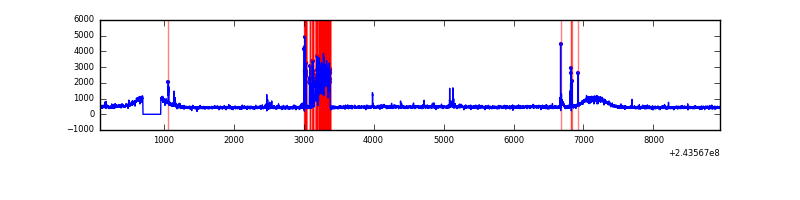 |
| B | 8859 | 8605 | 135 | 135 | 1.52% | 1.57% | 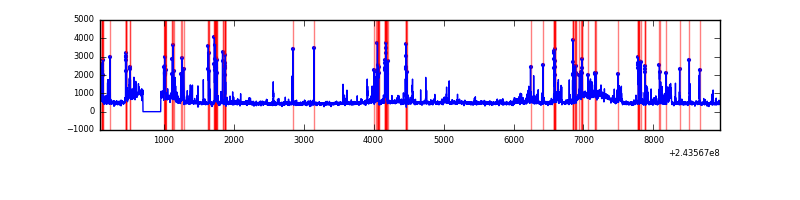 |
| C | 8859 | 8605 | 0 | 0 | 0.00% | 0.00% | 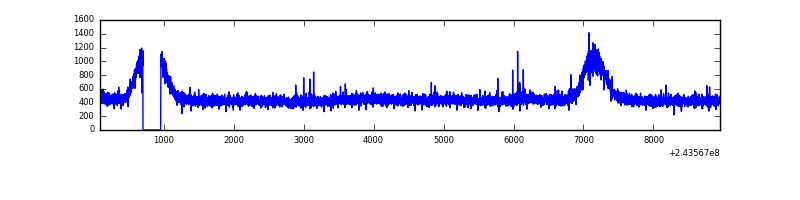 |
| D | 8859 | 8605 | 167 | 167 | 1.89% | 1.94% | 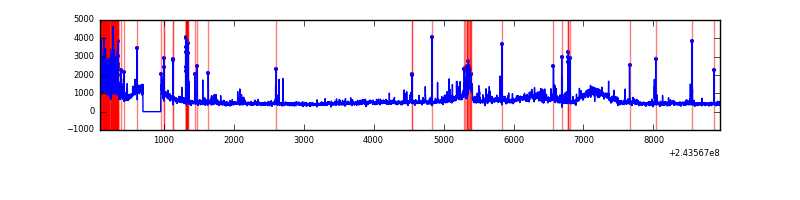 |
Top three noisy pixels from each quadrant. If the there are fewer than three noisy pixels in the level2.evt file, extra rows are filled as -1
| Pixel properties | Quadrant properties | ||||||
|---|---|---|---|---|---|---|---|
| Quadrant | DetID | PixID | Counts | Sigma | Mean | Median | Sigma |
| A | 4 | 2 | 525926 | 2409.03 | 1058 | 1035 | 217.9 |
| A | 15 | 174 | 76101 | 344.52 | 1058 | 1035 | 217.9 |
| A | 1 | 162 | 24966 | 109.83 | 1058 | 1035 | 217.9 |
| B | 4 | 239 | 1013203 | 4886.11 | 1055 | 1029 | 207.2 |
| B | 15 | 204 | 63711 | 302.59 | 1055 | 1029 | 207.2 |
| B | 4 | 81 | 61019 | 289.59 | 1055 | 1029 | 207.2 |
| C | 14 | 234 | 9876 | 35.97 | 1038 | 1043 | 245.6 |
| C | 13 | 61 | 7746 | 27.29 | 1038 | 1043 | 245.6 |
| C | 8 | 128 | 6791 | 23.41 | 1038 | 1043 | 245.6 |
| D | 2 | 16 | 836743 | 3316.26 | 1020 | 991 | 252.0 |
| D | 10 | 199 | 457828 | 1812.73 | 1020 | 991 | 252.0 |
| D | 8 | 195 | 124440 | 489.85 | 1020 | 991 | 252.0 |
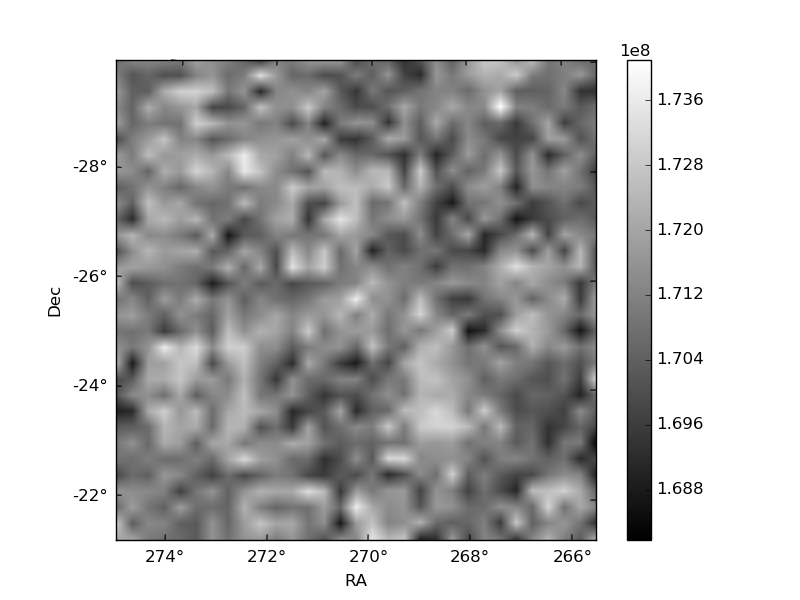
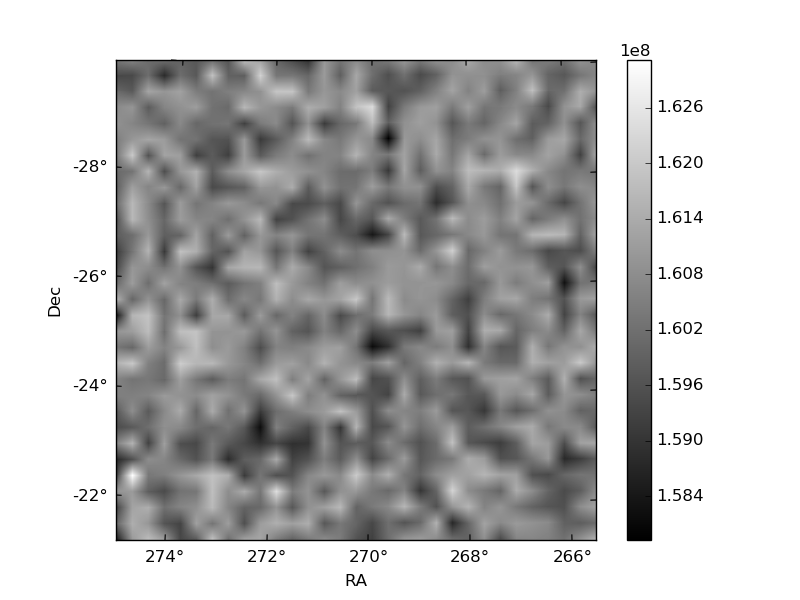
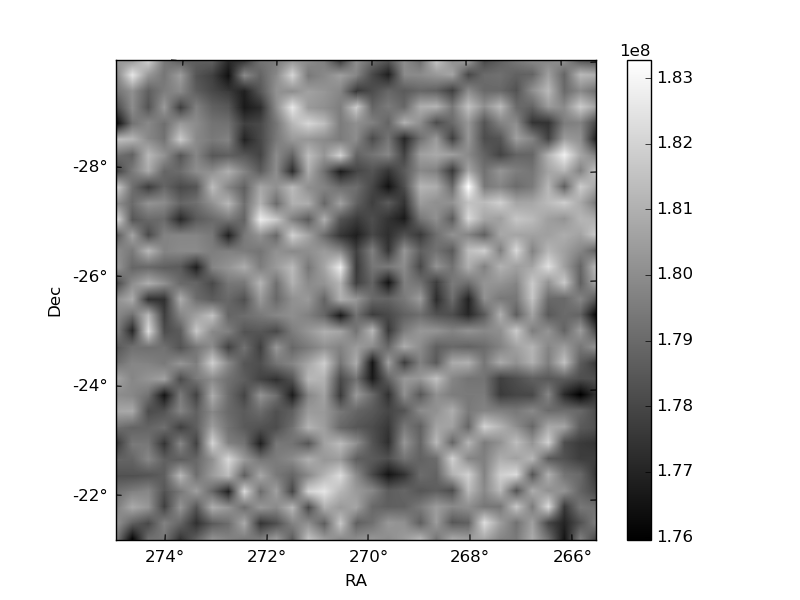
Histogram calculated using DETX and DETY for each event in the final _common_clean file
| Quadrant A | 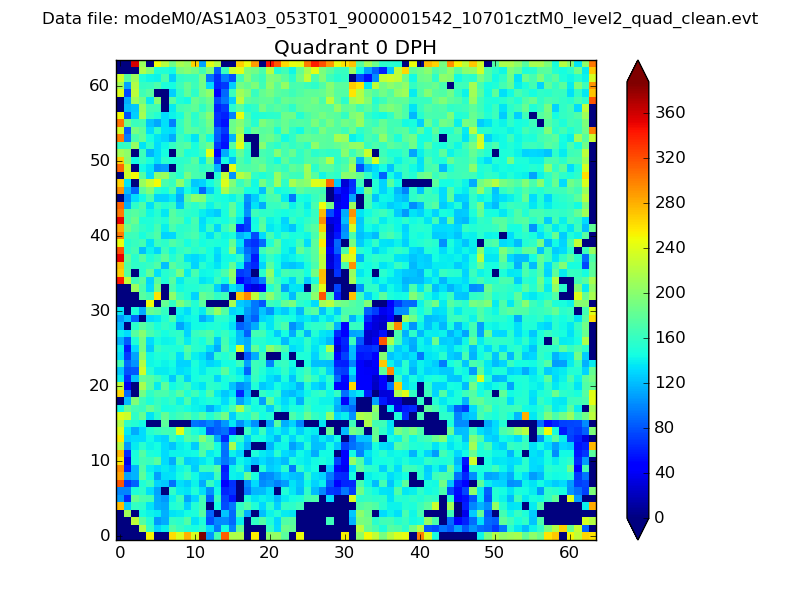 |
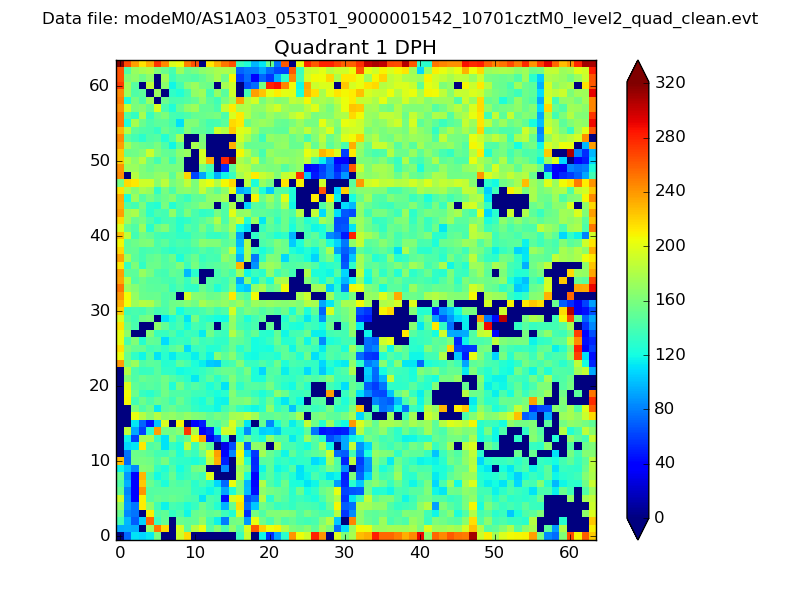 |
Quadrant B |
|---|---|---|---|
| Quadrant D | 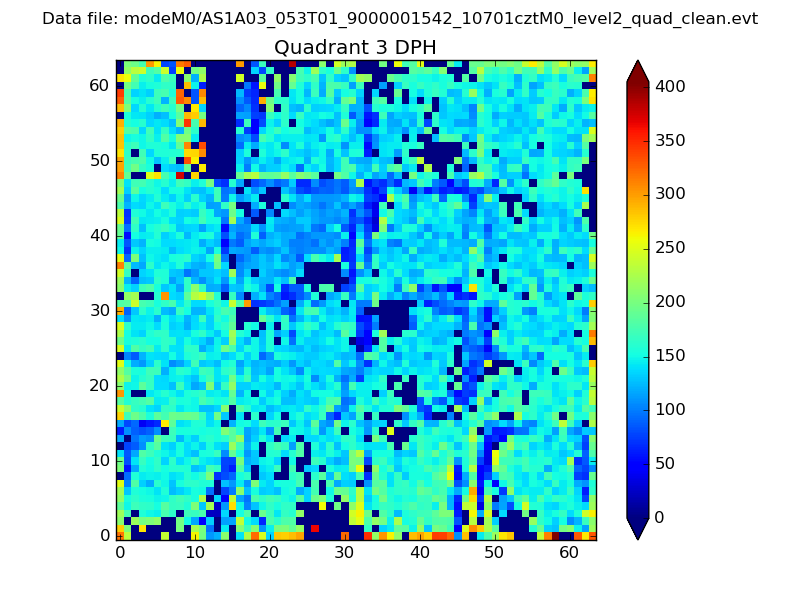 |
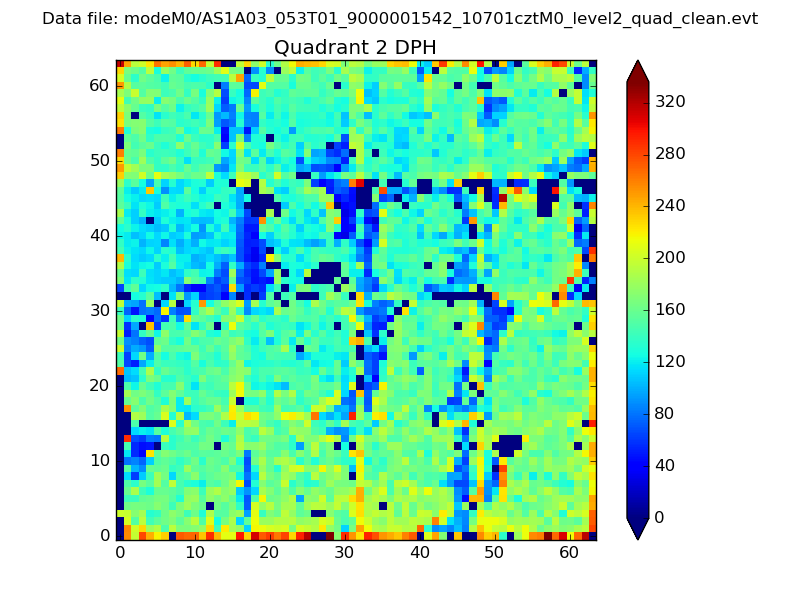 |
Quadrant C |
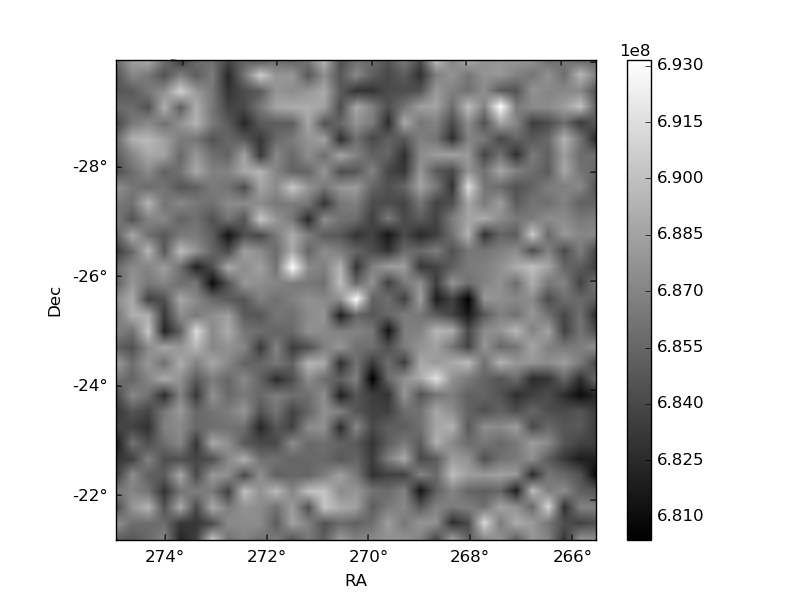
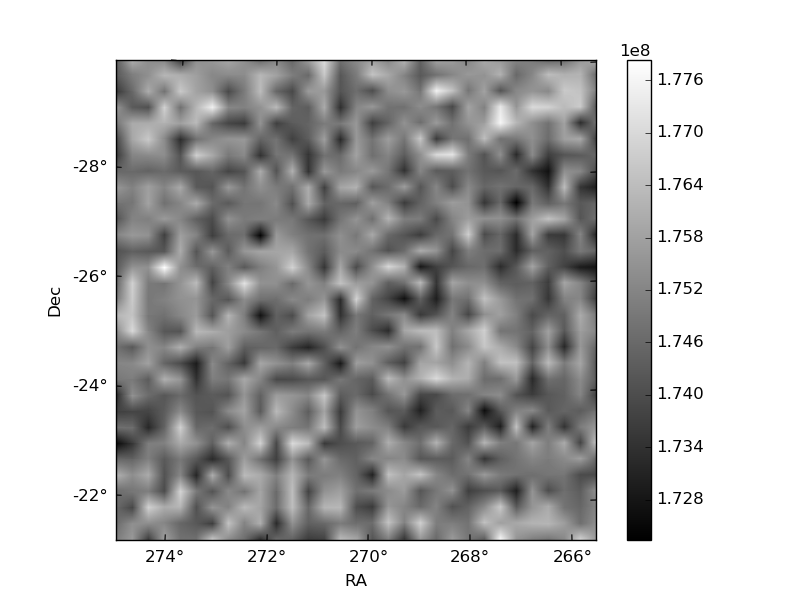
| Plot type | Count rate plots | Images |
|---|---|---|
| Comparison with Poisson distribution Blue bars denote a histogram of data divided into 1 sec bins. Red curve is a Poisson curve with rate = median count rate of data. |
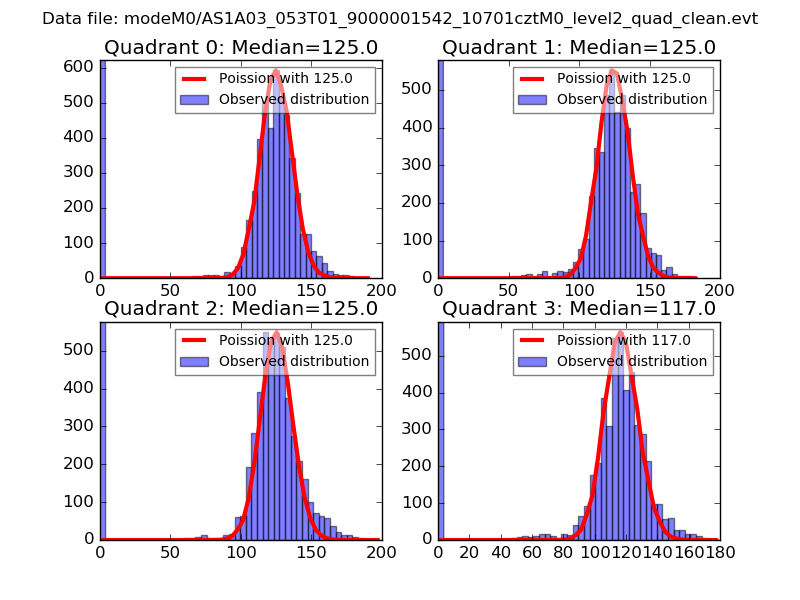 |
 |
| Quadrant-wise count rates Data is divided into 100 sec bins |
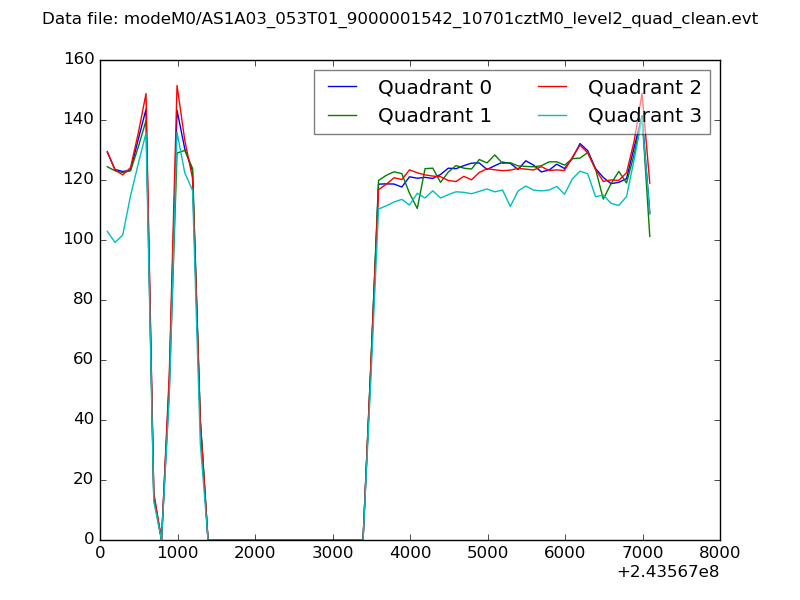 |
|
| Module-wise count rates for Quadrant A Data is divided into 100 sec bins |
 |
 |
| Module-wise count rates for Quadrant B Data is divided into 100 sec bins |
 |
 |
| Module-wise count rates for Quadrant C Data is divided into 100 sec bins |
 |
 |
| Module-wise count rates for Quadrant D Data is divided into 100 sec bins |
 |
 |
| Parameter | Plot |
|---|---|
| CZT HV Monitor | 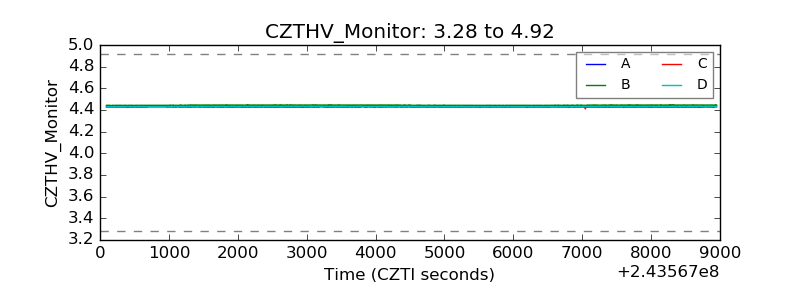 |
| D_VDD | 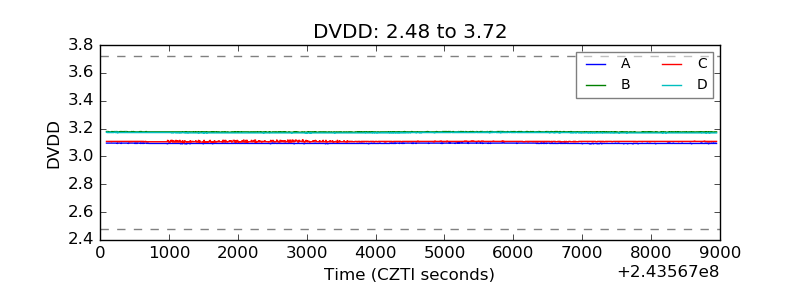 |
| Temperature 1 | 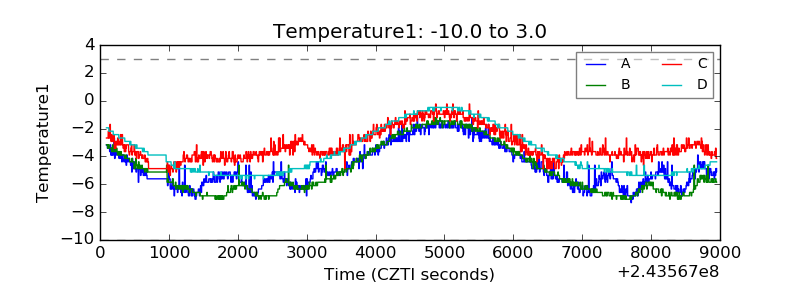 |
| Veto HV Monitor | 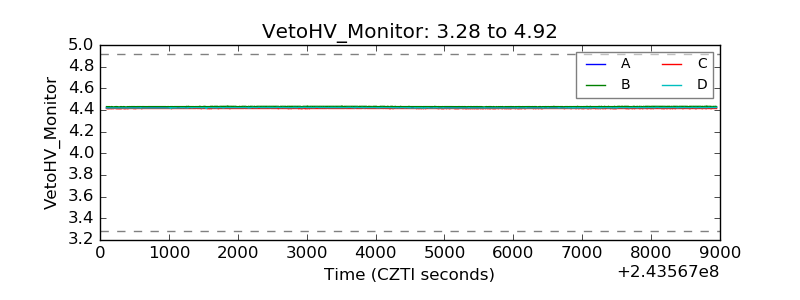 |
| Veto LLD | 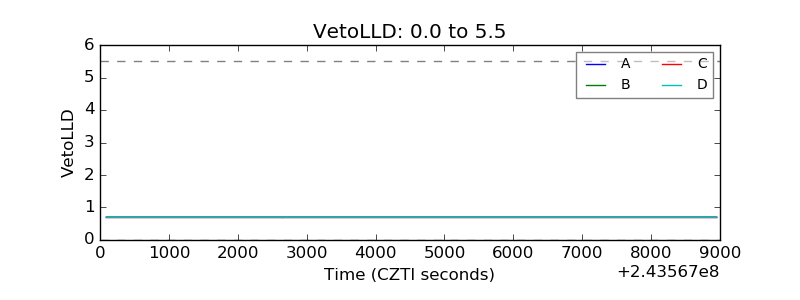 |
| Alpha Counter | 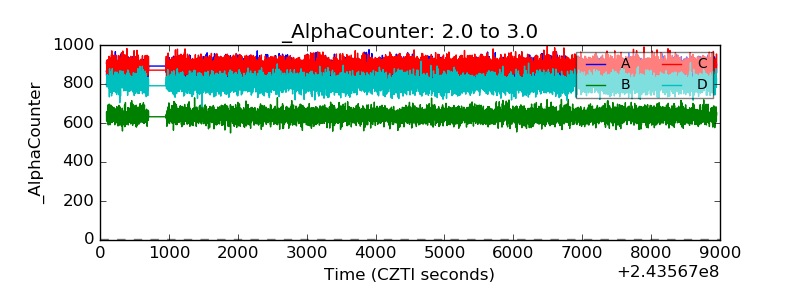 |
| _CPM_Rate | 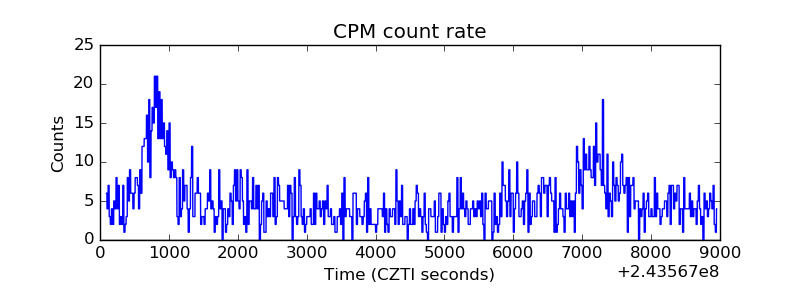 |
| CZT Counter |  |
| +2.5 Volts monitor | 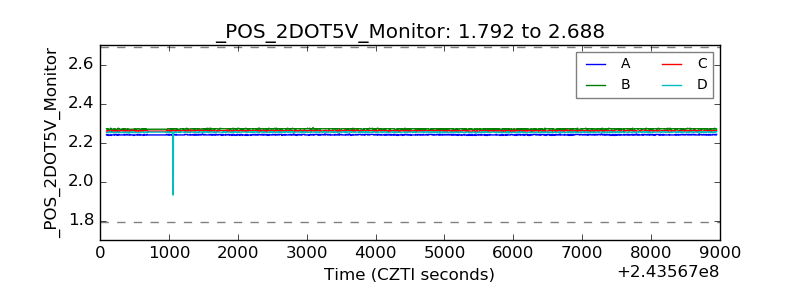 |
| +5 Volts monitor |  |
| _ROLL_ROT | 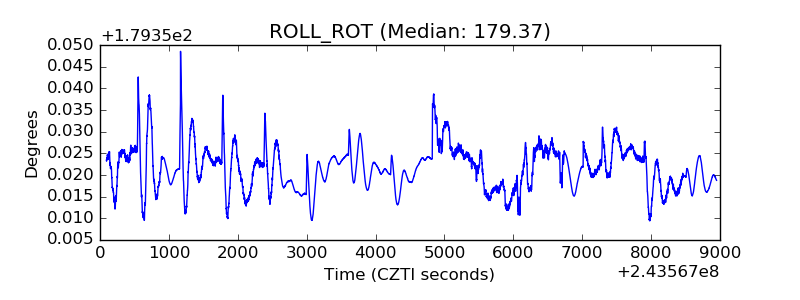 |
| _Roll_DEC | 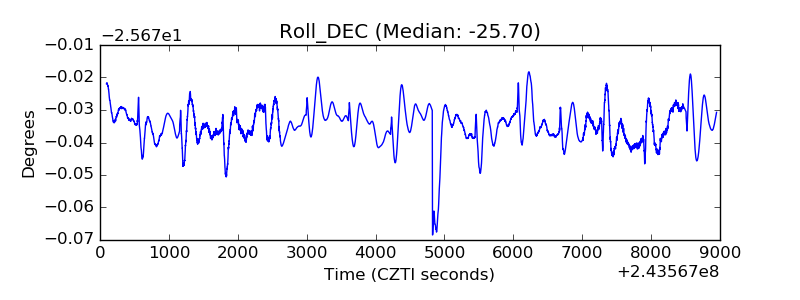 |
| _Roll_RA |  |
| Veto Counter |  |