| Param | Original file | Final file |
|---|---|---|
| Filename | modeM0/AS1A03_053T01_9000001542_10704cztM0_level2.evt | modeM0/AS1A03_053T01_9000001542_10704cztM0_level2_quad_clean.evt |
| Size (bytes) | 955,503,360 | 154,851,840 |
| Size | 911.2 MB | 147.7 MB |
| Events in quadrant A | 6,174,559 | 977,382 |
| Events in quadrant B | 7,980,655 | 965,505 |
| Events in quadrant C | 5,607,126 | 973,436 |
| Events in quadrant D | 8,323,001 | 902,533 |
| Mode M0 | |||
|---|---|---|---|
| Quadrant | BADHDUFLAG | Total packets | Discarded packets |
| A | 0 | 26540 | 46 |
| B | 0 | 31822 | 69 |
| C | 0 | 25551 | 44 |
| D | 0 | 32793 | 91 |
| Mode M9 | |||
|---|---|---|---|
| Quadrant | BADHDUFLAG | Total packets | Discarded packets |
| A | 0 | 12 | 0 |
| B | 0 | 12 | 0 |
| C | 0 | 12 | 0 |
| D | 0 | 12 | 0 |
| Mode SS | |||
|---|---|---|---|
| Quadrant | BADHDUFLAG | Total packets | Discarded packets |
| A | 0 | 258 | 0 |
| B | 0 | 258 | 0 |
| C | 0 | 258 | 0 |
| D | 0 | 258 | 0 |
| Quadrant | Total seconds | Saturated seconds | Saturation percentage |
|---|---|---|---|
| A | 12595 | 130 | 1.032156% |
| B | 12590 | 646 | 5.131056% |
| C | 12594 | 79 | 0.627283% |
| D | 12583 | 402 | 3.194787% |
Noise dominated data is calculated using 1-second bins in cleaned event files. If a bin has >2000 counts, and if more than 50% of those come from <1% of pixels, then it is considered to be noise-dominated and hence unusable.
| Quadrant | # 1 sec bins | Bins with >0 counts | Bins with >2000 counts | High rate bins dominated by noise | Noise dominated (total time) | Noise dominated (detector-on time) | Marked lightcurve |
|---|---|---|---|---|---|---|---|
| A | 13820 | 12616 | 15 | 15 | 0.11% | 0.12% | 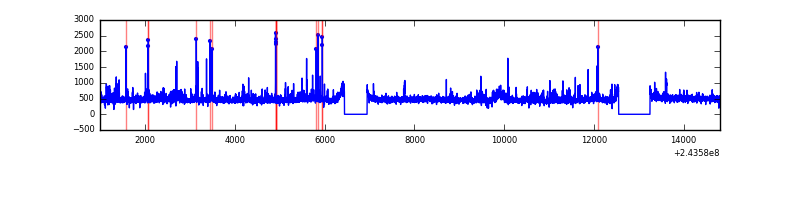 |
| B | 13820 | 12616 | 328 | 328 | 2.37% | 2.60% | 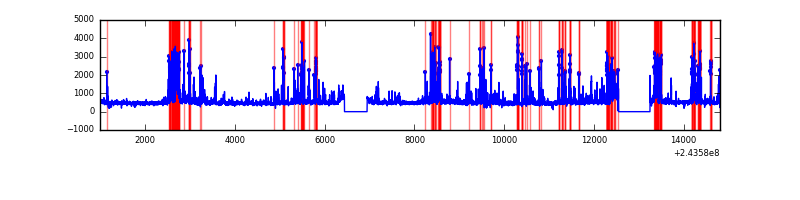 |
| C | 13820 | 12617 | 2 | 2 | 0.01% | 0.02% | 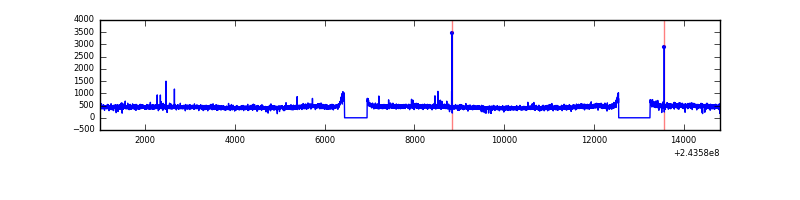 |
| D | 13820 | 12616 | 254 | 254 | 1.84% | 2.01% | 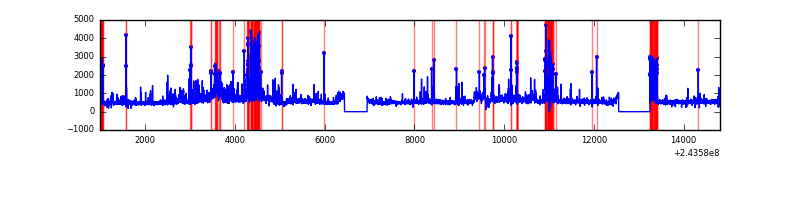 |
Top three noisy pixels from each quadrant. If the there are fewer than three noisy pixels in the level2.evt file, extra rows are filled as -1
| Pixel properties | Quadrant properties | ||||||
|---|---|---|---|---|---|---|---|
| Quadrant | DetID | PixID | Counts | Sigma | Mean | Median | Sigma |
| A | 14 | 254 | 130243 | 430.22 | 1477 | 1444 | 299.4 |
| A | 15 | 174 | 96880 | 318.78 | 1477 | 1444 | 299.4 |
| A | 1 | 162 | 94417 | 310.55 | 1477 | 1444 | 299.4 |
| B | 4 | 239 | 1796500 | 6453.64 | 1454 | 1417 | 278.2 |
| B | 4 | 81 | 124235 | 441.55 | 1454 | 1417 | 278.2 |
| B | 0 | 214 | 117016 | 415.6 | 1454 | 1417 | 278.2 |
| C | 14 | 234 | 20432 | 57.31 | 1427 | 1435 | 331.5 |
| C | 8 | 128 | 10597 | 27.64 | 1427 | 1435 | 331.5 |
| C | 13 | 61 | 10524 | 27.42 | 1427 | 1435 | 331.5 |
| D | 8 | 195 | 743902 | 2215.71 | 1399 | 1363 | 335.1 |
| D | 10 | 199 | 738167 | 2198.6 | 1399 | 1363 | 335.1 |
| D | 2 | 16 | 737097 | 2195.41 | 1399 | 1363 | 335.1 |
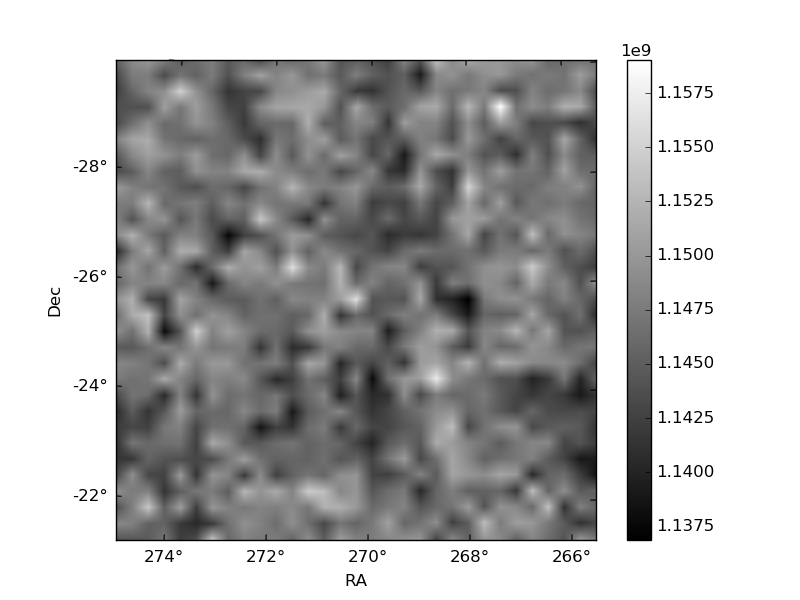
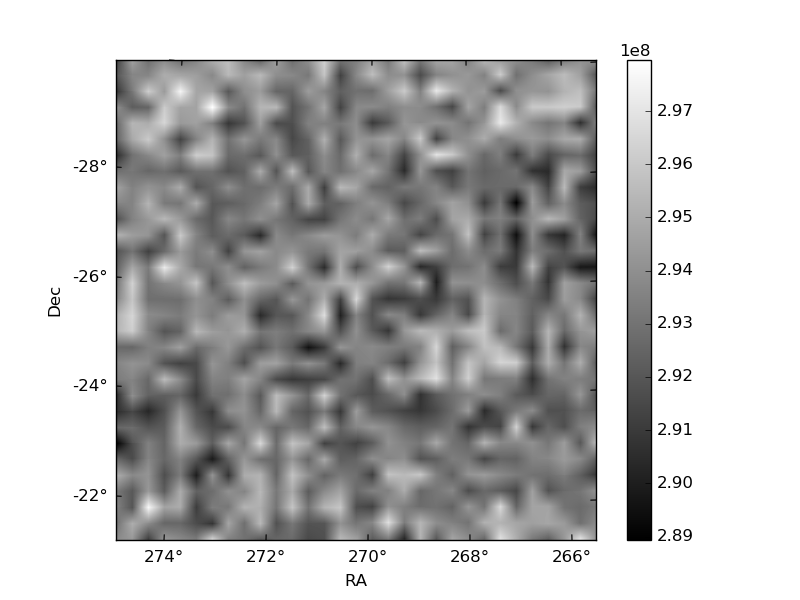
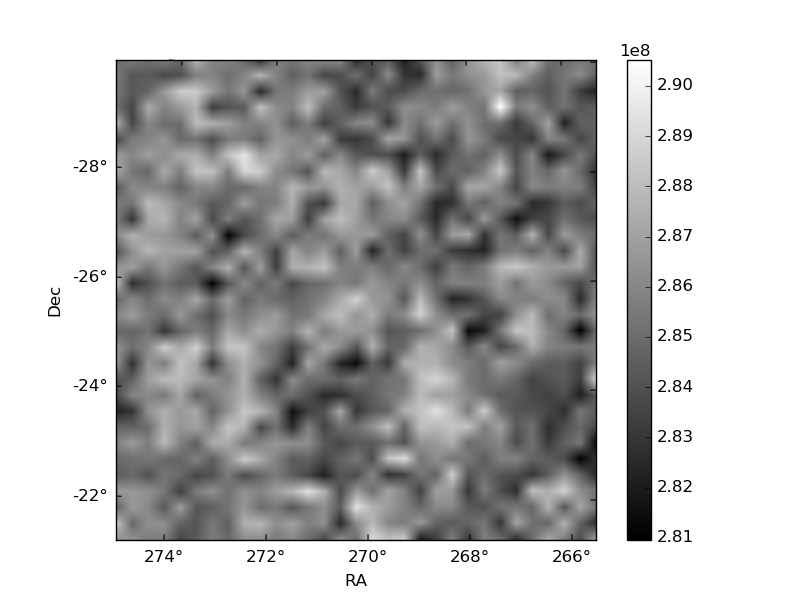
Histogram calculated using DETX and DETY for each event in the final _common_clean file
| Quadrant A | 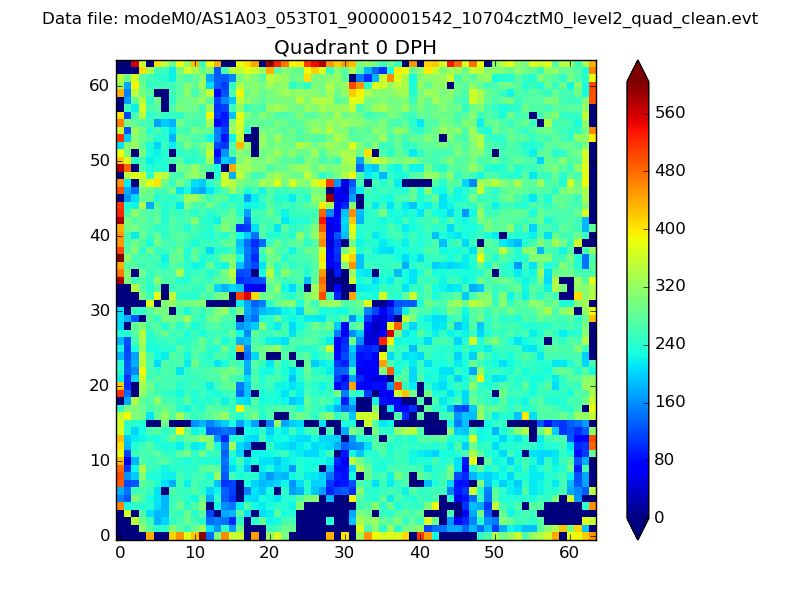 |
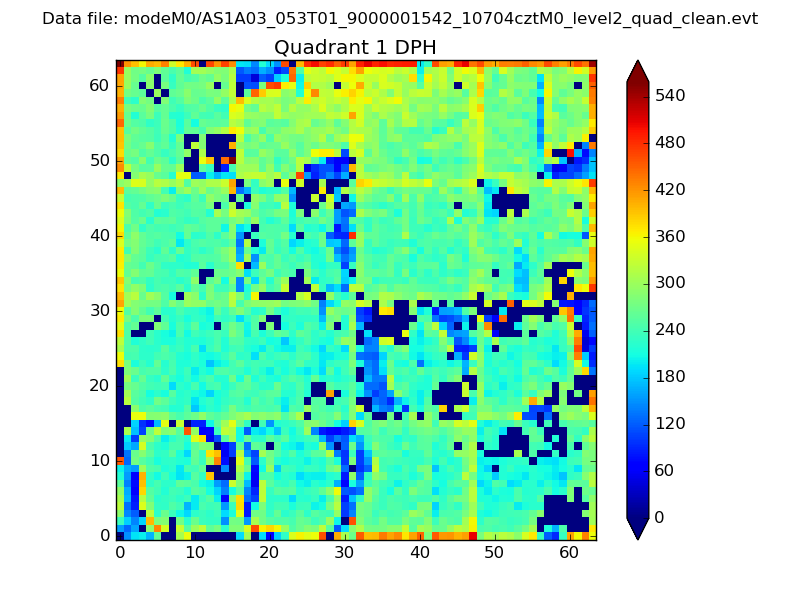 |
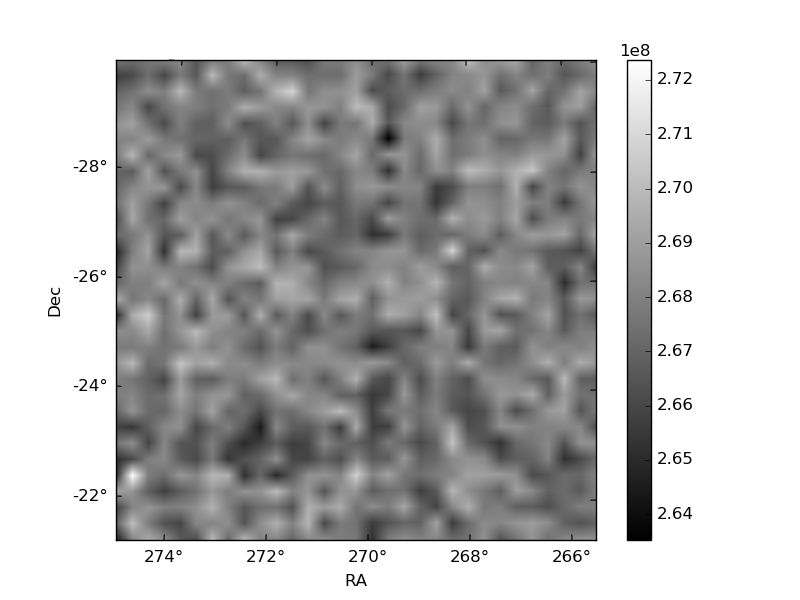
Quadrant B |
|---|---|---|---|
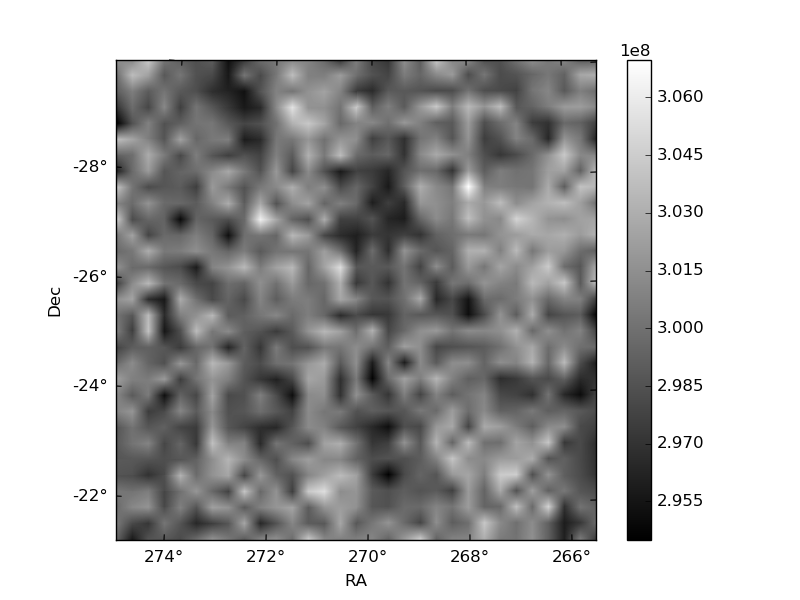
| Quadrant D | 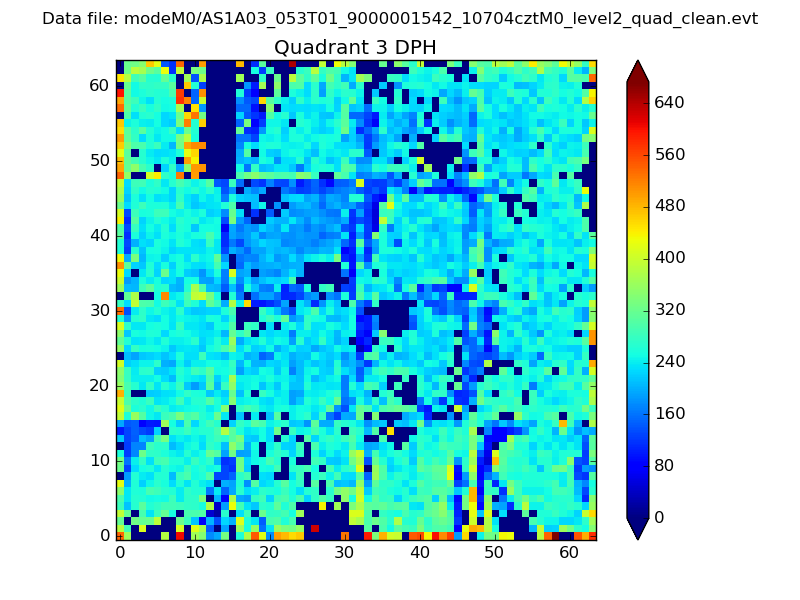 |
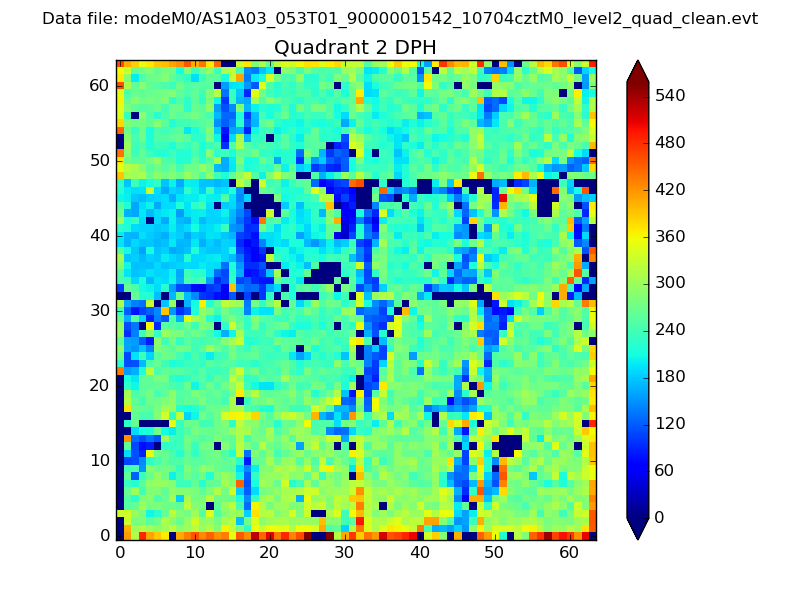 |
Quadrant C |
| Plot type | Count rate plots | Images |
|---|---|---|
| Comparison with Poisson distribution Blue bars denote a histogram of data divided into 1 sec bins. Red curve is a Poisson curve with rate = median count rate of data. |
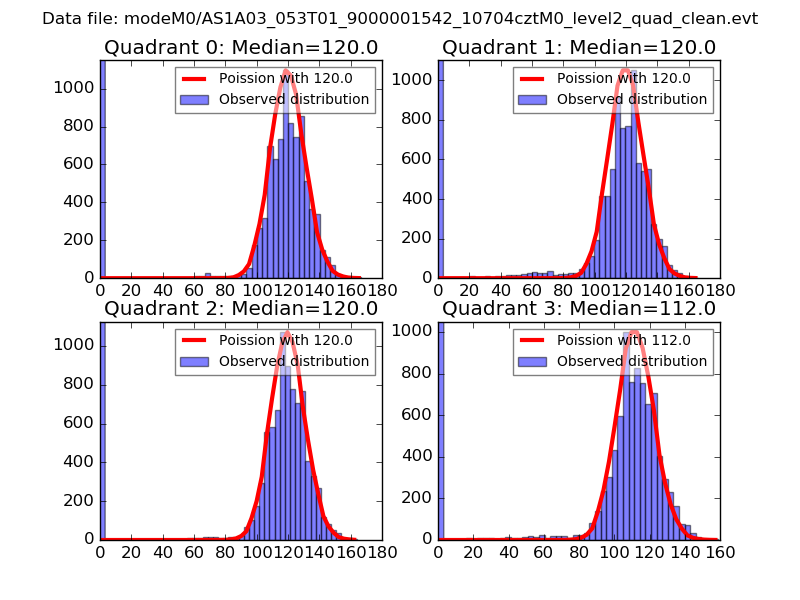 |
 |
| Quadrant-wise count rates Data is divided into 100 sec bins |
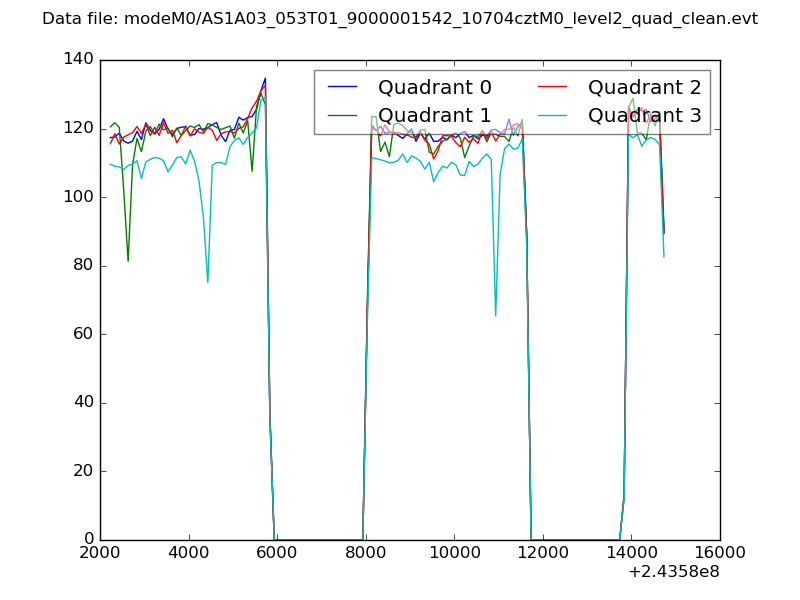 |
|
| Module-wise count rates for Quadrant A Data is divided into 100 sec bins |
 |
 |
| Module-wise count rates for Quadrant B Data is divided into 100 sec bins |
 |
 |
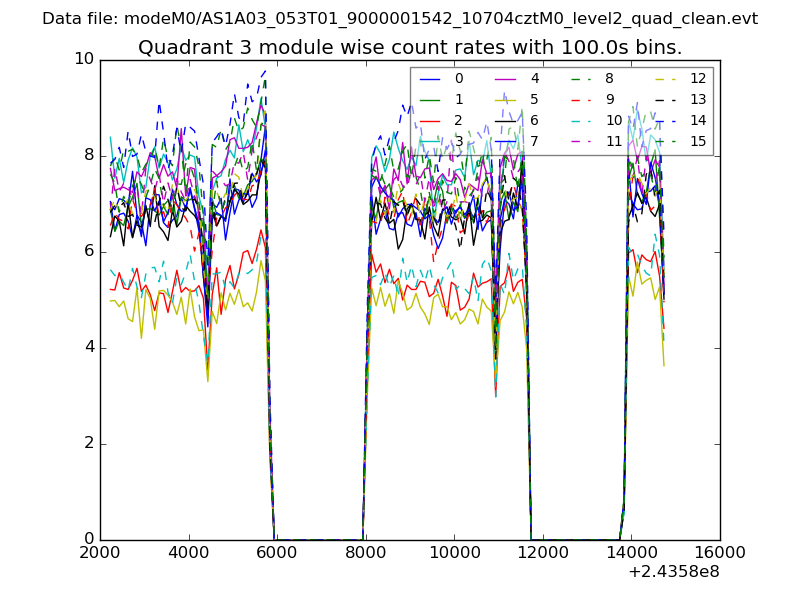
| Module-wise count rates for Quadrant C Data is divided into 100 sec bins |
 |
 |
| Module-wise count rates for Quadrant D Data is divided into 100 sec bins |
 |
 |
| Parameter | Plot |
|---|---|
| CZT HV Monitor |  |
| D_VDD | 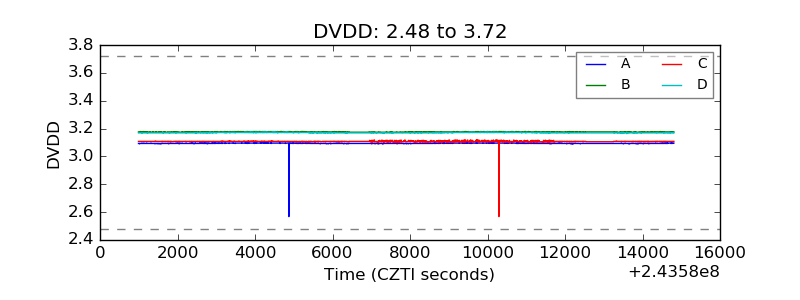 |
| Temperature 1 | 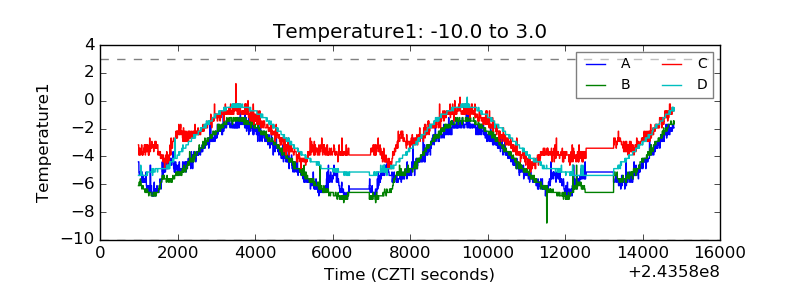 |
| Veto HV Monitor | 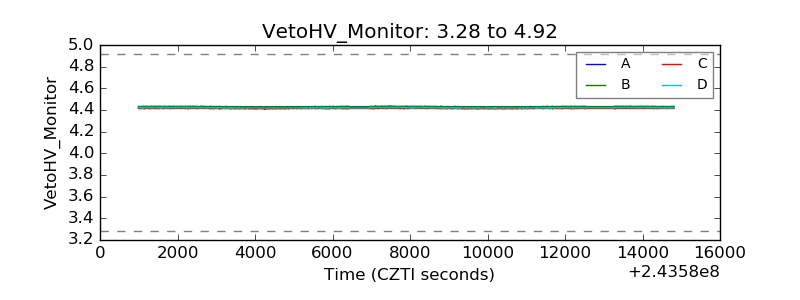 |
| Veto LLD | 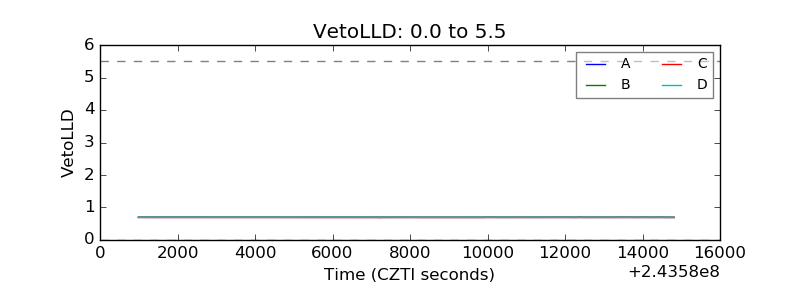 |
| Alpha Counter | 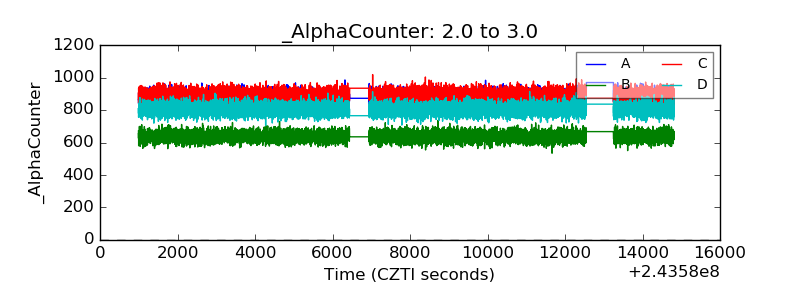 |
| _CPM_Rate | 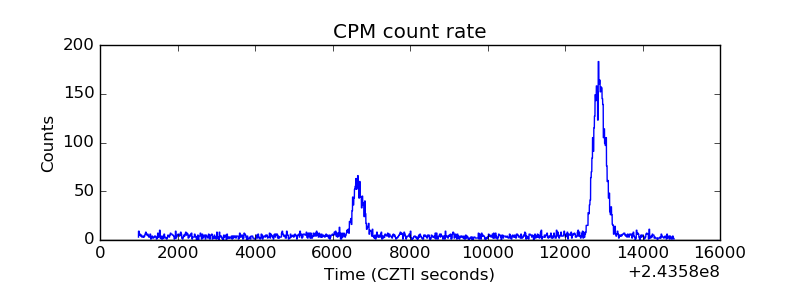 |
| CZT Counter | 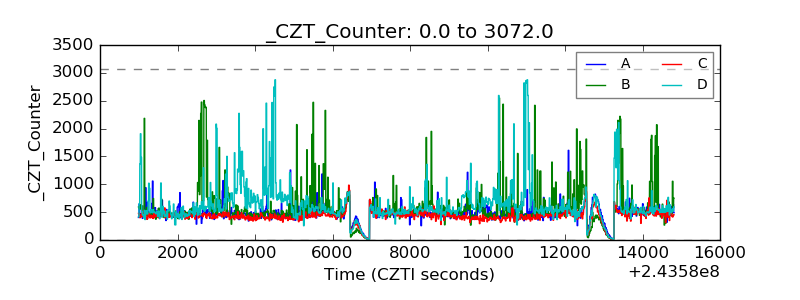 |
| +2.5 Volts monitor |  |
| +5 Volts monitor |  |
| _ROLL_ROT | 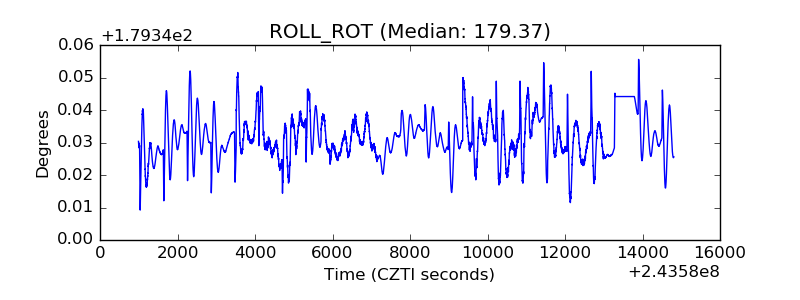 |
| _Roll_DEC | 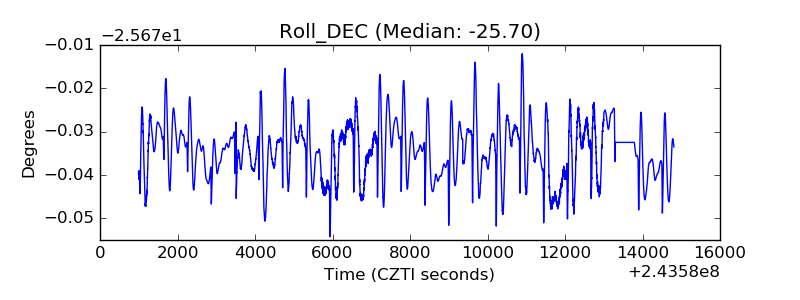 |
| _Roll_RA | 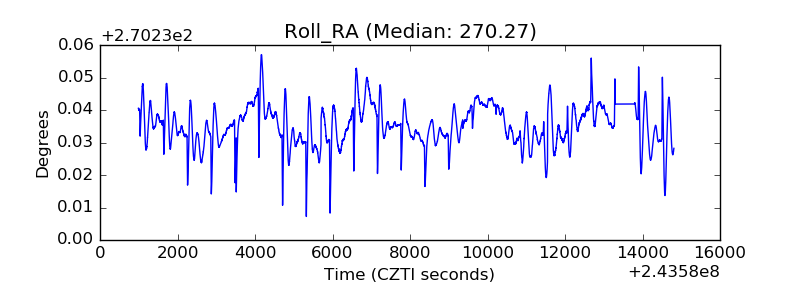 |
| Veto Counter |  |