| Param | Original file | Final file |
|---|---|---|
| Filename | modeM0/AS1A03_053T01_9000001542_10705cztM0_level2.evt | modeM0/AS1A03_053T01_9000001542_10705cztM0_level2_quad_clean.evt |
| Size (bytes) | 533,318,400 | 92,882,880 |
| Size | 508.6 MB | 88.6 MB |
| Events in quadrant A | 3,391,166 | 598,414 |
| Events in quadrant B | 4,628,959 | 591,618 |
| Events in quadrant C | 3,077,897 | 594,326 |
| Events in quadrant D | 4,591,709 | 553,983 |
| Mode M0 | |||
|---|---|---|---|
| Quadrant | BADHDUFLAG | Total packets | Discarded packets |
| A | 0 | 14351 | 4 |
| B | 0 | 18126 | 3 |
| C | 0 | 13821 | 1 |
| D | 0 | 17865 | 3 |
| Mode M9 | |||
|---|---|---|---|
| Quadrant | BADHDUFLAG | Total packets | Discarded packets |
| A | 0 | 8 | 0 |
| B | 0 | 8 | 0 |
| C | 0 | 8 | 0 |
| D | 0 | 8 | 0 |
| Mode SS | |||
|---|---|---|---|
| Quadrant | BADHDUFLAG | Total packets | Discarded packets |
| A | 0 | 140 | 0 |
| B | 0 | 140 | 0 |
| C | 0 | 140 | 0 |
| D | 0 | 140 | 0 |
| Quadrant | Total seconds | Saturated seconds | Saturation percentage |
|---|---|---|---|
| A | 6801 | 88 | 1.293927% |
| B | 6801 | 417 | 6.131451% |
| C | 6802 | 53 | 0.779183% |
| D | 6801 | 229 | 3.367152% |
Noise dominated data is calculated using 1-second bins in cleaned event files. If a bin has >2000 counts, and if more than 50% of those come from <1% of pixels, then it is considered to be noise-dominated and hence unusable.
| Quadrant | # 1 sec bins | Bins with >0 counts | Bins with >2000 counts | High rate bins dominated by noise | Noise dominated (total time) | Noise dominated (detector-on time) | Marked lightcurve |
|---|---|---|---|---|---|---|---|
| A | 7637 | 6802 | 1 | 1 | 0.01% | 0.01% | 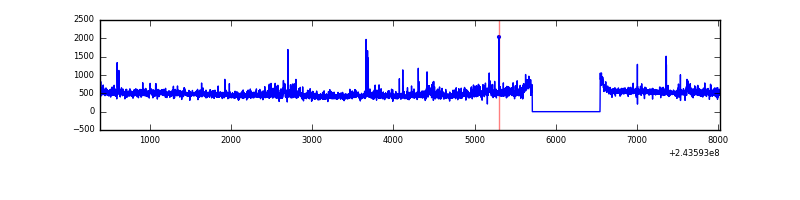 |
| B | 7637 | 6803 | 202 | 202 | 2.65% | 2.97% | 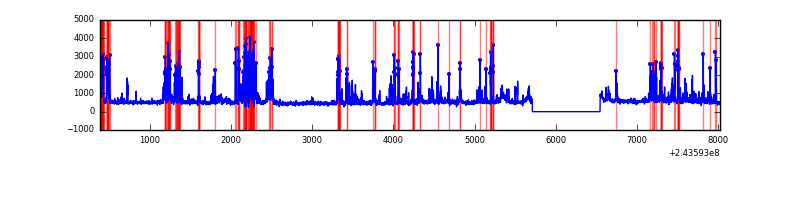 |
| C | 7637 | 6803 | 1 | 1 | 0.01% | 0.01% | 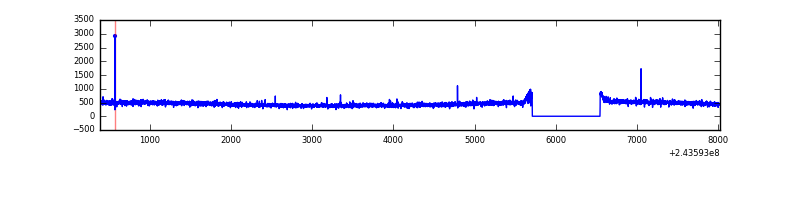 |
| D | 7637 | 6802 | 167 | 167 | 2.19% | 2.46% | 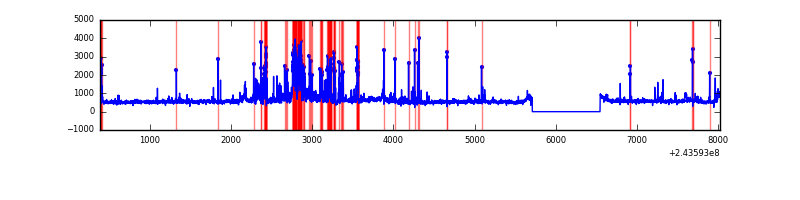 |
Top three noisy pixels from each quadrant. If the there are fewer than three noisy pixels in the level2.evt file, extra rows are filled as -1
| Pixel properties | Quadrant properties | ||||||
|---|---|---|---|---|---|---|---|
| Quadrant | DetID | PixID | Counts | Sigma | Mean | Median | Sigma |
| A | 1 | 162 | 68073 | 403.48 | 817 | 798 | 166.7 |
| A | 14 | 254 | 37771 | 221.74 | 817 | 798 | 166.7 |
| A | 4 | 2 | 32527 | 190.29 | 817 | 798 | 166.7 |
| B | 4 | 239 | 1097830 | 7132.48 | 801 | 782 | 153.8 |
| B | 4 | 81 | 96406 | 621.7 | 801 | 782 | 153.8 |
| B | 0 | 85 | 93350 | 601.83 | 801 | 782 | 153.8 |
| C | 14 | 234 | 8558 | 42.11 | 787 | 791 | 184.4 |
| C | 13 | 61 | 5809 | 27.21 | 787 | 791 | 184.4 |
| C | 14 | 67 | 2501 | 9.27 | 787 | 791 | 184.4 |
| D | 10 | 199 | 493931 | 2608.78 | 781 | 759 | 189.0 |
| D | 8 | 195 | 389673 | 2057.27 | 781 | 759 | 189.0 |
| D | 2 | 16 | 303493 | 1601.4 | 781 | 759 | 189.0 |
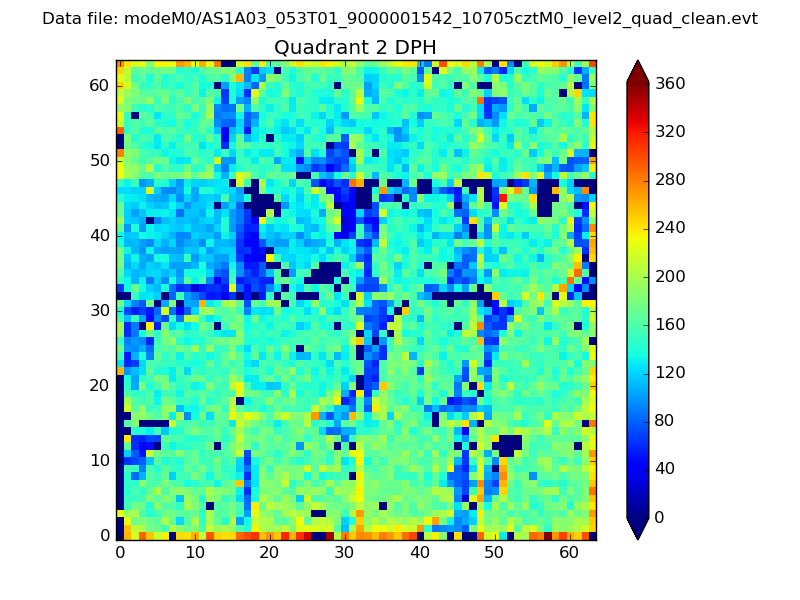
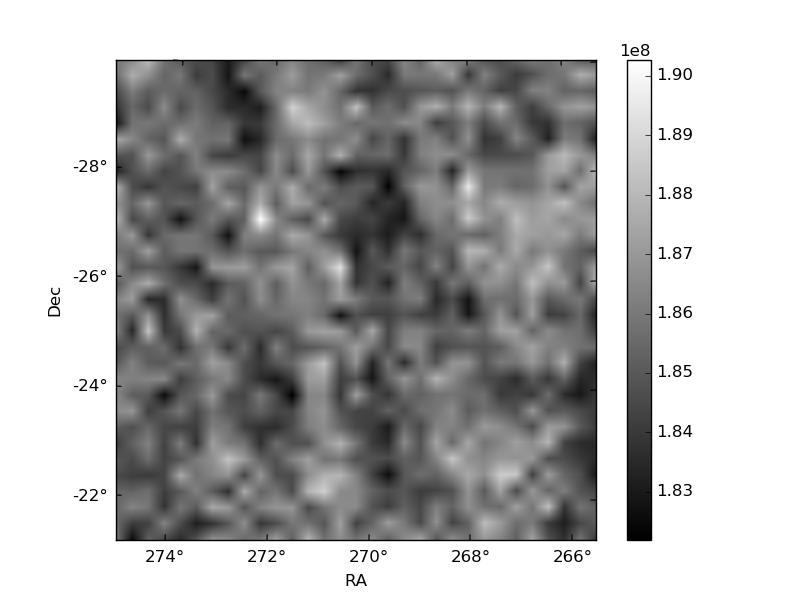
Histogram calculated using DETX and DETY for each event in the final _common_clean file
| Quadrant A | 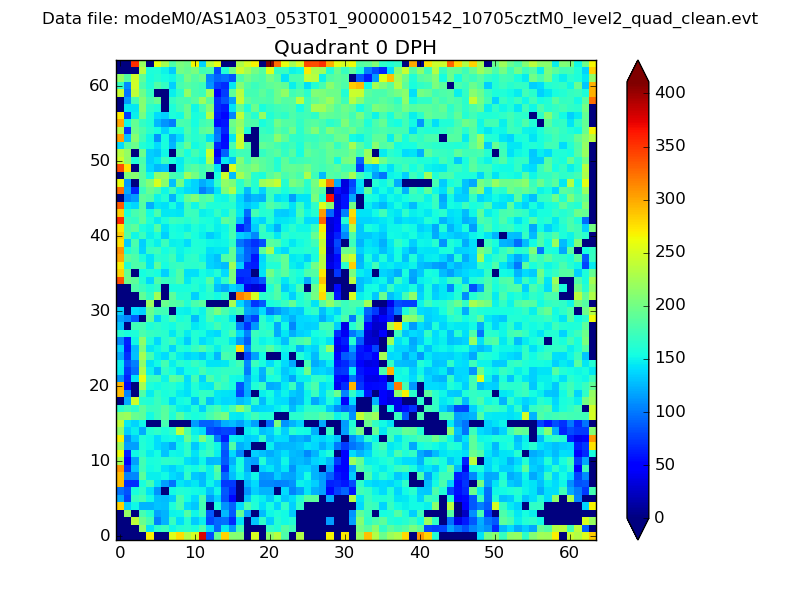 |
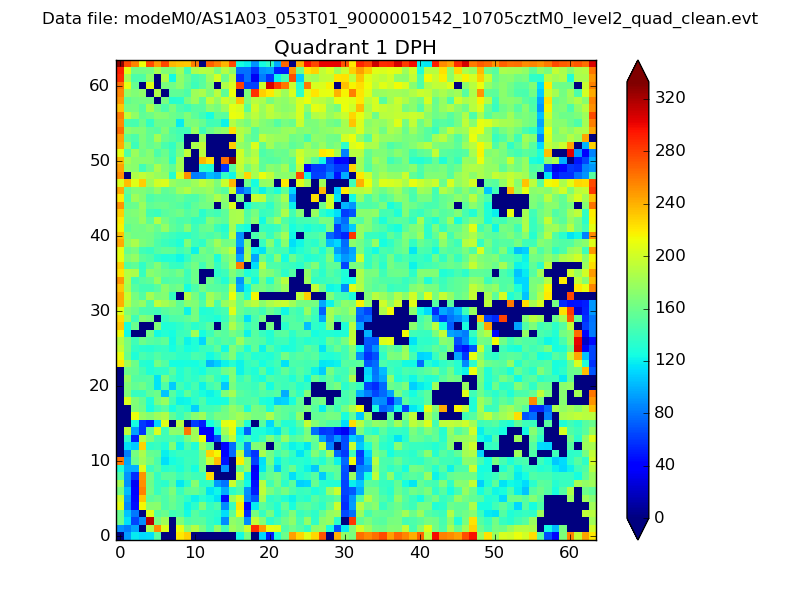 |
Quadrant B |
|---|---|---|---|
| Quadrant D | 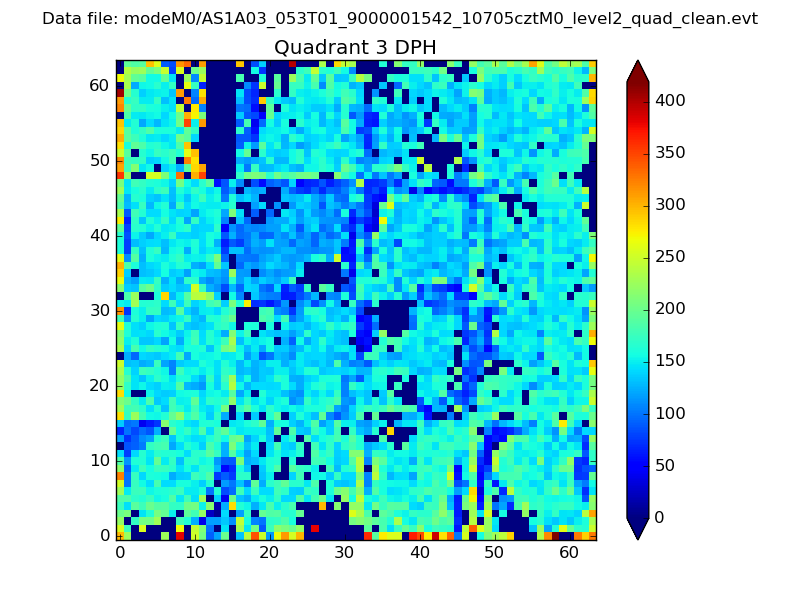 |
 |
Quadrant C |
| Plot type | Count rate plots | Images |
|---|---|---|
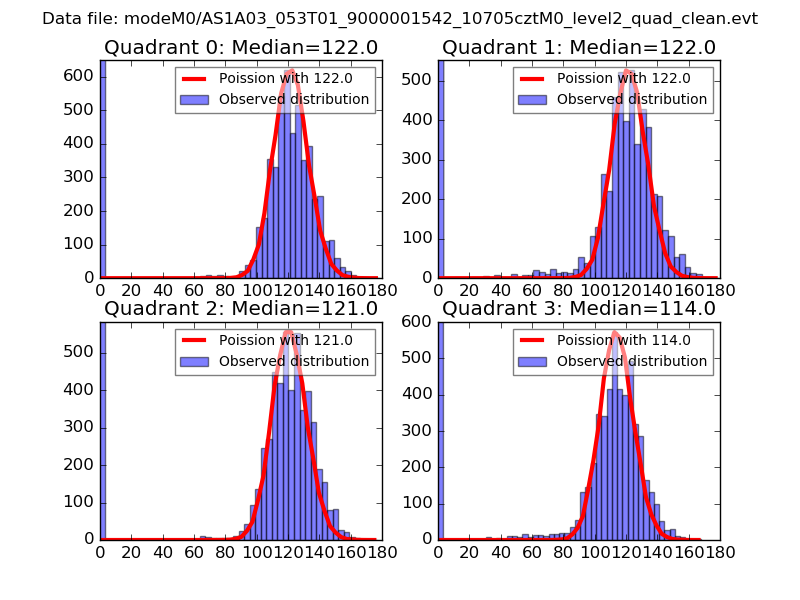
| Comparison with Poisson distribution Blue bars denote a histogram of data divided into 1 sec bins. Red curve is a Poisson curve with rate = median count rate of data. |
 |
 |
| Quadrant-wise count rates Data is divided into 100 sec bins |
 |
|
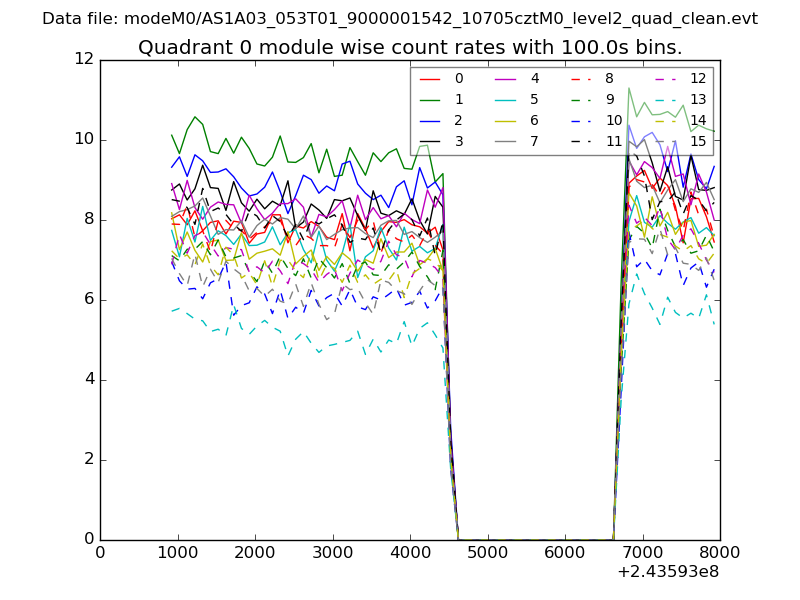
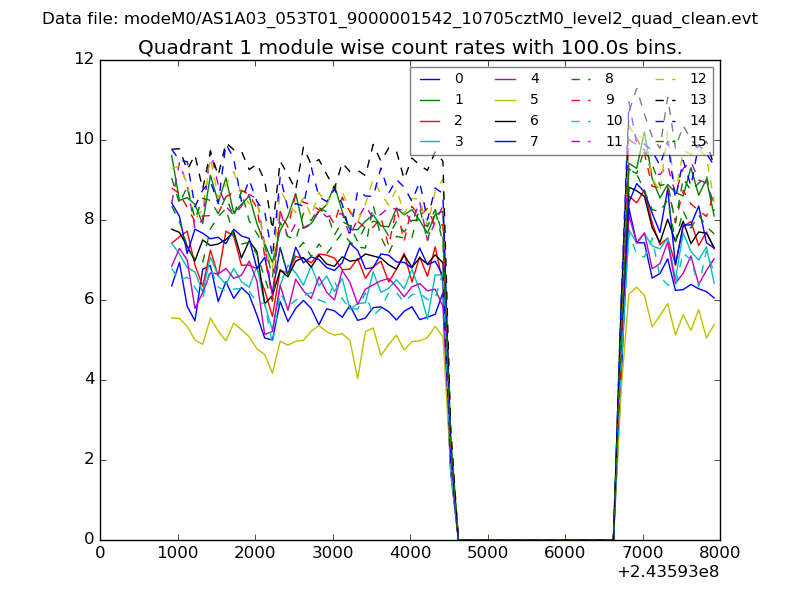
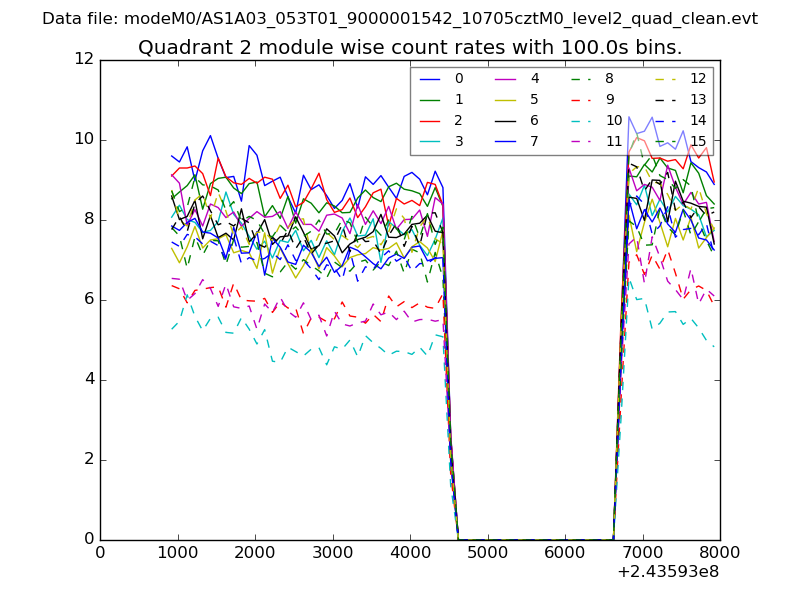
| Module-wise count rates for Quadrant A Data is divided into 100 sec bins |
 |
 |
| Module-wise count rates for Quadrant B Data is divided into 100 sec bins |
 |
 |
| Module-wise count rates for Quadrant C Data is divided into 100 sec bins |
 |
 |
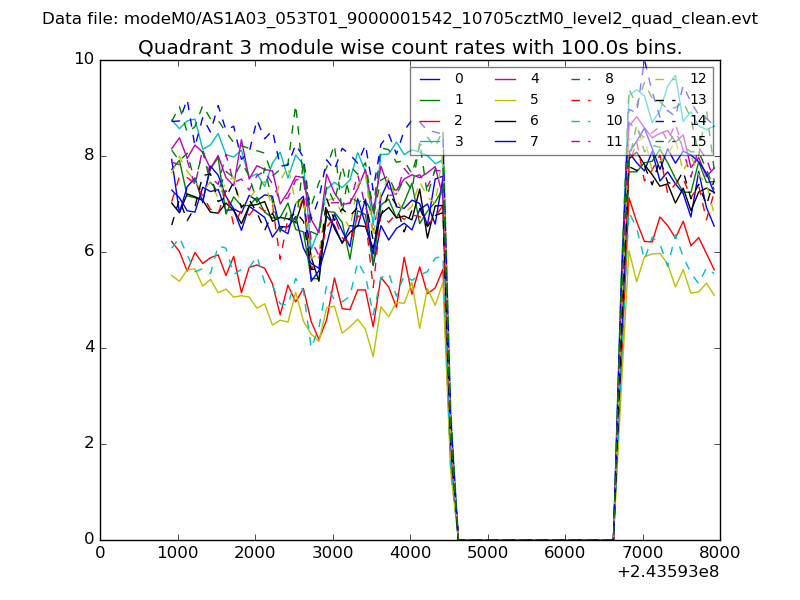
| Module-wise count rates for Quadrant D Data is divided into 100 sec bins |
 |
 |
| Parameter | Plot |
|---|---|
| CZT HV Monitor | 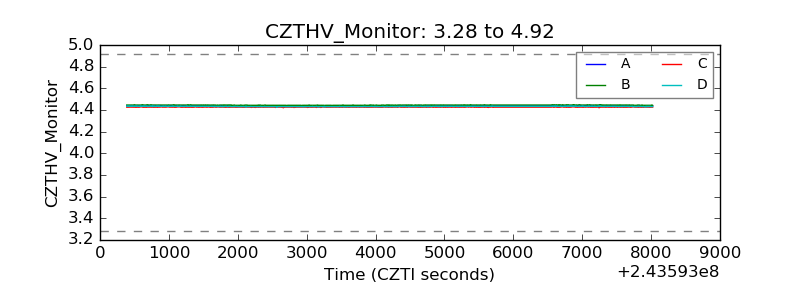 |
| D_VDD | 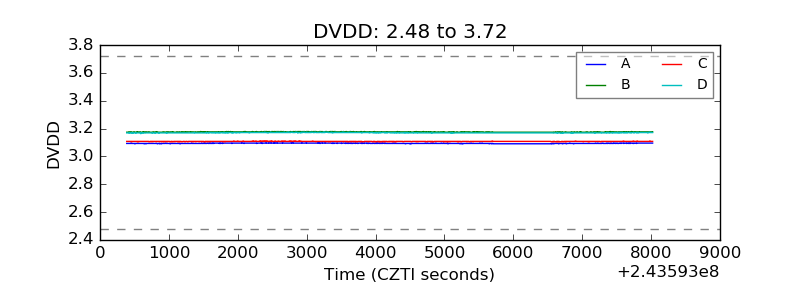 |
| Temperature 1 | 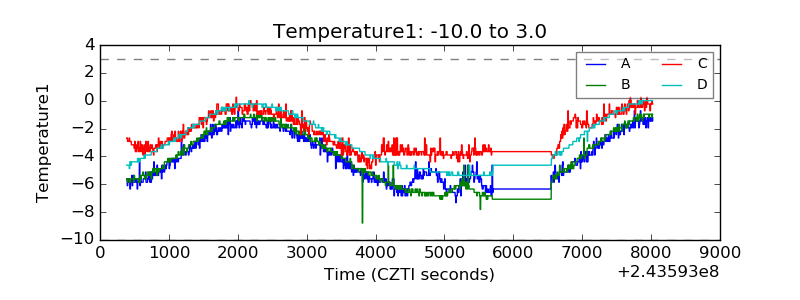 |
| Veto HV Monitor | 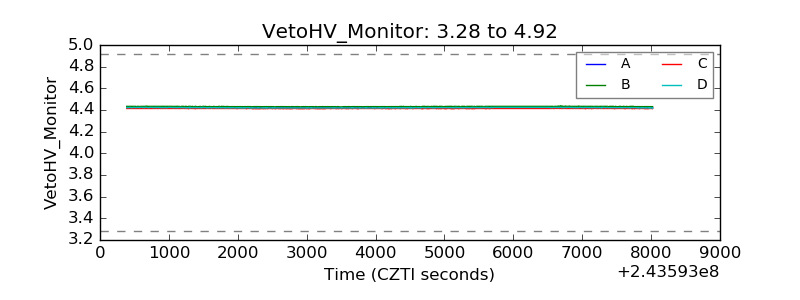 |
| Veto LLD | 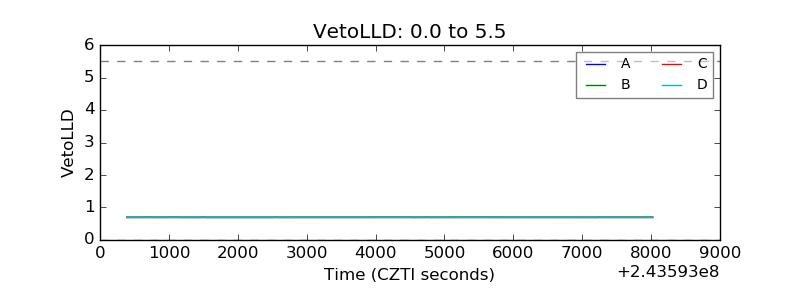 |
| Alpha Counter | 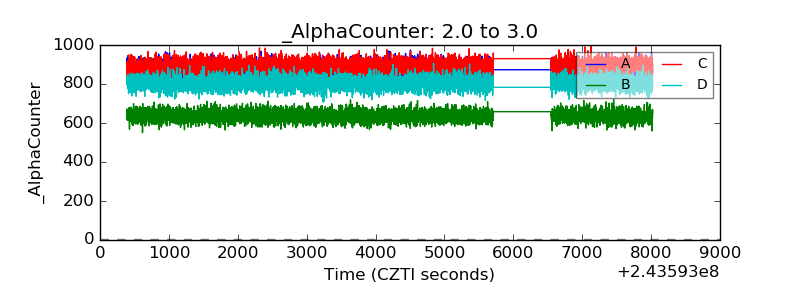 |
| _CPM_Rate | 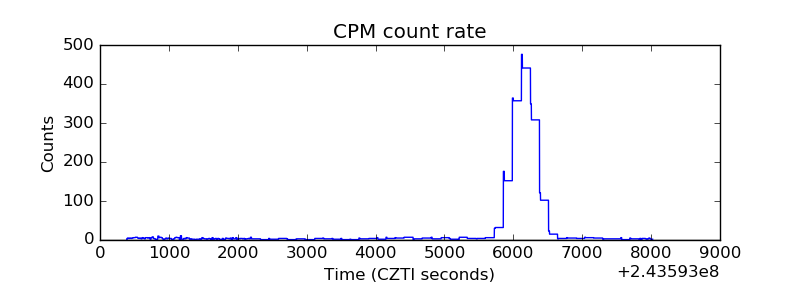 |
| CZT Counter | 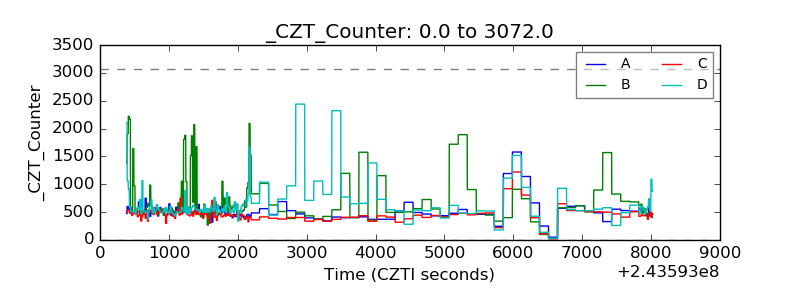 |
| +2.5 Volts monitor | 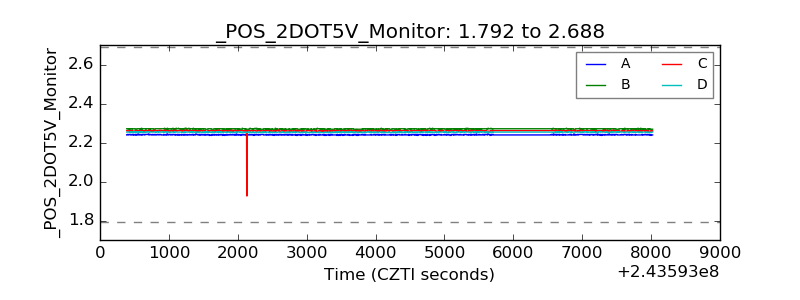 |
| +5 Volts monitor |  |
| _ROLL_ROT |  |
| _Roll_DEC | 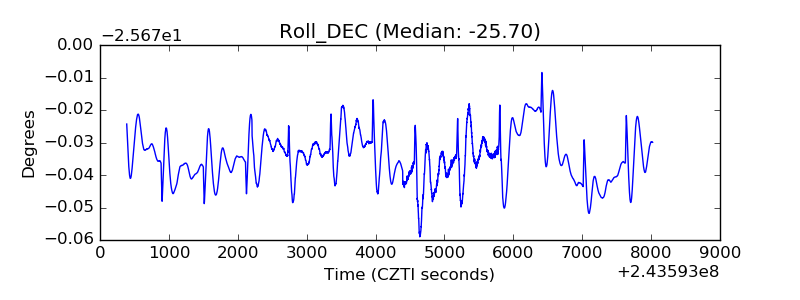 |
| _Roll_RA | 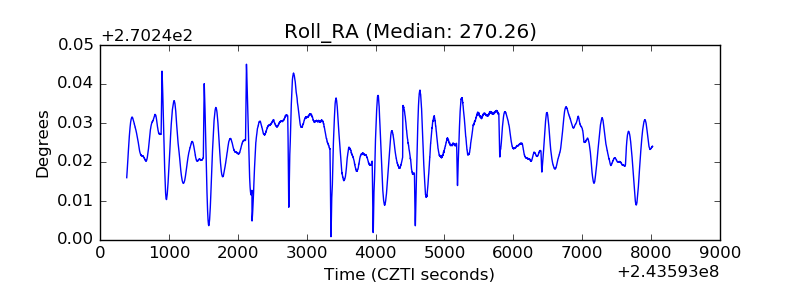 |
| Veto Counter | 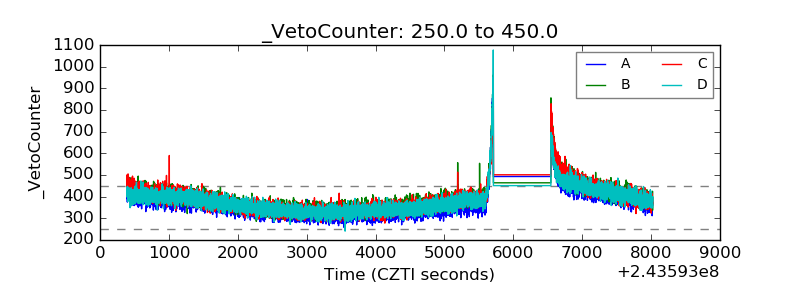 |