| Param | Original file | Final file |
|---|---|---|
| Filename | modeM0/AS1A03_053T01_9000001542_10709cztM0_level2.evt | modeM0/AS1A03_053T01_9000001542_10709cztM0_level2_quad_clean.evt |
| Size (bytes) | 544,484,160 | 79,822,080 |
| Size | 519.3 MB | 76.1 MB |
| Events in quadrant A | 2,988,241 | 527,948 |
| Events in quadrant B | 4,414,654 | 510,056 |
| Events in quadrant C | 3,064,964 | 508,821 |
| Events in quadrant D | 5,627,037 | 462,616 |
| Mode M0 | |||
|---|---|---|---|
| Quadrant | BADHDUFLAG | Total packets | Discarded packets |
| A | 0 | 12698 | 2 |
| B | 0 | 16935 | 1 |
| C | 0 | 13182 | 1 |
| D | 0 | 20601 | 1 |
| Mode M9 | |||
|---|---|---|---|
| Quadrant | BADHDUFLAG | Total packets | Discarded packets |
| A | 0 | 12 | 0 |
| B | 0 | 12 | 0 |
| C | 0 | 12 | 0 |
| D | 0 | 12 | 0 |
| Mode SS | |||
|---|---|---|---|
| Quadrant | BADHDUFLAG | Total packets | Discarded packets |
| A | 0 | 120 | 0 |
| B | 0 | 120 | 0 |
| C | 0 | 120 | 0 |
| D | 0 | 120 | 0 |
| Quadrant | Total seconds | Saturated seconds | Saturation percentage |
|---|---|---|---|
| A | 5824 | 95 | 1.631181% |
| B | 5824 | 448 | 7.692308% |
| C | 5824 | 162 | 2.781593% |
| D | 5824 | 447 | 7.675137% |
Noise dominated data is calculated using 1-second bins in cleaned event files. If a bin has >2000 counts, and if more than 50% of those come from <1% of pixels, then it is considered to be noise-dominated and hence unusable.
| Quadrant | # 1 sec bins | Bins with >0 counts | Bins with >2000 counts | High rate bins dominated by noise | Noise dominated (total time) | Noise dominated (detector-on time) | Marked lightcurve |
|---|---|---|---|---|---|---|---|
| A | 7059 | 5825 | 34 | 34 | 0.48% | 0.58% | 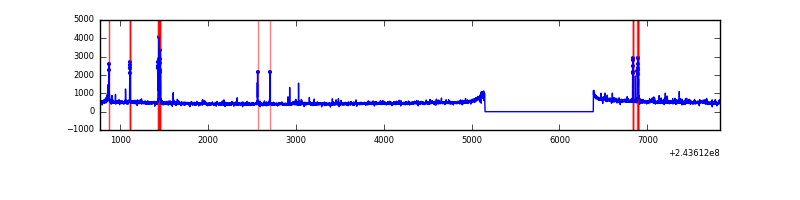 |
| B | 7059 | 5825 | 289 | 289 | 4.09% | 4.96% | 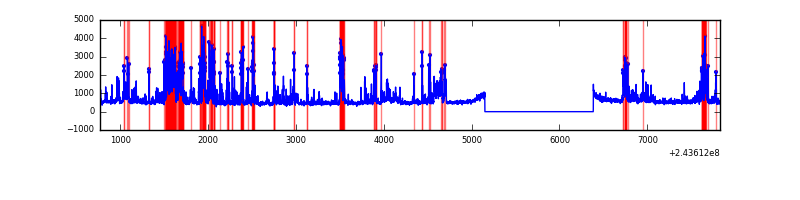 |
| C | 7059 | 5825 | 97 | 97 | 1.37% | 1.67% | 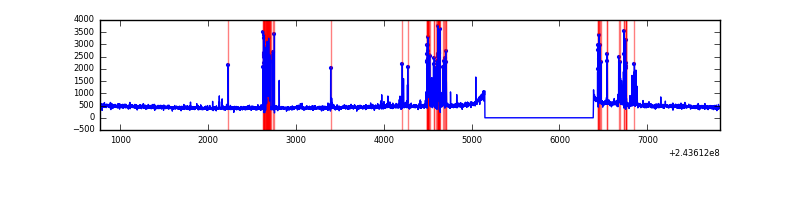 |
| D | 7059 | 5825 | 562 | 562 | 7.96% | 9.65% | 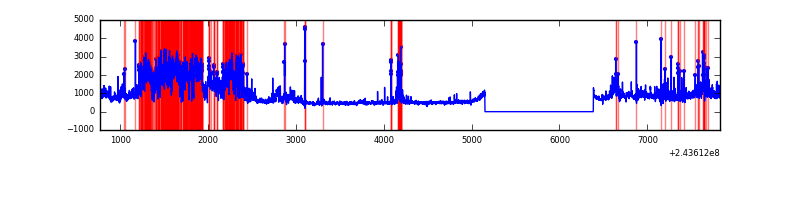 |
Top three noisy pixels from each quadrant. If the there are fewer than three noisy pixels in the level2.evt file, extra rows are filled as -1
| Pixel properties | Quadrant properties | ||||||
|---|---|---|---|---|---|---|---|
| Quadrant | DetID | PixID | Counts | Sigma | Mean | Median | Sigma |
| A | 15 | 174 | 147691 | 1012.41 | 717 | 705 | 145.2 |
| A | 1 | 162 | 33261 | 224.24 | 717 | 705 | 145.2 |
| A | 1 | 178 | 10783 | 69.42 | 717 | 705 | 145.2 |
| B | 4 | 239 | 1554247 | 11684.89 | 701 | 687 | 133.0 |
| B | 15 | 204 | 66211 | 492.83 | 701 | 687 | 133.0 |
| B | 0 | 214 | 21583 | 157.17 | 701 | 687 | 133.0 |
| C | 4 | 254 | 412346 | 2627.18 | 677 | 682 | 156.7 |
| C | 14 | 234 | 5748 | 32.33 | 677 | 682 | 156.7 |
| C | 13 | 61 | 5069 | 27.99 | 677 | 682 | 156.7 |
| D | 2 | 16 | 2110803 | 13148.29 | 669 | 648 | 160.5 |
| D | 8 | 195 | 287981 | 1790.36 | 669 | 648 | 160.5 |
| D | 7 | 71 | 220276 | 1368.49 | 669 | 648 | 160.5 |
Histogram calculated using DETX and DETY for each event in the final _common_clean file
| Quadrant A | 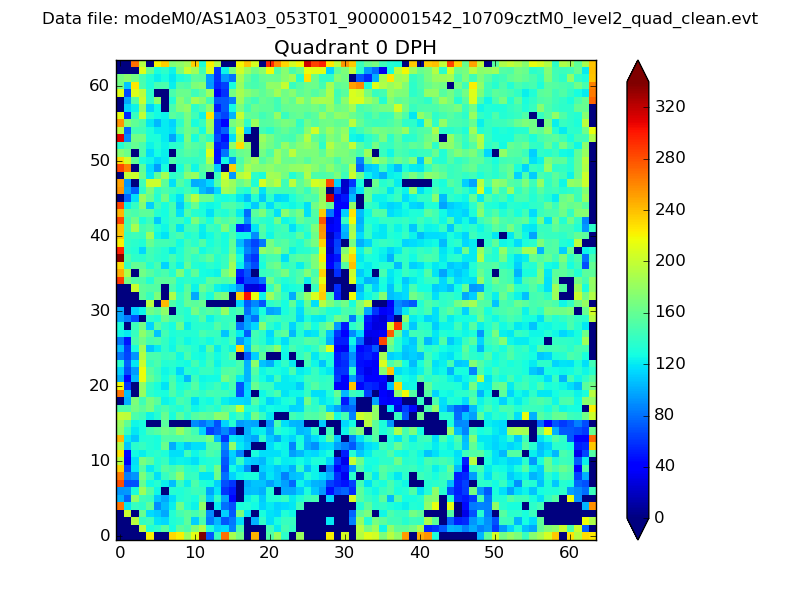 |
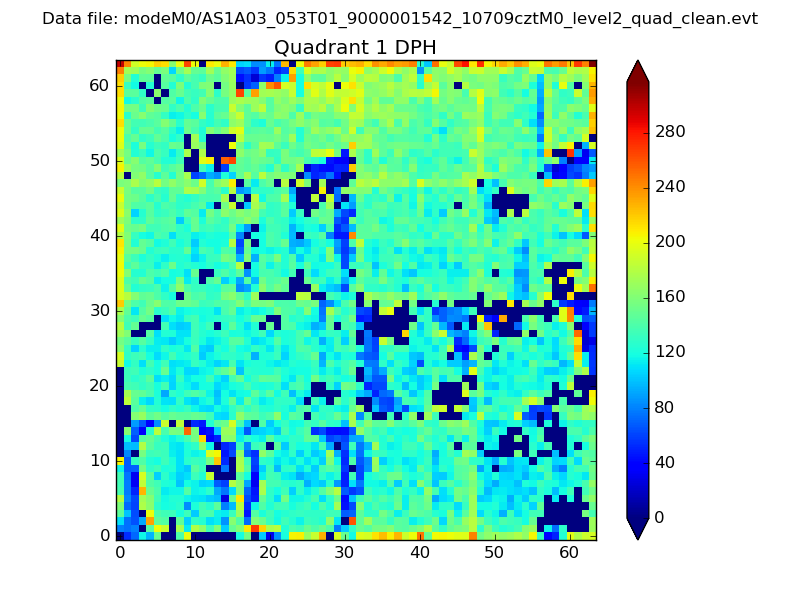 |
Quadrant B |
|---|---|---|---|
| Quadrant D | 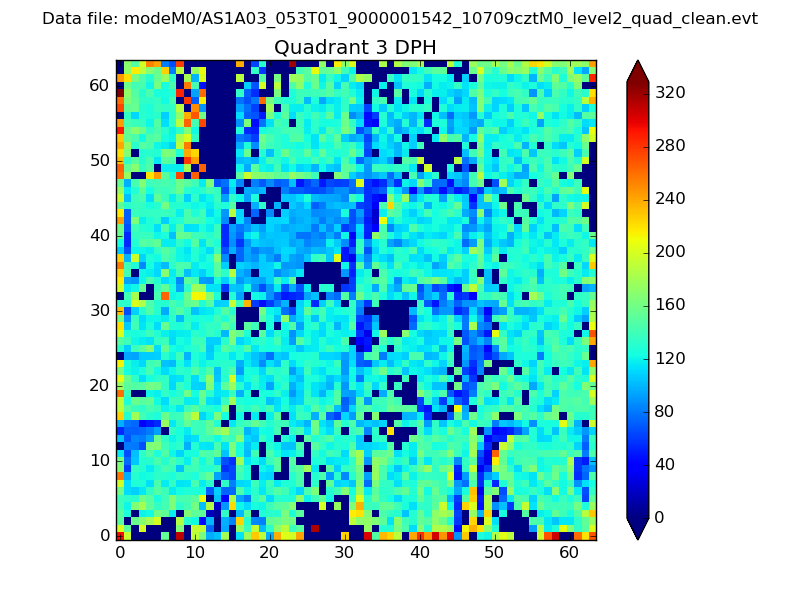 |
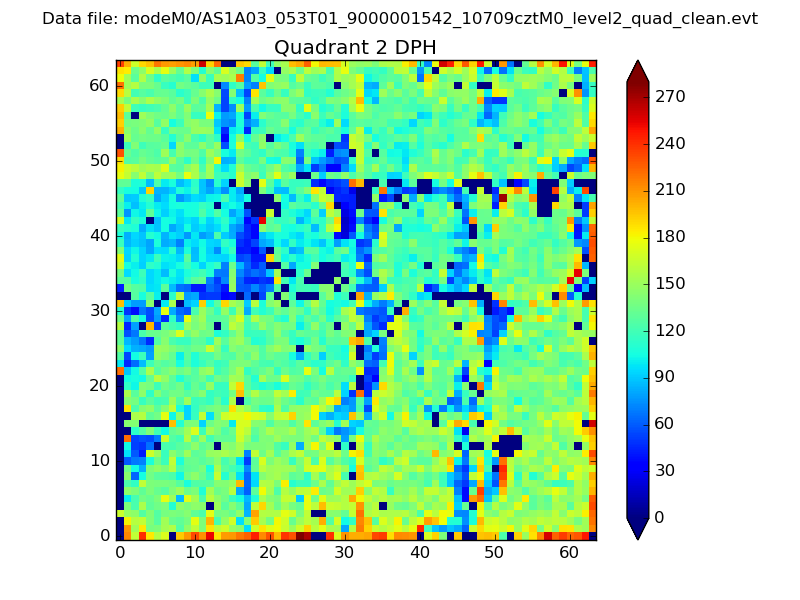 |
Quadrant C |
| Plot type | Count rate plots | Images |
|---|---|---|
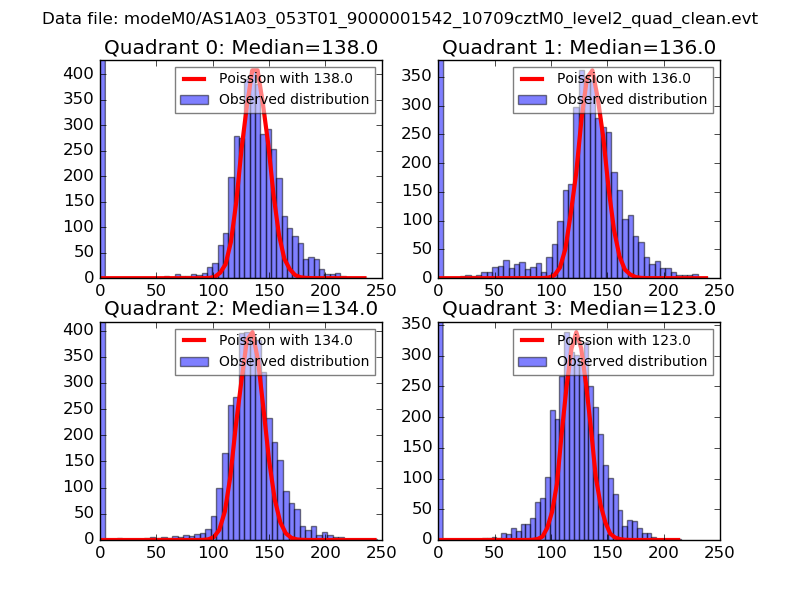
| Comparison with Poisson distribution Blue bars denote a histogram of data divided into 1 sec bins. Red curve is a Poisson curve with rate = median count rate of data. |
 |
 |
| Quadrant-wise count rates Data is divided into 100 sec bins |
 |
|
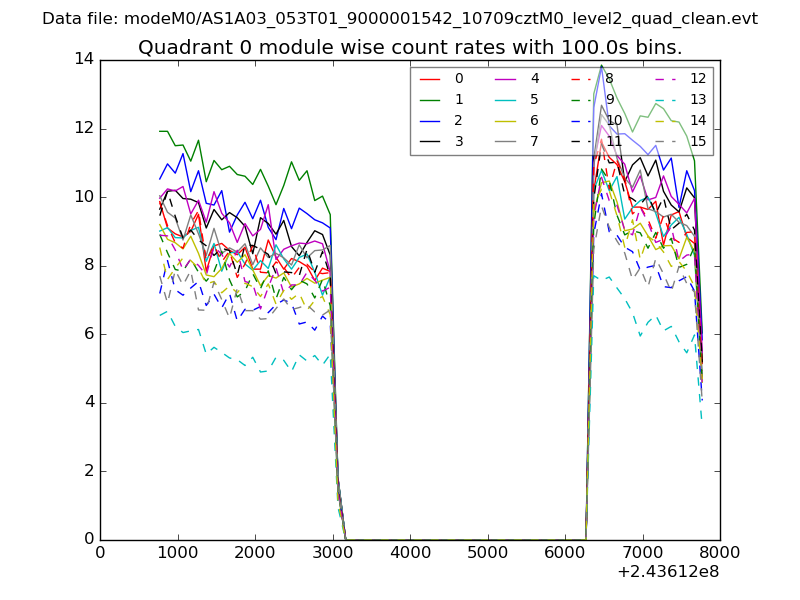
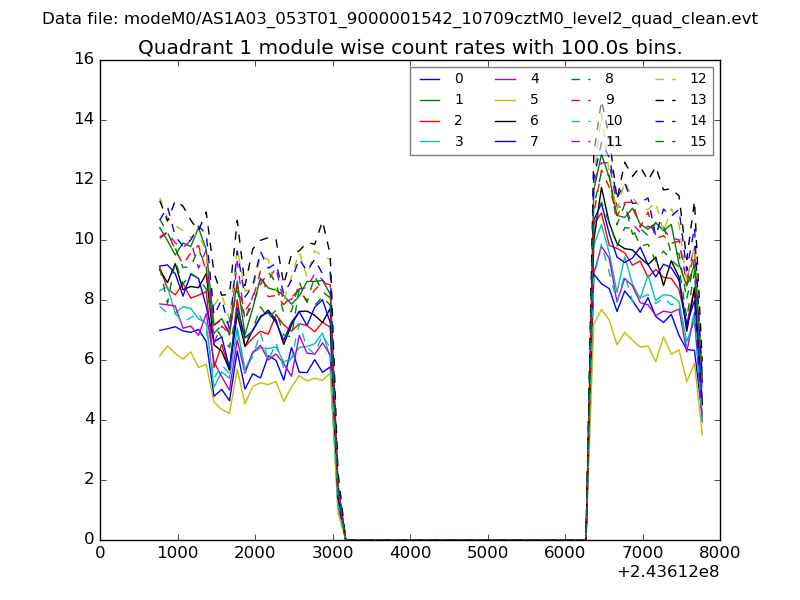
| Module-wise count rates for Quadrant A Data is divided into 100 sec bins |
 |
 |
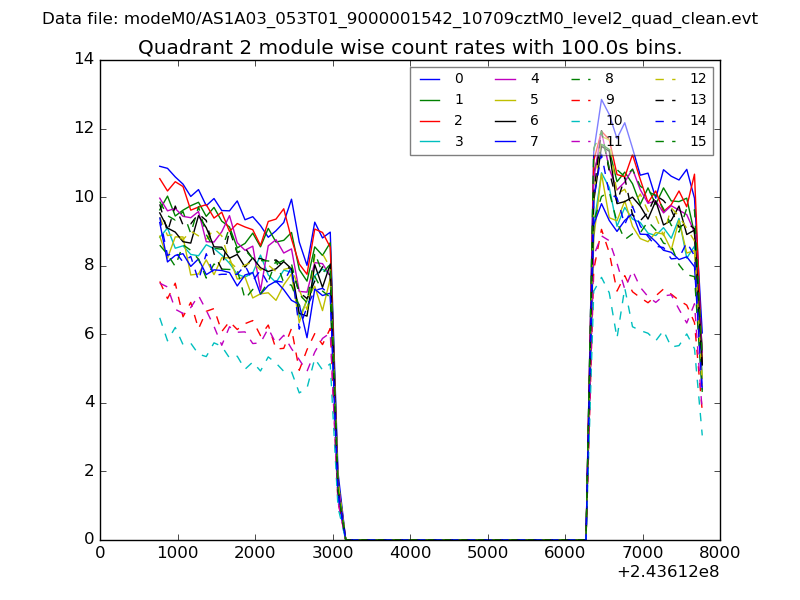
| Module-wise count rates for Quadrant B Data is divided into 100 sec bins |
 |
 |
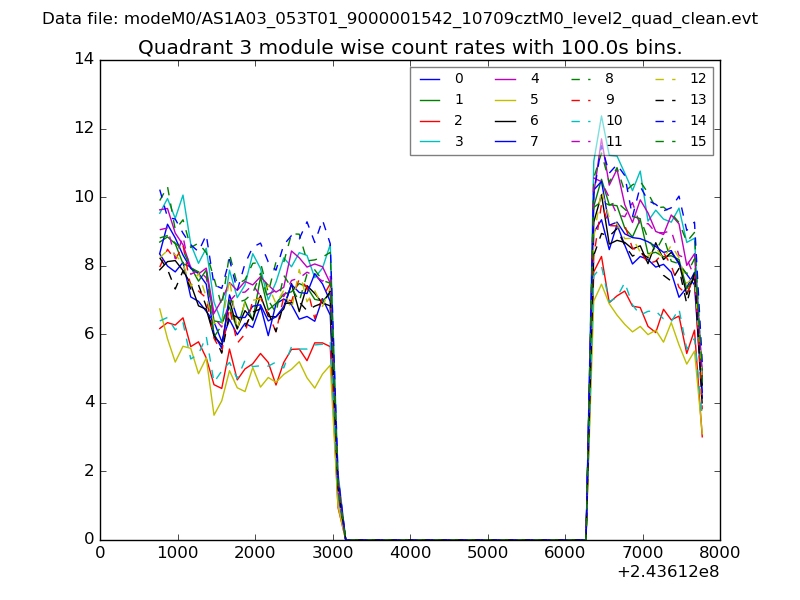
| Module-wise count rates for Quadrant C Data is divided into 100 sec bins |
 |
 |
| Module-wise count rates for Quadrant D Data is divided into 100 sec bins |
 |
 |
| Parameter | Plot |
|---|---|
| CZT HV Monitor |  |
| D_VDD | 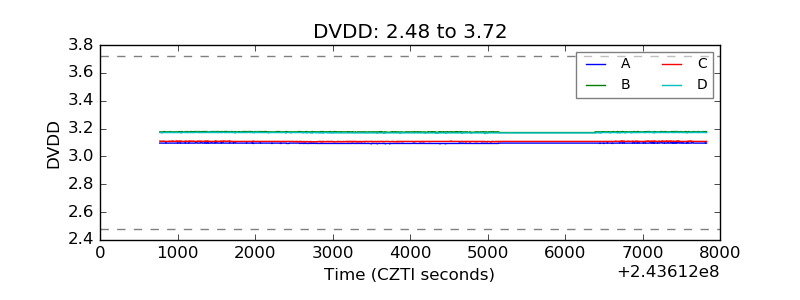 |
| Temperature 1 | 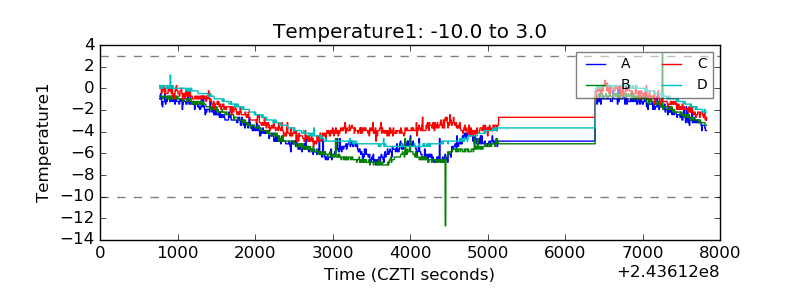 |
| Veto HV Monitor | 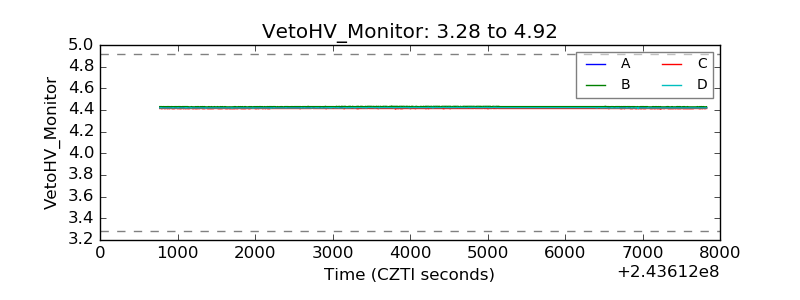 |
| Veto LLD | 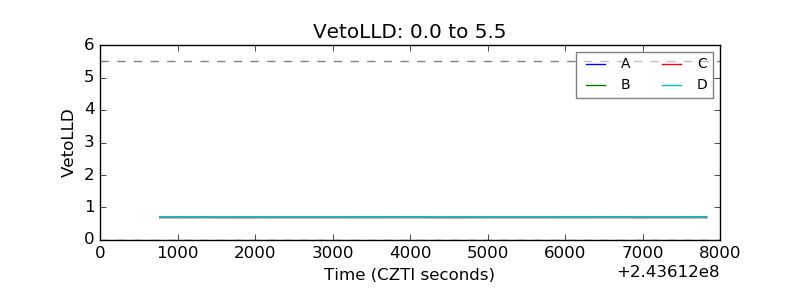 |
| Alpha Counter |  |
| _CPM_Rate | 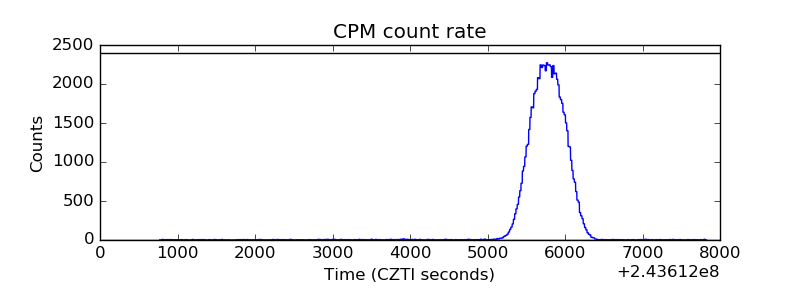 |
| CZT Counter | 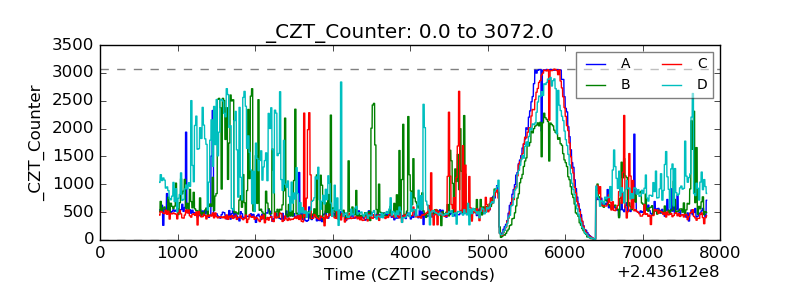 |
| +2.5 Volts monitor | 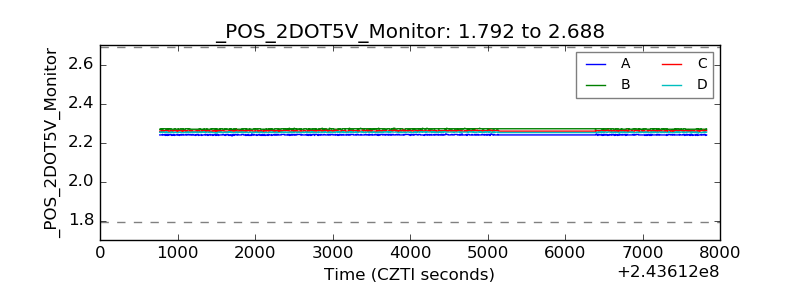 |
| +5 Volts monitor |  |
| _ROLL_ROT | 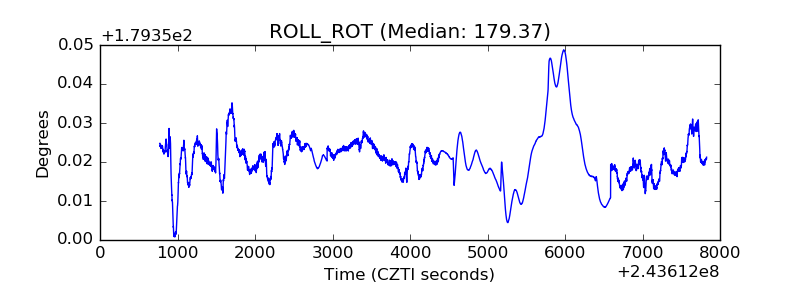 |
| _Roll_DEC | 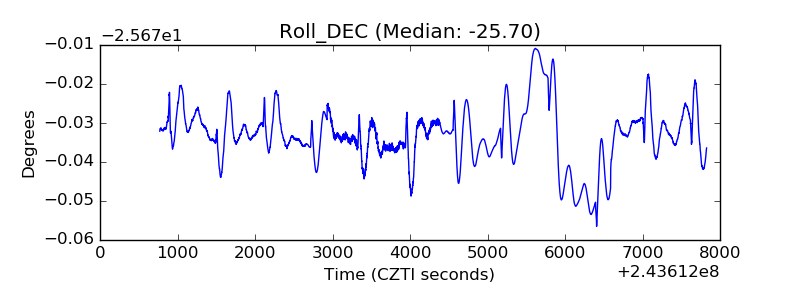 |
| _Roll_RA | 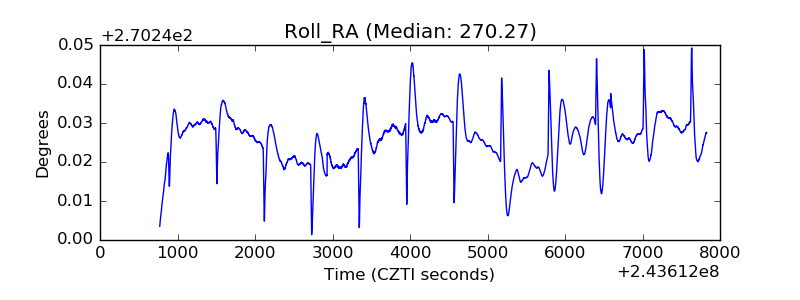 |
| Veto Counter | 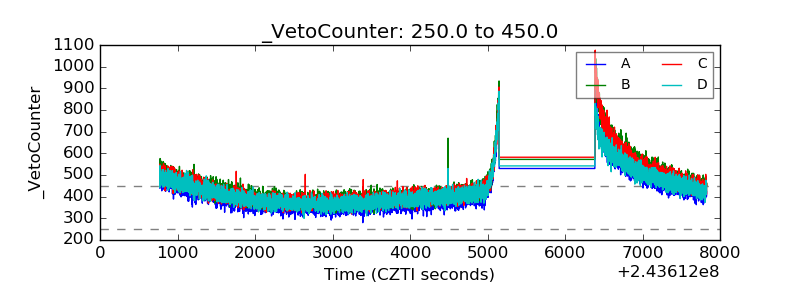 |