| Param | Original file | Final file |
|---|---|---|
| Filename | modeM0/AS1A03_053T01_9000001542_10711cztM0_level2.evt | modeM0/AS1A03_053T01_9000001542_10711cztM0_level2_quad_clean.evt |
| Size (bytes) | 531,109,440 | 89,501,760 |
| Size | 506.5 MB | 85.4 MB |
| Events in quadrant A | 3,145,617 | 588,968 |
| Events in quadrant B | 5,123,368 | 569,139 |
| Events in quadrant C | 3,390,926 | 578,297 |
| Events in quadrant D | 3,997,173 | 533,829 |
| Mode M0 | |||
|---|---|---|---|
| Quadrant | BADHDUFLAG | Total packets | Discarded packets |
| A | 0 | 13432 | 3 |
| B | 0 | 19310 | 2 |
| C | 0 | 14286 | 2 |
| D | 0 | 16002 | 2 |
| Mode M9 | |||
|---|---|---|---|
| Quadrant | BADHDUFLAG | Total packets | Discarded packets |
| A | 0 | 20 | 0 |
| B | 0 | 20 | 0 |
| C | 0 | 20 | 0 |
| D | 0 | 21 | 0 |
| Mode SS | |||
|---|---|---|---|
| Quadrant | BADHDUFLAG | Total packets | Discarded packets |
| A | 0 | 128 | 0 |
| B | 0 | 128 | 0 |
| C | 0 | 128 | 0 |
| D | 0 | 128 | 0 |
| Quadrant | Total seconds | Saturated seconds | Saturation percentage |
|---|---|---|---|
| A | 6304 | 76 | 1.205584% |
| B | 6304 | 591 | 9.375000% |
| C | 6304 | 143 | 2.268401% |
| D | 6304 | 185 | 2.934645% |
Noise dominated data is calculated using 1-second bins in cleaned event files. If a bin has >2000 counts, and if more than 50% of those come from <1% of pixels, then it is considered to be noise-dominated and hence unusable.
| Quadrant | # 1 sec bins | Bins with >0 counts | Bins with >2000 counts | High rate bins dominated by noise | Noise dominated (total time) | Noise dominated (detector-on time) | Marked lightcurve |
|---|---|---|---|---|---|---|---|
| A | 7604 | 6306 | 12 | 12 | 0.16% | 0.19% | 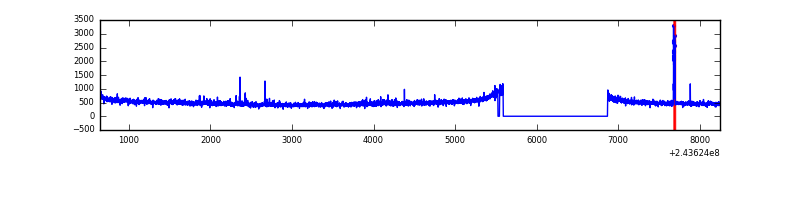 |
| B | 7604 | 6306 | 366 | 366 | 4.81% | 5.80% | 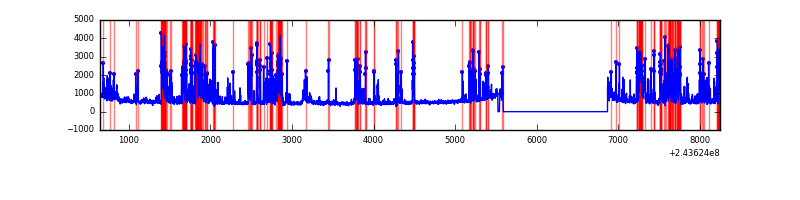 |
| C | 7604 | 6306 | 62 | 62 | 0.82% | 0.98% |  |
| D | 7604 | 6306 | 134 | 134 | 1.76% | 2.12% | 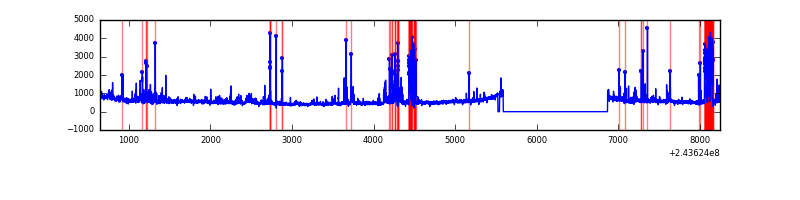 |
Top three noisy pixels from each quadrant. If the there are fewer than three noisy pixels in the level2.evt file, extra rows are filled as -1
| Pixel properties | Quadrant properties | ||||||
|---|---|---|---|---|---|---|---|
| Quadrant | DetID | PixID | Counts | Sigma | Mean | Median | Sigma |
| A | 15 | 174 | 42603 | 260.18 | 788 | 775 | 160.8 |
| A | 1 | 162 | 24614 | 148.28 | 788 | 775 | 160.8 |
| A | 11 | 29 | 14055 | 82.6 | 788 | 775 | 160.8 |
| B | 4 | 239 | 1821893 | 12472.2 | 771 | 754 | 146.0 |
| B | 4 | 81 | 73915 | 501.05 | 771 | 754 | 146.0 |
| B | 15 | 204 | 52163 | 352.08 | 771 | 754 | 146.0 |
| C | 4 | 254 | 442652 | 2526.63 | 755 | 760 | 174.9 |
| C | 13 | 61 | 5824 | 28.95 | 755 | 760 | 174.9 |
| C | 14 | 67 | 4381 | 20.7 | 755 | 760 | 174.9 |
| D | 8 | 195 | 255367 | 1422.99 | 739 | 719 | 179.0 |
| D | 10 | 199 | 244152 | 1360.32 | 739 | 719 | 179.0 |
| D | 12 | 233 | 237415 | 1322.67 | 739 | 719 | 179.0 |
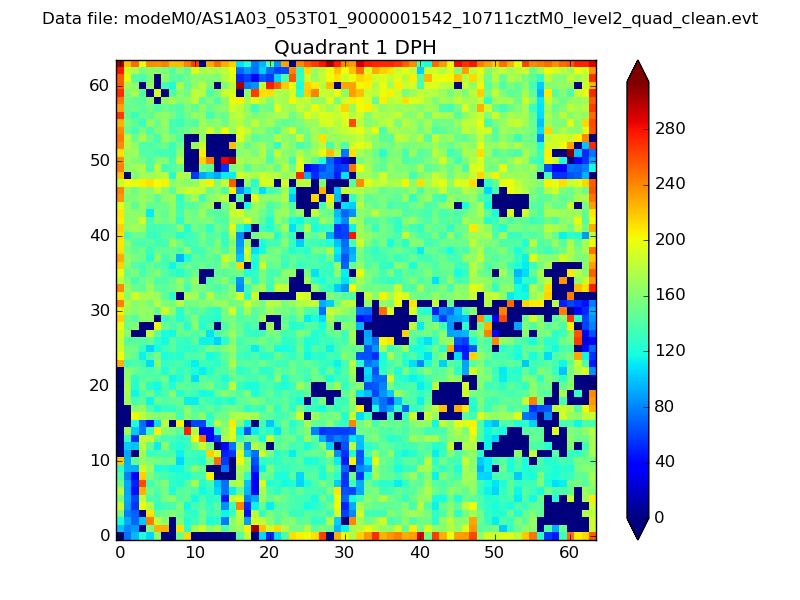
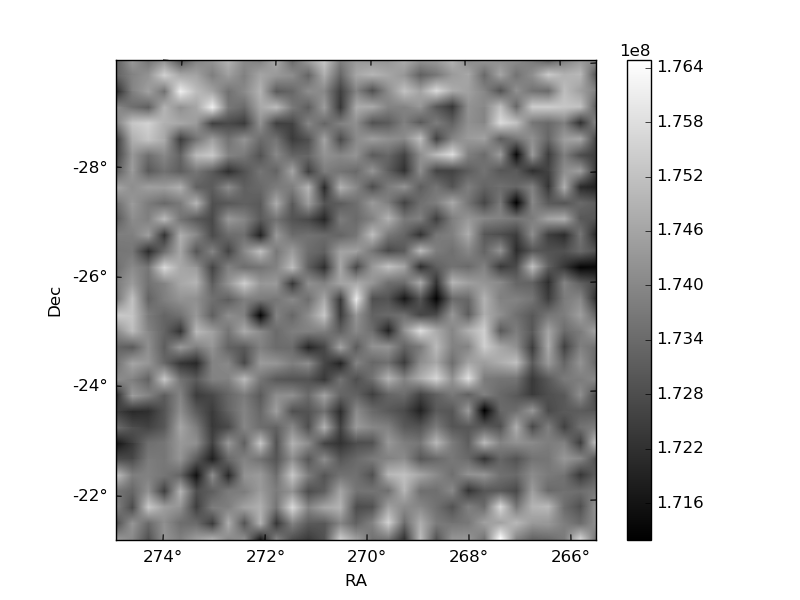
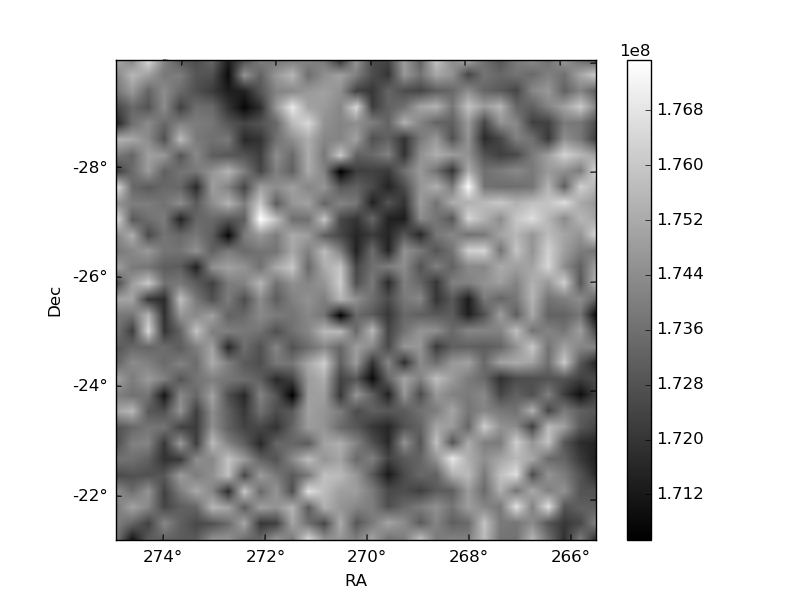
Histogram calculated using DETX and DETY for each event in the final _common_clean file
| Quadrant A | 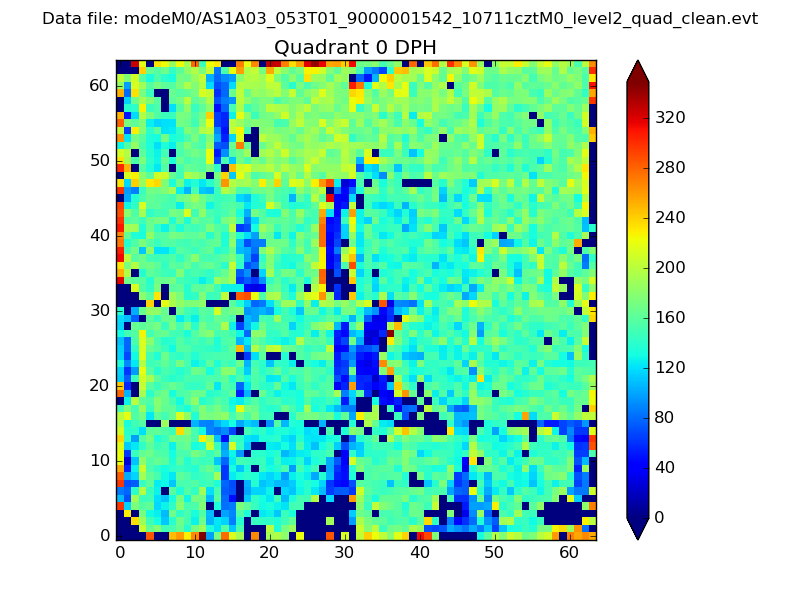 |
 |
Quadrant B |
|---|---|---|---|
| Quadrant D | 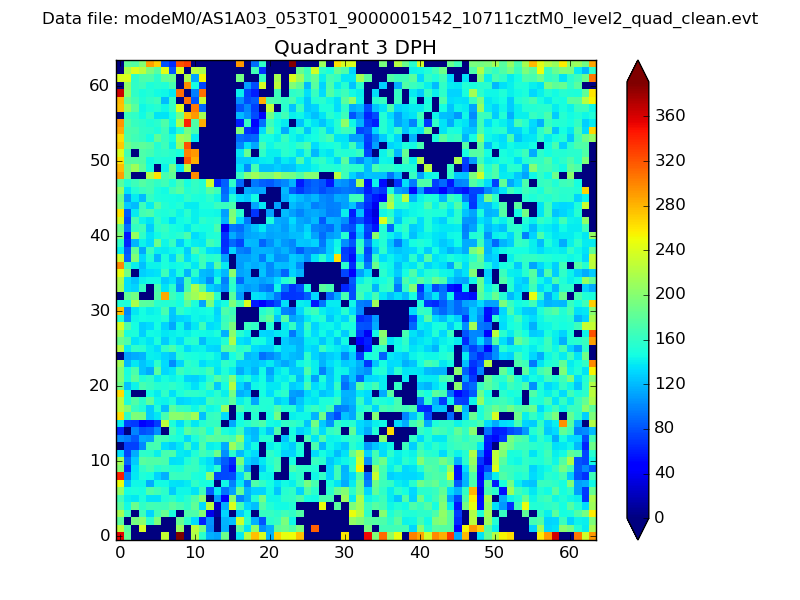 |
 |
Quadrant C |
| Plot type | Count rate plots | Images |
|---|---|---|
| Comparison with Poisson distribution Blue bars denote a histogram of data divided into 1 sec bins. Red curve is a Poisson curve with rate = median count rate of data. |
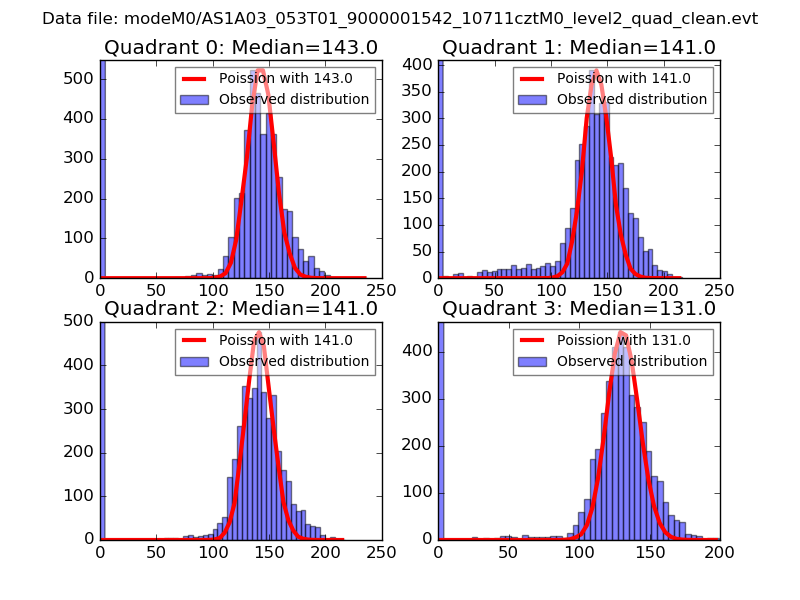 |
 |
| Quadrant-wise count rates Data is divided into 100 sec bins |
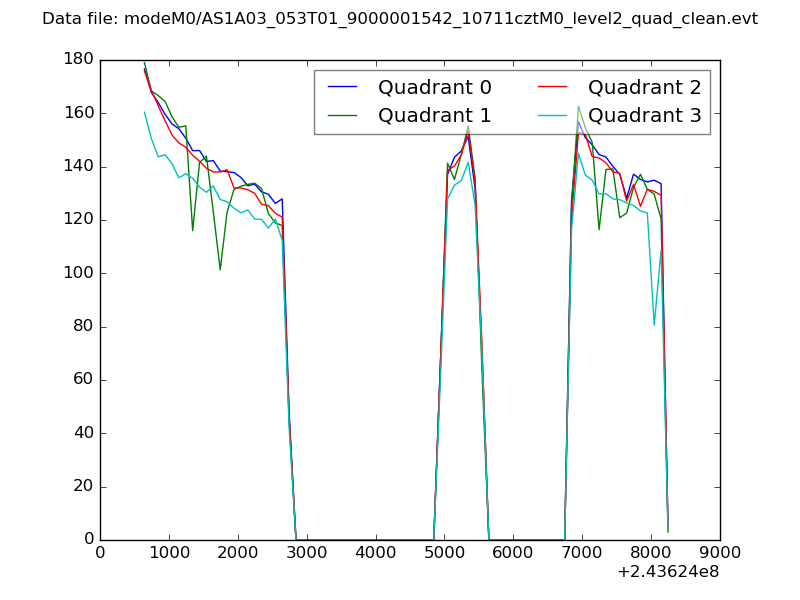 |
|
| Module-wise count rates for Quadrant A Data is divided into 100 sec bins |
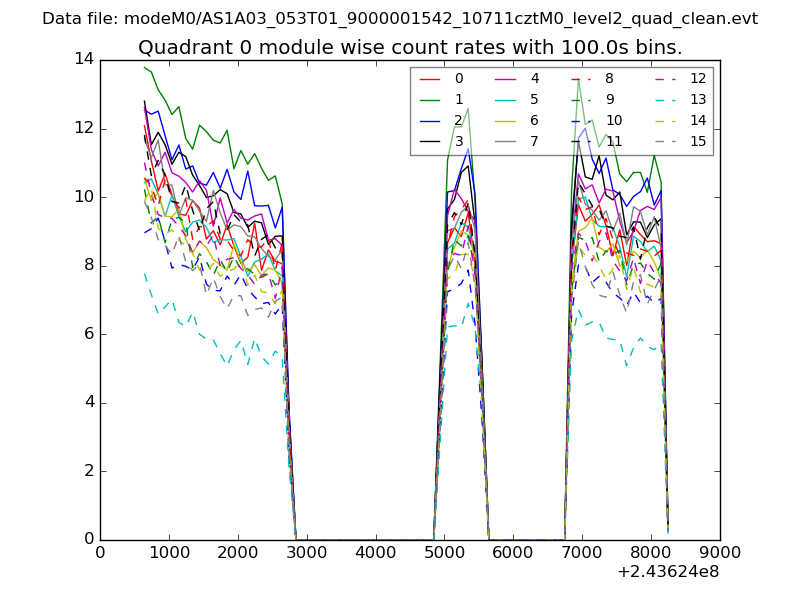 |
 |
| Module-wise count rates for Quadrant B Data is divided into 100 sec bins |
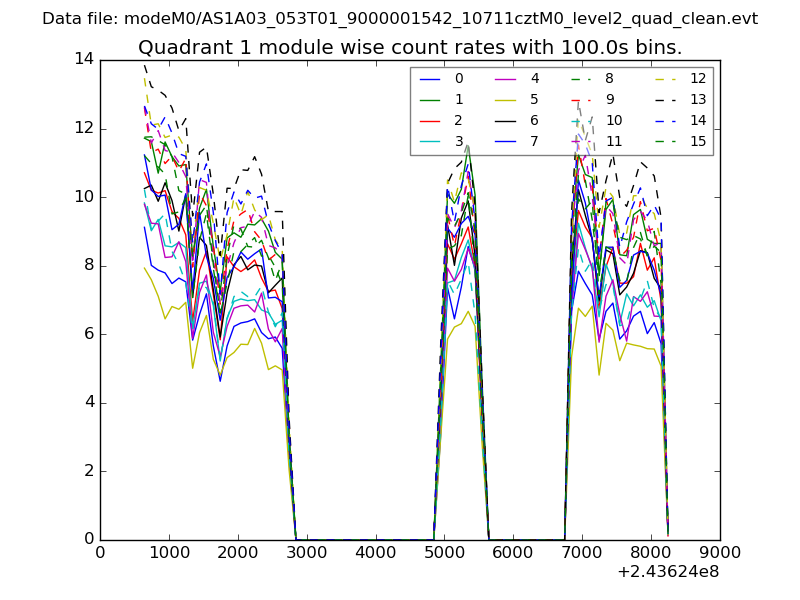 |
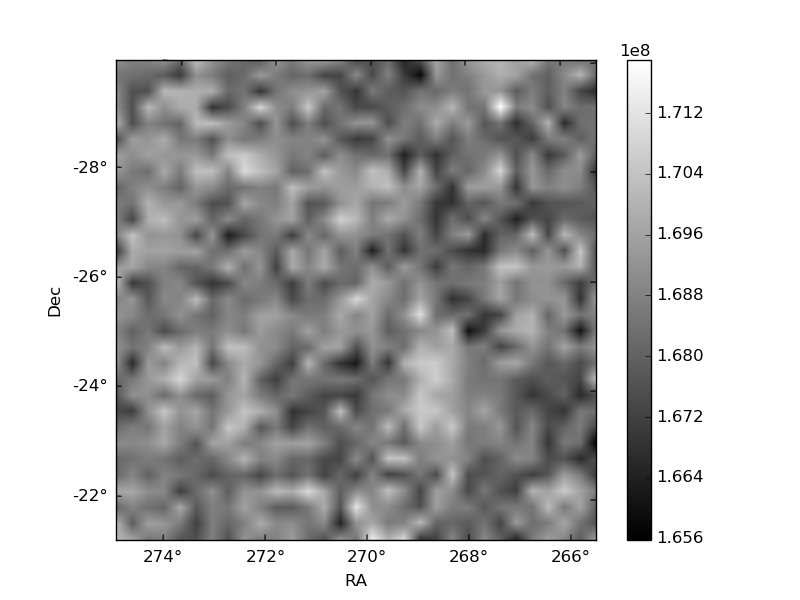 |
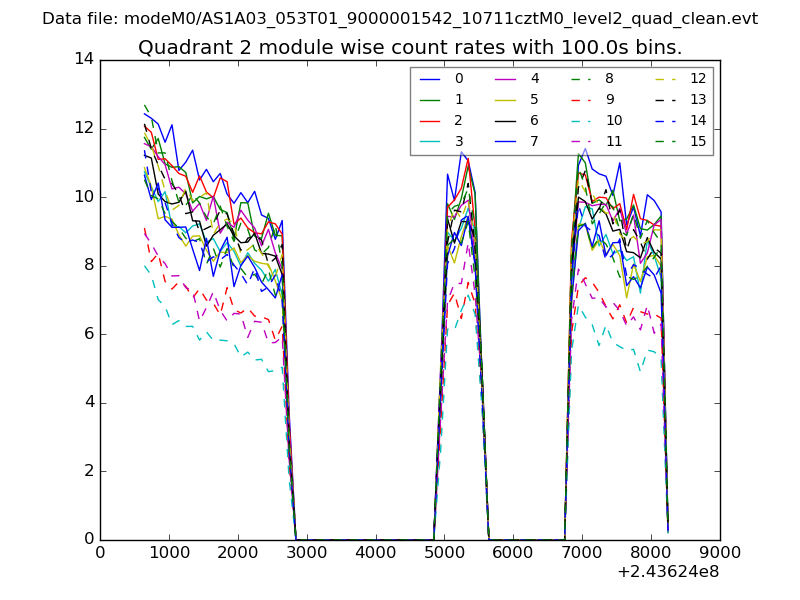
| Module-wise count rates for Quadrant C Data is divided into 100 sec bins |
 |
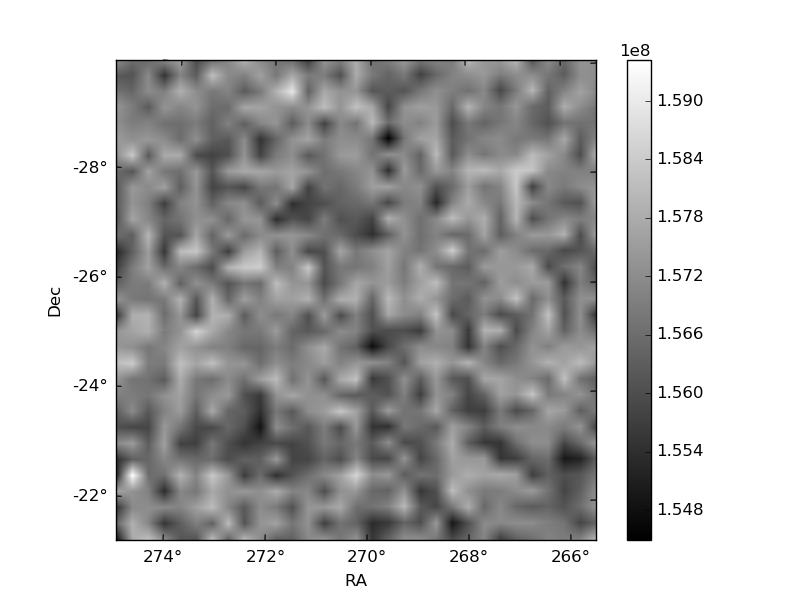 |
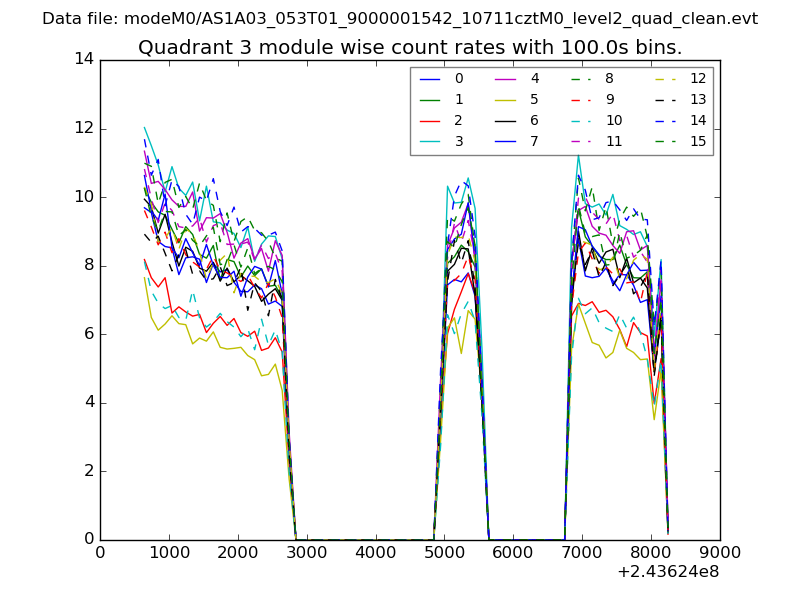
| Module-wise count rates for Quadrant D Data is divided into 100 sec bins |
 |
 |
| Parameter | Plot |
|---|---|
| CZT HV Monitor | 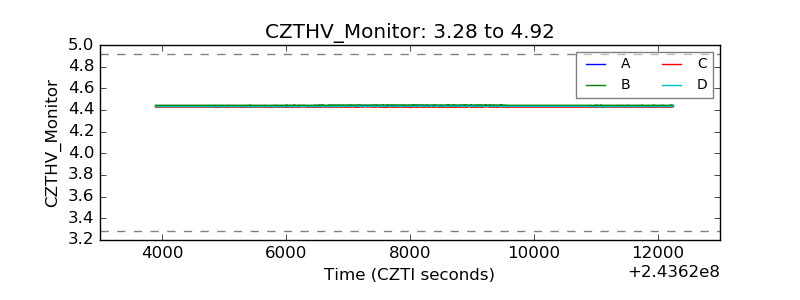 |
| D_VDD | 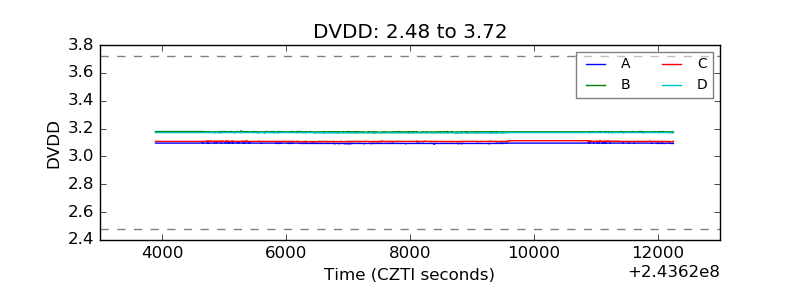 |
| Temperature 1 | 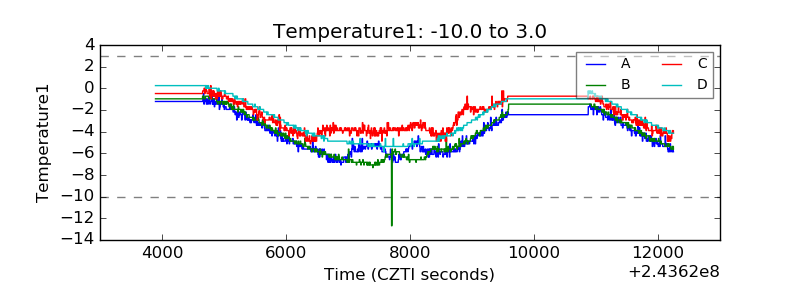 |
| Veto HV Monitor | 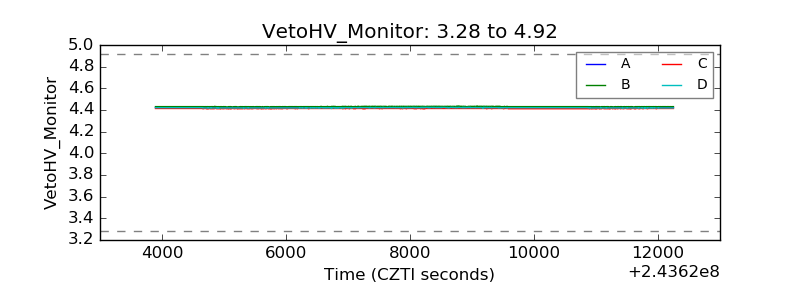 |
| Veto LLD | 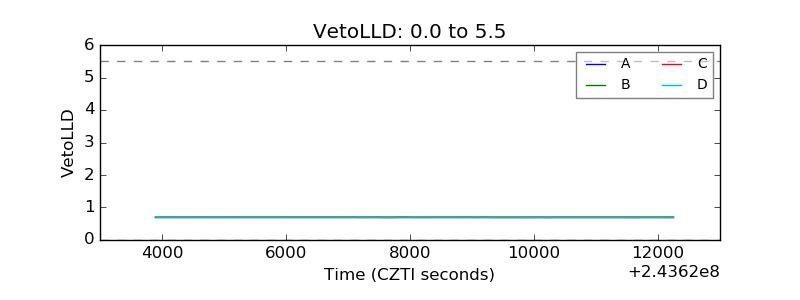 |
| Alpha Counter | 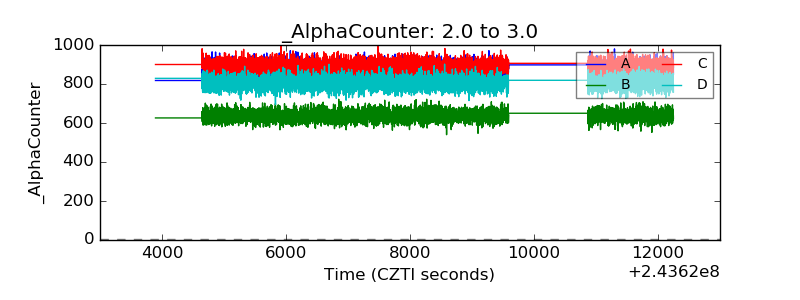 |
| _CPM_Rate | 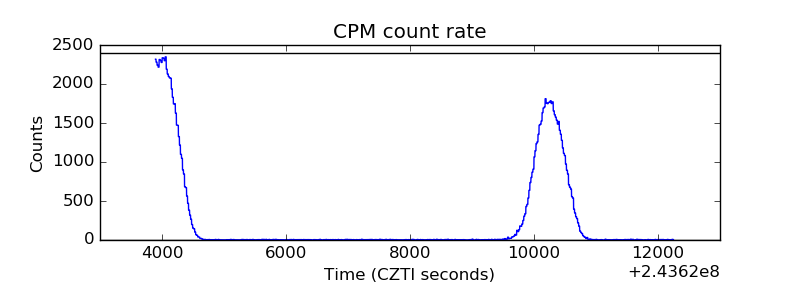 |
| CZT Counter | 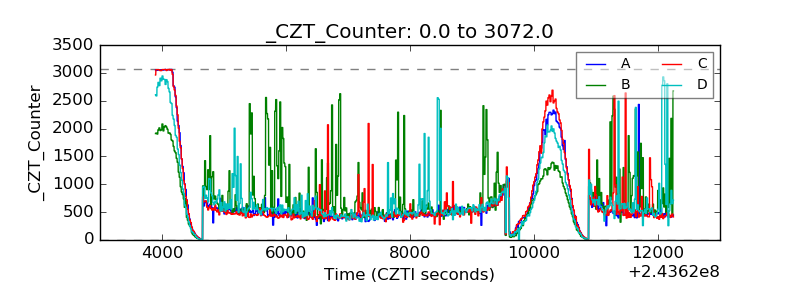 |
| +2.5 Volts monitor |  |
| +5 Volts monitor |  |
| _ROLL_ROT | 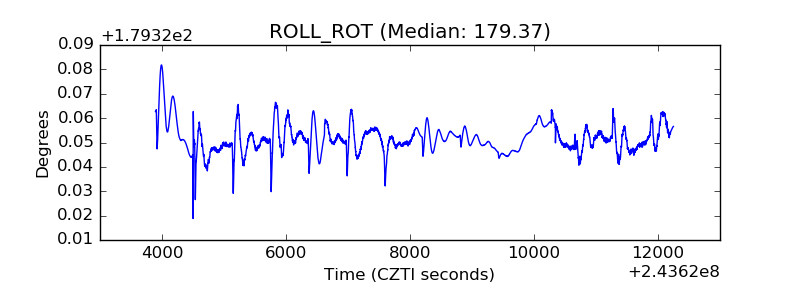 |
| _Roll_DEC | 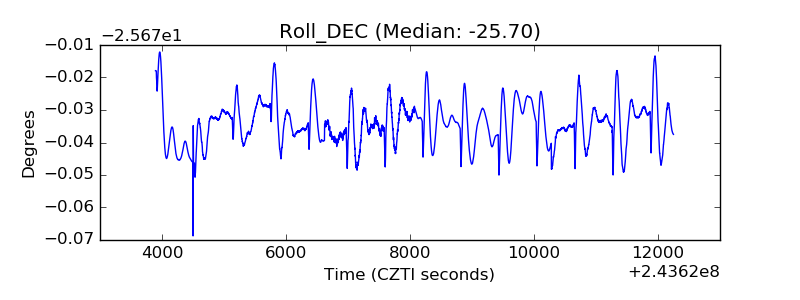 |
| _Roll_RA | 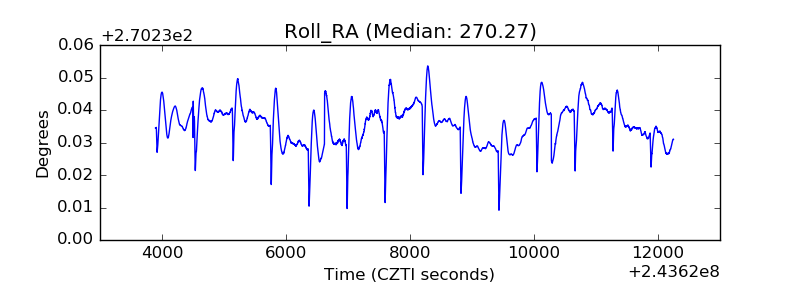 |
| Veto Counter | 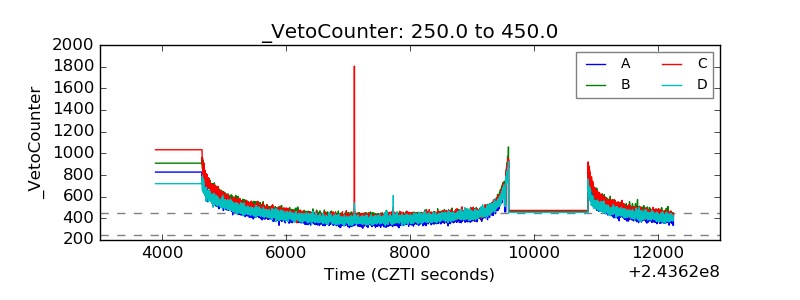 |